


INTRODUCTION
Northern China is located in the transition between arid and subhumid climatic zones, within the arable–pastoral ecotone. Changes in hydroclimate, mainly controlled by the East Asian summer monsoon (EASM), present significant challenges to the management of freshwater resources and the food security of this region. Thus, the formulation of plans for domestic and agricultural water use and an assessment of the possible impacts of global climate change on the hydroclimate of northern China are urgently needed. Previous research has shown that increased global temperatures may lead to higher temperatures and drought events in northern China (Zhang et al., Reference Zhang, Jeong, Yoon, Kim, Wang, Linderholm, Fang, Wu and Chen2020), which would accelerate the drying of lakes. Evaporation from the lakes is estimated to increase by ~17.7% annually by the end of this century (Wang et al., Reference Wang, Lee, Xiao, Liu, Schultz, Wang, Zhang and Zhao2018). This scenario is consistent with the prediction of Held and Soden (Reference Held and Soden2006) that Earth's dry regions will experience intensifying droughts with ongoing global warming. However, others have argued that future temperature rises of 2–3°C in SE Asia could lead to a northward shift of the EASM rainfall belt and subsequent increased precipitation in northern China (Yang et al., Reference Yang, Ding, Li, Wang, Jiang and Huang2015; Huang et al., Reference Huang, Yang, Haywood, Jiang, Wang, Sun, Tang and Ding2021). Thus, the nature of the hydroclimatic response of northern China to ongoing global warming remains controversial.
The global mean temperature during the mid-Holocene, the most recent major warm period, was 0.7–2°C higher than today (Marcott et al., Reference Marcott, Shakun Jeremy, Clark Peter and Mix Alan2013; Shi et al., Reference Shi, Lu, Guo, Yin, Wu, Xu and Zhang2021), and thus the climate of this interval is a potential analogue for future warming (Renssen et al., Reference Renssen, Seppä, Crosta, Goosse and Roche2012). In northern China, loess deposits were mainly derived from nearby arid and semiarid regions (Liu, Reference Liu1985). The grain-size distribution (GSD) of loess is principally controlled by the source-to-sink distance, that is, generally speaking, the greater the dust transport distance, the finer the grain size for dust deposit (Yang and Ding, Reference Yang and Ding2004, Reference Yang and Ding2008; Ding et al., Reference Ding, Derbyshire, Yang, Sun and Liu2005).Therefore, loess grain size is an effective proxy for reconstructing the source–sink distances and, for this study, desert margin migrations associated with the movement of the EASM rainfall belt (Ding et al., Reference Ding, Derbyshire, Yang, Sun and Liu2005; Yang and Ding, Reference Yang and Ding2008; Li et al., Reference Li, Song, Qiang, Miao and Zeng2019). Chinese loess is mainly composed of loosely cemented silt (Liu, Reference Liu1985), which is vulnerable to erosion, especially during the Holocene (Yang and Ding, Reference Yang and Ding2008; Chen et al., Reference Chen, Qiang, Zhou, Xiao, Chen and Sun2013; Qiang et al., Reference Qiang, Liu, Jin, Song, Huang and Chen2014). Sediments preserved in lakes in downwind, semiarid regions provide a continuous record of regional eolian activity (Qiang et al., Reference Qiang, Liu, Jin, Song, Huang and Chen2014; Chen et al., Reference Chen, Chen, Zhang, Chen, Wang, Gowan and Qiang2020). However, lake sediments represent a mixture of materials from different sources, reworked and sorted by hydrodynamic processes within the lake proper (Håkanson and Jansson, Reference Håkanson and Jansson1983; Talbot and Allen, Reference Talbot, Allen and Reading1996), resulting in polymodal GSDs. These sediments represent challenges to partitioning out the eolian component. A recently developed grain-size endmember (EM) model can help unmix GSD data into the constituent components (Paterson and Heslop Reference Paterson and Heslop2015). This model has been successfully applied in the reconstructions of sediment provenance, depositional regimes/processes, and paleoclimate in the Tibetan Plateau, Central Asia, and East Africa (Meyer et al., Reference Meyer, Davies, Vogt, Kuhlmann and Stuut2013, Reference Meyer, Van Daele, Tanghe, De Batist and Verschuren2020; Dietze et al., Reference Dietze, Maussion and Ahlborn2014; Liu et al., Reference Liu, Vandenberghe, An, Li, Jin, Dong and Sun2016; Zhou et al., Reference Zhou, Wu, Ma and Qiang2019).
Many of the closed-basin lakes on the northern margin of the EASM (Fig. 1) are very sensitive to hydrological changes, because their water input is mainly from monsoonal rainfall, and thus their sediments are valuable archives for determining the paleohydrology and paleoclimate of this region (An et al., Reference An, Porter, Kutzbach, Wu, Wang, Liu, Li and Zhou2000; Li et al., Reference Li, Wang, Zhao, Jin, Wang, Tao and Chen2020). In this study, we analyzed the GSDs and carbonate mineralogy of the sediments of Lake Bayanchagan, with the aim of reconstructing changes in lake level and dust activity during the Holocene, focusing on the hydroclimatic response of northern China to the most recent period of major global warming.
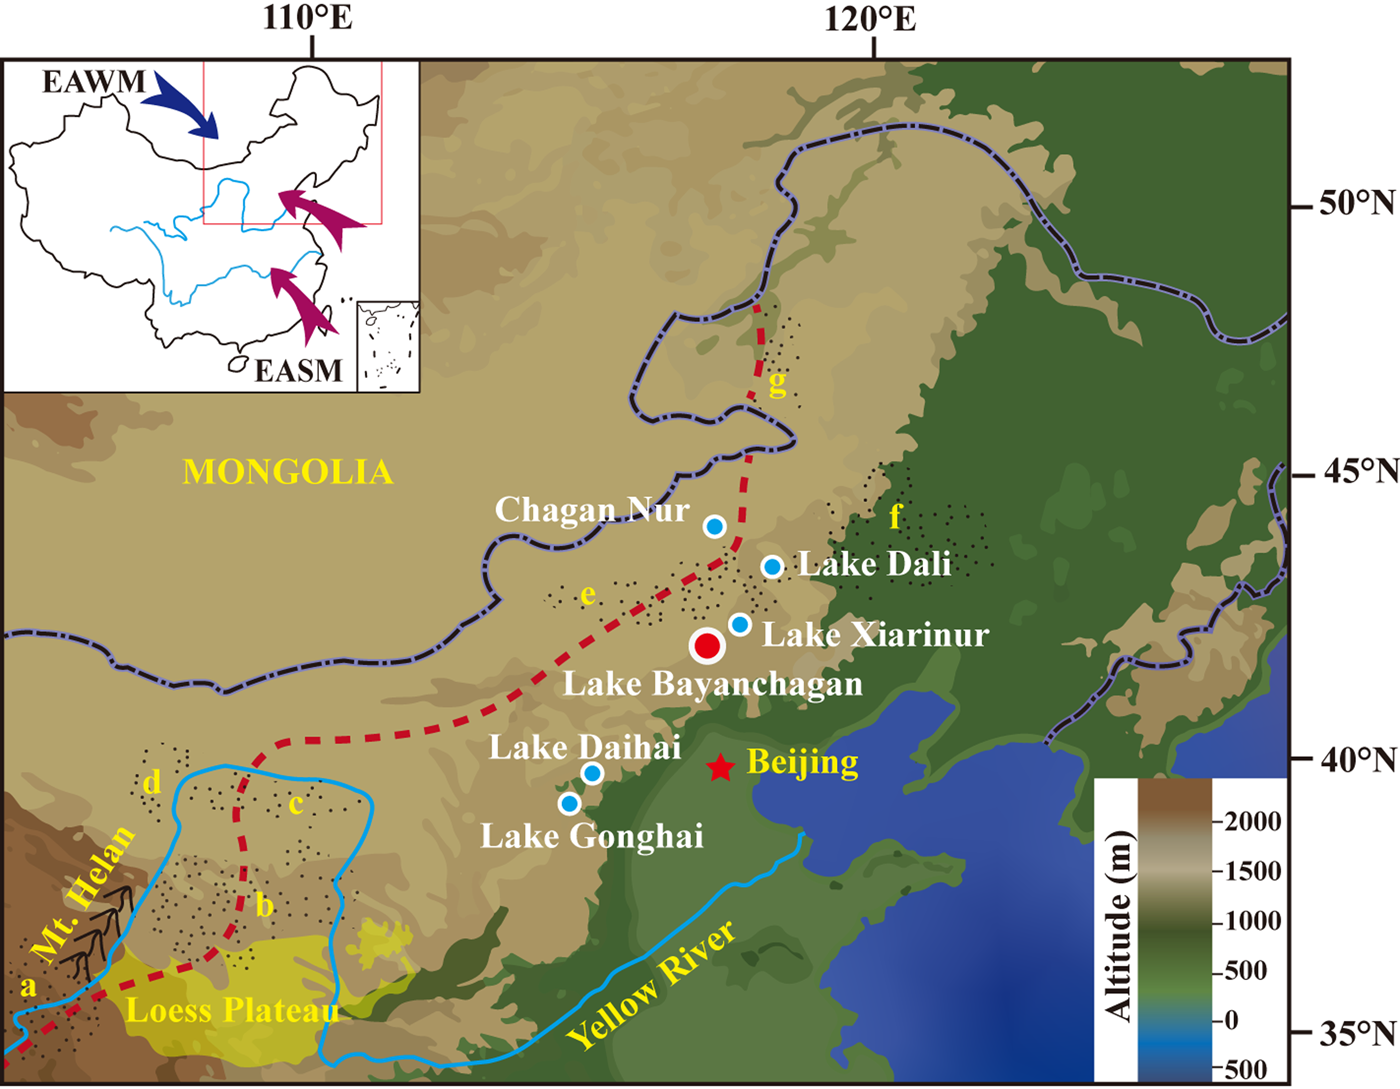
Figure 1. The locations of Lake Bayanchagan and other sites referenced in the text. Also shown are the major deserts of northern China: (a) Tengger Desert, (b) Mu Us Desert, (c) Hobq Desert, (d) Ulan Buh Desert, (e) Otindag Sandy Land, (f) Horqin Sandy Land, and (g) Hulun Buir Sandy Land (modified after Yang and Ding, Reference Yang and Ding2008). The red dashed line indicates the modern summer monsoon boundary (Yang et al., Reference Yang, Dong and Xiao2019), and the arrows indicate the modern trajectory of the East Asian summer monsoon (EASM) (red) and the East Asian winter monsoon (EAWM) (blue).
MATERIALS AND METHODS
Lake Bayanchagan (41.64°N, 115.21°E, 1355 m above sea level) is located in the transition between desert and steppe environments in northern China (Fig. 1). The lake is almost completely dry at present, due to human activity, although small shallow areas of water are maintained by summer rainfall. The clastic sediments in Lake Bayanchagan are mainly derived from eolian deposits and runoff-transported materials from the catchment. The present-day climate is mainly controlled by the East Asian monsoon, which comprises two seasonally alternating atmospheric circulations. In winter, a northwesterly dry, cold air mass from Siberia leads to cold and dry weather, while in summer, a southeasterly air mass transports heat and moisture inland from the low-latitude oceans. The mean annual temperature and the mean temperature in January and July are 3°C, −16°C, and 17°C, respectively. The annual precipitation is ~350 mm, ~70% of which falls in summer (June to September).
A sediment core (BY) was collected from a trench area in the center of Lake Bayanchagan. Details of the sedimentary lithology, results of 14C dating, and the pollen stratigraphy of this core are presented elsewhere (Jiang et al., Reference Jiang, Guo, Sun, Wu, Chu, Yuan, Hatté and Guiot2006). Two dates from Potamogeton seeds in the core were excluded, as some species of this aquatic plant have submerged leaves, and hence subaquatic photosynthesis might introduce a hard-water error into any subsequent 14C date (Törnqvist et al. Reference Törnqvist, De Jong, Oosterbaan and Van Der Borg1992). A sample of the total organic carbon content of the uppermost sediments (0–2 cm depth) had a 14C age of 570 yr (Table 1). This date, older than the actual age, is likely caused by the influx of “old carbon” to the lake from the catchment or by coastal erosion (Olsson, Reference Olsson2009; Hou et al., Reference Hou, D'Andrea and Liu2012). This radiocarbon reservoir age of Lake Bayanchagan is approximately consistent with those of Lakes Hulun (685 yr; Wen et al., Reference Wen, Xiao, Chang, Zhai, Xu, Li, Itoh and Lomtatidze2010), Dali (611 yr; Xiao et al., Reference Xiao, Chang, Si, Qin, Itoh and Lomtatidze2009), and Daihai (360 yr; Peng et al., Reference Peng, Xiao, Nakamura, Liu and Inouchi2005) in the northern margin of the EASM. To establish an age–depth model, we assumed that the proportion of “old carbon” was relatively constant throughout the core. The reservoir age of 570 yr was subtracted from all the original 14C ages, and the resulting ages were then converted to calibrated ages using the IntCal 20 calibration curve (Stuiver et al., Reference Stuiver, Reimer and Reimer2020; Fig. 2).
Table 1. Accelerator mass spectrometry dating results for core BY from Lake Bayanchagan, northern China

a Jiang et al. (Reference Jiang, Guo, Sun, Wu, Chu, Yuan, Hatté and Guiot2006).
b CALIB rev. 8 (Stuiver and Reimer, Reference Stuiver and Reimer1993; http://calib.org)
c GifA: the LSCE-UMR CEA/CNRS 1572 (Gif-sur-Yvette, France) for sample preparations and UMS2004 (Gif-sur-Yvette, France) for physical measurements.

Figure 2. Lithology and median grain-size (Md) data, along with age–depth model data for core BY from Lake Bayanchagan. TOC, total organic carbon.
The GSDs of 90 samples, taken at 2 cm intervals, were measured with a Mastersizer 3000 (Malvern Panalytical, UK). Before the measurements were made, all samples were treated with 30% H2O2 and then with 10% HCl to remove organic matter and carbonate, respectively, after which 10% (NaPO3)6 was added, and the samples were treated with ultrasound for 10 min to promote dispersion. The average GSDs, determined by three repeated measurements for each sample, were used as input data for subsequent calculations. The resulting GSD data set was mathematically decomposed using the AnalySize modeling algorithm developed by Paterson and Heslop (Reference Paterson and Heslop2015). This method aims to establish a physical mixing model that transforms the measured GSDs into a limited number of nonnegative and unimodal grain-size EMs that can be interpreted individually (Meyer et al., Reference Meyer, Van Daele, Tanghe, De Batist and Verschuren2020).
The carbonate mineralogy of 30 samples from the core was analyzed by X-ray diffraction (XRD; RINT2000 Wide-angle goniometer).
RESULTS
GSDs
During 11.5–10 ka (180–142 cm) (Fig. 3a), the median grain size (Md) varied from 203.4 to 5.8 μm. Most of the samples have trimodal GSDs, with a principal mode at 7.8 μm and two secondary modes at 38 and 0.448 μm. Samples from the depths of 180, 178, 160, 158, 152, and 148 cm have multimodal distributions, with the principal mode between 100 and 609 μm. For example, the GSDs of the samples from the depths of 152 and 148 cm show a major peak at ~410 μm and four minor peaks at 0.448, 7.8, 38, and 152 μm (Fig. 3a). The samples at 160 and 158 cm are roughly bimodal, with the principal mode at ~124 μm and secondary modes at 226 and 410 μm. During 10–5.8 ka (142–46 cm) (Fig. 3b), Md varied between 19.1 and 4.2 μm. The samples have relatively consistent bimodal GSDs, with the major peak at 7.8 μm and a minor peak at 38 μm. During 5.8–0 ka (46–0 cm) (Fig. 3c), Md varied from 39.2 to 4.5 μm, and all the samples have trimodal GSDs, in most cases with the main peak at 7.8 μm and two minor peaks at ~38 and 0.448 μm.

Figure 3. Core BY data. (a–c) Grain-size distributions (GSDs). (d) C–M plot: C indicates the coarsest percentile of the GSDs (the value at 99%), and M indicates the median (the value at 50%).
On the C–M plot of grain-size data, where C and M indicate the coarsest percentile (the value at 99%) and the median (the value at 50%) of the GSDs, respectively, three transport mechanisms can be partitioned according to the combination of C and M values, that is, suspension and rolling, uniform suspension, and pelagic suspension (Passega, Reference Passega1964; Fig. 3d). A C–M plot of the grain-size data from core BY reveals three main groupings (Fig. 3d). The sediments from the depth interval of 180–142 cm fall within all three groups, while those from the intervals of 142–46 and 46–0 cm mainly fall within the pelagic suspension and uniform suspension fields, respectively (Fig. 3d).
EM modeling
The goodness-of-fit statistics show an increasingly better fit (higher R 2) to the raw GSD spectra as the number of EMs increases (Fig. 4a). Thus, we chose a model with four EMs, which explains more than 92% of the variance in the GSDs (Fig. 4a). All EMs have unimodal distributions (Fig. 4b). The modeled peaks of these EMs are ~0.448 μm (EM1), ~7.8 μm (EM2), 38 μm (EM3), and 152 μm (EM4), representing the four major modes—at 0.448, 7.8, 38, and 100–410 μm—indicated by the entire GSD data set (Fig. 4b).

Figure 4. (a) Plot of the coefficient of determination (R 2) versus the number of grain-size endmembers (EMs) chosen to model the observed grain-size distributions (GSDs), from 1 to 10. (b) Overlay plot of the GSDs of all samples (n = 90) (gray curves) and the three retained EMs (colored curves). (c) Characteristic GSDs of surface sediments collected in the center (left), transitional zone (middle), and nearshore zone (right) of lakes in northern China (modified from Guo et al., Reference Guo, Wang, Wang, Liu, Ma and Jiang2016). (d) Dominant modes of the GSDs of surface sediment samples from the nearshore zone of lakes (red) (Guo et al., Reference Guo, Wang, Wang, Liu, Ma and Jiang2016; Xu et al., Reference Xu, Wang, Gu, Hao, Wang, Chu, Jiang, Liu and Qin2018), loess sediments (blue) (Yang and Ding, Reference Yang and Ding2004), and the offshore-suspension component in sediments from Lake Dali (green) (Xiao et al., Reference Xiao, Chang, Si, Qin, Itoh and Lomtatidze2009).
During 11.5–10.2 ka, EM1 values fluctuated between 0.3% and 7.1%. During 10.2–5.8 ka, the proportion of EM1 was very low, averaging at 1.66%, except for two short pulses at 7.9 ka and 6.9 ka. The fluctuations of EM1 increased during 5.8–3.3 ka, followed by a decrease after 3.3 ka.
During 11.5–11.3 ka, EM2 increased from 26% to 98%, followed by a rapid decrease to 5% during 11.3–10.8 ka and an increase to ~60% during 10.8–10.0 ka. During 10.0–5.8 ka, the relative dominance of EM1 was relatively high (>79%), while subsequently, during 5.8–0 ka, its values fluctuated with a decreasing trend.
The proportion of EM3 was very low before 5.8 ka, except for two periods during 11.3–9.5 ka and during 8–6.3 ka. After 5.8 ka, its values fluctuated with an increasing trend (mean ~33.6%). The proportion of EM4 fluctuated between 90% and 0% during 11.5–10.8 ka. It was almost absent during 10.8–5 ka and then increased slightly after 5 ka.
Carbonate mineralogy
The XRD results (Fig. 5) show that during 11.5–5.8 ka, calcite dominated the carbonate fraction, with the average content of 47% and the maximum occurring during 10–5.8 ka, during which time dolomite was not detected. During 5.8–4.4 ka, dolomite content increased rapidly to ~30%, at the expense of calcite. During 4.4–1.8 ka, minor fluctuations occurred in both calcite and dolomite content, while after 1.8 ka, dolomite content decreased and calcite content increased.

Figure 5. Records of the proportions of EM1, EM2, EM3, EM4, calcite, dolomite, and carbonate δ18O of core BY. EM, grain-size endmember.
DISCUSSION
Holocene changes in lake level and precipitation on the northern margin of the EASM
Clastic materials from different sources get deposited in the lake and are then reworked and sorted by hydrodynamic processes within the lake itself (Håkanson and Jansson, Reference Håkanson and Jansson1983; Talbot and Allen, Reference Talbot, Allen and Reading1996). Coarse particles tend to be deposited in the nearshore zone, while fine-grained sediments are more common in the deeper waters (Lerman, Reference Lerman1978; Dietze et al., Reference Dietze, Maussion and Ahlborn2014). Investigations of 68 lakes in the marginal zone of the EASM have confirmed this relationship between lake water depth and sediment grain size (Guo et al., Reference Guo, Wang, Wang, Liu, Ma and Jiang2016). As shown in Figure 4c, the sediment grain size gradually decreases from 170–500 μm in the nearshore zone to 17–150 μm in the transitional zone, and finally to 2–70 μm in the lake center (Guo et al., Reference Guo, Wang, Wang, Liu, Ma and Jiang2016).
EM2 represents the relatively fine particle fraction in the Lake Bayanchagan sediments, with a mean grain size of 6.9 μm (90% within the range of 1.3–31 μm) (Fig. 4b). The dominant grain sizes of EM2 are consistent with the offshore-suspension component of sediments in the lake center, as indicated by previous investigations (Xiao et al., Reference Xiao, Chang, Si, Qin, Itoh and Lomtatidze2009; Guo et al., Reference Guo, Wang, Wang, Liu, Ma and Jiang2016; Fig. 4d). Therefore, EM2 dominates the clastic component of the profundal sediments in Lake Bayanchagan, and it is a proxy for past lake-level changes. The record of EM2 in core BY indicates that the level of Lake Bayanchagan gradually increased during 10.8–10.0 ka and reached a high stand during 10–5.8 ka. Lake levels decreased after 5.8 ka (Fig. 5).
The high stand of Lake Bayanchagan during ~10–5.8 ka is supported by the C–M plot for core BY, which illustrates that sediment transport is linked to hydrodynamic conditions (Passega, Reference Passega1964; Bravard et al., Reference Bravard, Goichot and Tronchère2014). As shown in Figure 3d, the GSDs of sediments in the lower part of core BY (180–142 cm, 11.5–10 ka) are distributed within three zones, suggesting that the hydrodynamic conditions fluctuated substantially during this interval. The GSDs of the sediments in the middle part of the core (142–46 cm, 10–5.8 ka) are distributed mainly in the lower left part of the graph, in the pelagic suspension zone, with the C values of most samples <100 μm, indicating weak hydrodynamic conditions related to a high stand of Lake Bayanchagan. The samples from the upper part of the core (46–0 cm, 5.8 ka to the present) are concentrated in the left-central part of the suspension zone, with C values >100 μm, reflecting a relatively strong hydrodynamic environment due to the lowered lake levels.
Precipitation of lacustrine carbonate is primarily determined by the salinity and Mg/Ca ratio of the lake water (Müller et al., Reference Müller, Irion and Förstner1972). As salinity increases, calcite precipitates first, followed by aragonite and dolomite (Shapley et al., Reference Shapley, Ito and Donovan2005). This scenario is consistent with an investigation of modern lakes in northern China, which showed that lake water salinity and Mg/Ca ratios increase with decreasing precipitation. As a result, calcite precipitates first, followed by dolomite, and then finally by gypsum and halite (Gu et al., Reference Gu, Jiang, Wang, Zhang, Yang and Xiong2015). In core BY, the increase in dolomite at the expense of calcite during 5.8–4.6 ka provides depositional evidence for the salinization of the lake (Fig. 5), indicative of decreasing precipitation and increasing aridity at the study area. This finding agrees with the stable oxygen isotopic composition of authigenic carbonate in core BY. The oxygen isotopic composition of carbonate is mainly controlled by the δ18O of the lake water, namely the balance between precipitation and evaporation (Leng and Marshall, Reference Leng and Marshall2004). Increased monsoonal precipitation results in lower water δ18O values, whereas evaporation results in higher values (Leng and Marshall, Reference Leng and Marshall2004; Yang et al., Reference Yang, Ding, Wang, Tang and Gu2012). The carbonate δ18O record of core BY suggests enhanced monsoonal precipitation during 10.1–5.8 ka, followed by a large reduction during 5.8–4.6 ka (Jiang and Liu, Reference Jiang and Liu2007). The similarity between the carbonate δ18O and EM1 records, together with the variations of the calcite and dolomite content (Fig. 5), indicate that fluctuations in the lake level of Lake Bayanchagan over the Holocene were closely linked to changes in monsoonal precipitation.
High lake levels during the Early and Middle Holocene have also been observed in records from other closed-basin lakes on the northern margin of the EASM (Fig. 6). Lake beach ridges and sediment outcrops, which represent past variations in lake-level elevation and extent (Goldsmith et al., Reference Goldsmith, Broecker, Xu, Polissar, deMenocal, Porat, Lan, Cheng, Zhou and An2017), have been investigated for Lakes Dali and Chagan Nur. The results suggest that, between ~11 and ~5.9–5 ka, lake levels were 12–60 m higher than today (Goldsmith et al., Reference Goldsmith, Broecker, Xu, Polissar, deMenocal, Porat, Lan, Cheng, Zhou and An2017; Li et al., Reference Li, Wang, Zhao, Jin, Wang, Tao and Chen2020; Fig. 6). A recent study of Lake Gonghai, based on the aquatic origin of branched glycerol dialkyl glycerol tetraethers (brGDGTs), indicated high lake levels during 9.5–5 ka (Cao et al., Reference Cao, Rao, Shi, Lian and Jia2021; Fig. 6). Thus, the concordance of these studies suggests that, within the limits of the available chronologies, high lake levels on the northern margin of the EASM occurred consistently during ~10–5 ka. Furthermore, precipitation reconstructions based on pollen assemblages and biomarkers in lake sediments also show a consistent relationship with lake-level changes (Jiang et al., Reference Jiang, Guo, Sun, Wu, Chu, Yuan, Hatté and Guiot2006; Chen et al., Reference Chen, Xu and Chen2015; Cao et al. Reference Cao, Rao, Shi, Lian and Jia2021; Fig. 6).

Figure 6. Comparisons of paleoenvironmental records from the northern margin of the EASM and global annual temperature. (a and b) Precipitation reconstructed from pollen data from Lake Bayanchagan (Jiang et al., Reference Jiang, Guo, Sun, Wu, Chu, Yuan, Hatté and Guiot2006) and Lake Gonghai (Chen et al., Reference Chen, Xu and Chen2015). (c–f) Lake-level records from Lake Dali (Goldsmith et al., Reference Goldsmith, Broecker, Xu, Polissar, deMenocal, Porat, Lan, Cheng, Zhou and An2017), Lake Chagan Nur (Li et al., Reference Li, Wang, Zhao, Jin, Wang, Tao and Chen2020), and Lake Gonghai based on branched glycerol dialkyl glycerol tetraether (brGDGT) data (Cao et al., Reference Cao, Rao, Shi, Lian and Jia2021), and Lake Bayanchagan (this study). (g and h) Pollen-based temperature reconstruction from Lake Bayanchagan (Jiang et al., Reference Jiang, Guo, Sun, Wu, Chu, Yuan, Hatté and Guiot2006) and reconstructed global annual temperature (Marcott et al., Reference Marcott, Shakun Jeremy, Clark Peter and Mix Alan2013). EM2, grain-size endmember 2; TANN, mean annual temperature.
Holocene dust activity on the northern margin of the EASM
EM1 is consistent with the peak at ~0.4 μm of the GSDs for loess deposits in the Chinese Loess Plateau (Yang and Ding, Reference Yang and Ding2004; Fig. 4d). Generally, the very fine component may adhere to the surfaces of large grains, forming aggregates that can be transported by saltation or rolling (Pye, Reference Pye1995; Derbyshire et al., Reference Derbyshire, Meng and Kemp1998; Qiang et al., Reference Qiang, Lang and Wang2010). The fine material may be disaggregated after being deposited in the lake or being treated with ultrasound before grain-size measurements.
EM3 represents the relatively coarse fraction of the Lake Bayanchagan sediments. Its broad peak at ~38 μm (90% within the range of 14–102 μm) (Fig. 4b) is very similar to the dominant mode of coarse loess in the northern part of the Loess Plateau (Sun et al., Reference Sun, Su, Bloemendal and Lu2008; Yang and Ding, Reference Yang and Ding2008; Fig. 4d). The consistent variations in EM3 and EM1 suggest that these two portions are transported by wind and can be interpreted as indicators of variations in regional dust sources.
EM4 reflects the coarsest fraction of the Lake Bayanchagan sediments. Its peak at 152 μm (90% within the range of 68–500 μm) (Fig. 4b) is similar to the dominant mode of the nearshore sediments (Guo et al., Reference Guo, Wang, Wang, Liu, Ma and Jiang2016; Xu et al., Reference Xu, Wang, Gu, Hao, Wang, Chu, Jiang, Liu and Qin2018; Fig. 4d). Lake Bayanchagan is located within the southern margin of the Otindag Sandy Land (Fig. 1); therefore, EM4 is most likely sourced from local dunes.
The paleoenvironmental record of EM1, EM3, and EM4 within core BY demonstrates that dust activity in the region fluctuated during the 11.5–10 ka interval, while the low values of these three EMs indicate low dust activity during the 10–5.8 ka interval. EM3 increased by ~33% during 5.8–3.8 ka, indicating increased dust activity, which subsequently remained at an overall high level, despite several intervals of low dust activity (Fig. 5).
Dust storm activity is a function of the environmental conditions within the dust source region, including precipitation amount, vegetation cover, and wind strength (Clemens, Reference Clemens1998; Carolin et al., Reference Carolin, Walker and Day2019). The major deserts in northern China include the Mu Us Desert, Hobq Desert, Horqin Sandy Land, and Hulunbuir Sandy Land (Fig. 1). All of these deserts are important global dust sources (Dong et al., Reference Dong, Wang and Li1998; Zhang et al., Reference Zhang, Shen, Li, Jia, Li and Wang2018). Paleoclimatic records indicate that monsoonal precipitation began to increase in the Early Holocene (~11–10 ka) and reached a maximum during ~9–6 ka (Jiang et al., Reference Jiang, Guo, Sun, Wu, Chu, Yuan, Hatté and Guiot2006; Chen et al., Reference Chen, Xu and Chen2015; Li et al., Reference Li, Wang, Zhao, Jin, Wang, Tao and Chen2020). Both the vegetation cover and plant diversity gradually increased with this increasing precipitation. During ~11–10 ka, steppe vegetation prevailed, dominated by Artemisia, Chenopodiaceae, Poaceae, and Ephedra. During 9–6 ka, there was an increase in deciduous broadleaved trees (Betula, Ulmus, Quercus), which were the most diverse plant group throughout the Holocene, together with Pinus (Xiao et al., Reference Xiao, Xu, Nakamura, Yang, Liang and Inouchi2004; Jiang et al., Reference Jiang, Guo, Sun, Wu, Chu, Yuan, Hatté and Guiot2006; Xu et al., Reference Xu, Xiao, Li, Tian and Nakagawa2010; Wen et al., Reference Wen, Xiao, Chang, Zhai, Xu, Li, Itoh and Lomtatidze2010, Reference Wen, Xiao, Fan, Zhang and Yamagata2017; Chen et al., Reference Chen, Xu and Chen2015). An increase in the vegetation cover reduces the surface wind strength and increases the soil stability. All these factors, including the increased precipitation and vegetation cover and the decreasing wind strength, led to a large reduction in dust emissions. Therefore, the low dust activity during 10–5.8 ka was likely a response to the humid climate on the northern margin of the EASM. The increased dust activity after 5.8 ka was then related to large-scale drought conditions and the associated vegetation degradation caused by the decrease in monsoonal precipitation.
The stratigraphy in deserts is characterized by the alternation of eolian sand layers and paleosols. These alternating sequences cover an area of ~105 km2 in the deserts located to the east of the Helan Mountains (Zhang et al., Reference Zhang, Shen, Li, Jia, Li and Wang2018; Fig. 1). Eolian sand layers represent periods of dune-field expansion and/or dune buildup and are associated with enhanced dust activity, whereas paleosol layers indicate dune stabilization, weakened dust activity, and increased vegetation cover (Lu et al., Reference Lu, Mason and Stevens2011; Xu et al., Reference Xu, Wang, Gu, Hao, Wang, Chu, Jiang, Liu and Qin2018). Therefore, the eolian sand–paleosol sequences are an archive of changes in the intensity and frequency of paleo-eolian sand activity. A recent study showed that paleosol development in the deserts of northern China started at ~11 ka and that the proportion of vegetation-stabilized dunes gradually increased until ~6 ka (Xu et al., Reference Xu, Mason, Xu, Yi, Bathiany, Yizhaq, Zhou, Cheng, Holmgren and Lu2020), indicating a trend of decreasing dust activity during 11–6 ka. After ~6–5 ka, the reduction of the proportion of vegetation-stabilized dunes, as well as less frequent and thinner paleosols, indicate dune reactivation (Yang et al., Reference Yang, Scuderi and Paillou2011; Lu et al., Reference Lu, Yi and Xu2013; Xu et al. Reference Xu, Mason, Xu, Yi, Bathiany, Yizhaq, Zhou, Cheng, Holmgren and Lu2020), which is consistent with our inference of intensified dust emissions.
Holocene lake high stands on the northern margin of the EASM region
Our study has illustrated that the high stand of Lake Bayanchagan corresponded to the interval of high monsoon precipitation and low dust activity during the ~10–5.8 ka interval, in accord with other paleoclimatic records from the northern margin of the EASM (Goldsmith et al., Reference Goldsmith, Broecker, Xu, Polissar, deMenocal, Porat, Lan, Cheng, Zhou and An2017; Xu et al., Reference Xu, Wang, Gu, Hao, Wang, Chu, Jiang, Liu and Qin2018; Li et al., Reference Li, Wang, Zhao, Jin, Wang, Tao and Chen2020). The temperature in northern China during this interval increased by ~2–4°C (Jiang et al., Reference Jiang, Guo, Sun, Wu, Chu, Yuan, Hatté and Guiot2006; Zhang et al., Reference Zhang, Wu, Cheng, Geng, Li, Sun, Yu, Lu and Guo2022; Fig. 6), suggesting that, during ~10–6 ka, high precipitation occurred synchronously with high temperatures across northern China. Geological records and climate simulations show that the displacement of the EASM rain belt is associated with the migration of the Intertropical Convergence Zone (ITCZ), which moved northward in response to pronounced Northern Hemisphere warming during the mid-Holocene (Yang et al. Reference Yang, Ding, Li, Wang, Jiang and Huang2015, Reference Yang, Dong and Xiao2019; Huang et al., Reference Huang, Yang, Haywood, Jiang, Wang, Sun, Tang and Ding2021; Sun et al., Reference Sun, Yang, Xiao, Wang, Huang, Zhang, Yang, Jiang and Ding2022). This led to the northward shift of the monsoonal rain belt, causing a widespread increase in precipitation, which in turn resulted in lake high stands on the northern margin of the EASM. As global warming continues, the northern margin of the EASM is projected to become wetter, and dust storm activity will be weakened (Yang et al. Reference Yang, Ding, Li, Wang, Jiang and Huang2015; Huang et al., Reference Huang, Yang, Haywood, Jiang, Wang, Sun, Tang and Ding2021).
CONCLUSIONS
We used a high-resolution grain-size record, along with carbonate mineralogy, from sediments of Lake Bayanchagan on the northern margin of the EASM to reconstruct changes in lake level and dust activity over the past 11.5 ka. The results show that the level of Lake Bayanchagan was relatively low during 11.5–10.8 ka, and that then it gained water during ~10.8–10 ka. The high stand of Lake Bayanchagan and low level of dust activity occurred during ~10–5.8 ka. After 5.8 ka, the lake level decreased, corresponding to increased dust activity. The strong similarity between the carbonate δ18O and grain-size records of Lake Bayanchagan, together with the variations of sedimentary calcite and dolomite contents, indicate that the lake-level fluctuations of Lake Bayanchagan during the Holocene were driven by changes in monsoonal precipitation. A regional comparison suggests that lake-level high stands and high precipitation values occurred synchronously on the northern margin of the EASM during ~10 to ~6 ka, corresponding to the Holocene thermal maximum. At this time, the ITCZ had moved northward in response to this significant climatic warming, driving a northwestward shift of the EASM rain belt and enhanced monsoonal rainfall. After 5.8 ka, the ITCZ had migrated southward due to the decreasing temperatures, leading to a southeastward shift of the EASM rain belt and decreased monsoonal precipitation. This climatic change was associated with extensive drought conditions, falling lake levels, and enhanced dust activity.
Acknowledgments
We thank Nicholas Lancaster, Randall Schaetzl, Inka Meyer, and Zhiwei Xu for their constructive comments, which greatly improved the article. This study was supported by the National Natural Science Foundation of China (41931181 and 41725010), the National Key Research & Development Program of China (2020YFA0607703), the Strategic Priority Research Program of Chinese Academy of Sciences (CAS) (XDB26000000 and XDB31000000), and the Key Research Program of the Institute of Geology & Geophysics, CAS (IGGCAS-201905).


