

I leave to various future times, but not to all, my garden of forking paths.
Jorge Luis BorgesFootnote 1
This article explores a set of rarely addressed themes, including the transmission and loss of geographical knowledge in relation to the techniques (drawing, engraving, printing) used in mapmaking, the importance of production sites for the transmission (or not) of cartographical knowledge, and the ways in which a comparative history of mapping practices may inform our critical understandings of the early modern world. Two maps illustrate the matter to perfection. The first, hand-drawn in Goa in 1560, includes on its northern fringe, in an area usually ignored by historians of Portuguese cartography, sketches of the Caspian Sea and Lake Van (plate 1).Footnote 2 The second, a printed map produced by the Venetian mapmaker Giacomo Gastaldi in 1559–1561, represents the same two bodies of water along with many other geographical details of the region (plate 2).Footnote 3 Gastaldi reproduced the Caspian along the lines of a model associated with Ptolemy, while relying loosely on information gleaned from Portuguese maps of the Persian Gulf. His main focus was on offering his public myriad toponyms for inland areas. The anonymous Goan mapmaker, in contrast, proposed a new model for the Caspian Sea and offered an image of the Persian Gulf based on recent Portuguese observations. Clearly, his focus was the maritime shoreline, while other mainland areas were left almost entirely blank. There could hardly be a starker indication that, behind the scenes of what we still conventionally call “Renaissance cartography,” the tensions were substantial.Footnote 4
To be sure, historians of European mapmaking have long acknowledged that information first collected by Iberian navigators in various parts of the world from the fifteenth century onwards was compiled, digested, transformed, and made public, increasingly in print form, by professional mapmakers in Italy. They recognized that the latter often labored to reconcile the new “discoveries” with the work of Ptolemy, and that their comprehensive maps were eventually appropriated, with even greater commercial success, by individual entrepreneurs and workshops in the Low Countries. Because all this happened at a time when neither Italian nor Dutch ships ventured into distant Asian waters, the demise of the Portuguese and Spanish manuscript mapping tradition is quite clearly related to the development of map printing techniques outside Iberia, suggesting that the rise of northwestern Europe as a center of mapmaking was closely intertwined with the print revolution. Moreover, the shift of map production from Venice and Antwerp to Amsterdam in the late sixteenth century can be read as proof of an accelerated development of scientific production in Protestant societies.Footnote 5 In recent decades, scholarship has significantly expanded this traditional view, notably showing that Iberians themselves engaged in appropriation and obliteration as much of their data was obtained on the ground from people familiar with local and regional geographical features. Catholic science and worldmaking have been the subjects of significant reassessment, which has undermined once-dominant notions locating the scientific revolution exclusively in Protestant northwestern Europe.Footnote 6 And of course the very notion of a European-led scientific revolution has been called into question by some: it may have been neither as European, nor as scientific, nor even as revolutionary as historians used to think.Footnote 7
A key problem that has remained largely unaffected by such developments in the scholarship, however, has to do with the very notion of knowledge “flowing” from one place to another. Several fundamental questions emerge in this regard. Firstly, on what grounds do we assume that information “flows”? The effortless mobility of knowledge in the early modern world—like that of people and things—has become naturalized in historiography through the widespread use of the metaphor of “circulation.”Footnote 8 But might it not be more useful to consider knowledge as “viscous,” or indeed solid, traveling in pieces and moving only when someone develops an interest in it? Art historians have argued for decades that “appropriation” is a more valid way of describing changes in style driven by outside developments than “influence”—yet another word based on the notion of flux. Would it make sense to take a similarly critical stance with regard to maps? Twenty-first-century historians interested in the study of global connections, and indeed in connectivity itself, face a dilemma when it comes to the history of knowledge. On the one hand, most scholars are rightly keen to emphasize instances of dialogue and cooperation across cultural boundaries. On the other, however, historians of science have begun to realize how stories of discontinuity, failed appropriations, and knowledge obliteration may be equally relevant.Footnote 9 As the cartographical historian J. B. Harley first suggested in the 1980s, it is worth studying the “silences and secrecies” of early modern cartography as much as the additions made to maps based on new contacts and explorations.Footnote 10 Harley’s proposition may appear somewhat crude and static today, but the problem of silencing becomes particularly relevant when set in the context of knowledge transmission between distinct centers of map production. Histories of knowledge erasure and the problem of “non-knowledge” now draw increasing attention to a subfield that Peter Burke christened “agnotology.”Footnote 11
Metaphors suggesting flux, unity, and organic growth may be hampering our understanding of the past of European science in more than one way. It may thus be as misleading as it is poetic to describe “European cartography” as having “roots” extending back to the south of the continent, suggesting the growth of a large tree whose branches reached for the sky in the north.Footnote 12 Indeed, can we legitimately talk about “cartography” at all, considering that the concept as such is a relatively recent invention? Some now think we ought to drop the word altogether, except to refer specifically to the “myth of cartography” born in the nineteenth century.Footnote 13 Yet this is easier said than done in most European languages other than English,Footnote 14 and a reconstructive critique of the term may be the better way forward. This, in addition, might be productively intertwined with a wider discussion about the (dis)connectivity of early modern societies.Footnote 15
Secondly, there is always the problem of metageography. How, and based on what criteria, do we define the spatial units between which knowledge—or anything else, for that matter—moved or failed to move? If we talk about a concatenation of early modern mapmaking traditions starting in Iberia, moving to Italy with offshoots in France and Germany, and eventually flourishing in the Low Countries, why the emphasis on this particular sort of geopolitical unit?Footnote 16 Why not talk about Lisbon, Seville, Venice, Dieppe, Antwerp, and so on? Why not specific workshops or particular neighborhoods? Is it even legitimate to venture that the locational aspect of tradition and transmission is more relevant than other factors pertaining to technology, social class, modes of production, the politics of knowing and forgetting, commercial models, material supports, and even gender relations? What exactly do we mean when we say that a certain piece of geographical knowledge—for example, the shape of a gulf or the position of a lake—moved “from Lisbon to Venice, and then to Antwerp”? Can we refine our thinking in this regard, so as to be critical of spatial units of analysis without necessarily dismissing local contingencies either? After all, the notion that people do things differently in different places (in the arts, in crafts, in governance, in warfare) did have considerable currency in the past we study.
Over the following pages, I propose to explore the ways mapmakers in Goa and Venice represented a particular area of the globe—the Safavid-Ottoman borderlands near the Caspian, and the surrounding areas of what we call the Middle East—in the sixteenth century, with a focus on the years around 1560. I will mention maps made in other places (Lisbon, Seville, Florence, Antwerp), and at other times (roughly between 1200 and 1800). Along the way, I will address an additional question that may help sharpen our understanding of differences and similarities in the mapmaking practices we associate with the Iberian world, the Italian city-states, and the Low Countries: the question of whether maps were made to represent the spatial realities of the land or those of the sea. For while we do not usually consider the Middle East as a “maritime region,” it is bordered by the Mediterranean, the Black Sea, the Caspian, the Persian Gulf, and the Red Sea. How, then, did mapmakers in the sixteenth century decide to engage with this space, and what decisions did they make regarding the emphasis of maps on the land or the water?
In technical terms the question of whether to chart the sea or the land makes limited sense to mapping professionals today. During the twentieth century, the various techniques developed previously to cope with different environments became integrated into a single system.Footnote 17 Satellite images now cover the entire surface of the globe, be it solid or liquid. In the early modern period, however, the technical disparities between charting large bodies of water and mapping large expanses of land were substantial. The two environments called, as we shall see, for very different methods of data collection and drafting. There is a possibility that in the sixteenth century, the profoundly diverse sets of information thus generated were seen to carry distinct advantages and disadvantages depending on whether they were to be represented on printed or manuscript maps. The makers of maritime charts and terrestrial maps also relied on different sources to finance their enterprises, and often addressed different consumer audiences. Choosing one strategy over the other was a matter of professional survival, and specialization could be the key to success in a swiftly changing political, cultural, and economic environment. Together, political, cultural, social, and commercial factors defined and gave texture to different “modes” of mapmaking.Footnote 18 The querying of such modes in terms of their relationships with specific local traditions, on the one hand, and overarching social and commercial forces, on the other, is one of the main challenges for cartographical historians interested in the early modern period.
Approaching the Caspian from the East: The Goan Moment, ca. 1560
Goa, an important port serving the interior of southern India’s Deccan plateau, fell into Portuguese hands in 1510 and became the political center of the nascent Estado da Índia (the official Portuguese empire east of the Cape of Good Hope) in the early 1530s. By 1560, it was the seat of the Portuguese viceroys or governors overseeing (or attempting to oversee) Crown interests in a vast geographical space stretching from Mozambique to Japan, and from the Persian Gulf to the Moluccas. It was also an episcopal seat, a spiritual and organizational center for a range of religious orders, a major marketplace for intra-Asian, Asian-African, and Asian-European trade, and a center of “knowledge making” and “intercultural exchange.”Footnote 19 It was there that one of the first books to be printed in Asia with movable type, Garcia de Orta’s Colóquios dos simples e drogas da Índia (1563)—a conversation about medical knowledge from Latinate, Muslim, and Hindu traditions—was produced.Footnote 20 Less is known about Goa as a center of mapmaking, but the surviving materials suggest that in the 1560s it may have come close to rivaling Lisbon and Seville.Footnote 21
The present study was prompted, in fact, by a map drawn in Goa in 1563 (plate 3), closely related, in its depiction of the Caspian Sea, to the one produced in Goa in 1560 (plate 1).Footnote 22 On folio 6v of a book of charts authored by Lázaro Luís, two bodies of water can be seen surrounded with a series of place-names and a central caption stating: “in this plain are two lakes.” The map has long been held to represent a pair of lakes to the south of modern Tehran.Footnote 23 In reality, the two bodies of water are easily identified as the Caspian Sea and Lake Van. The scale of latitudes given in the center of the sheet, extending from 33 to 43 degrees North, indicates that this is not a large-scale local area map, but rather a mid-scale regional one.Footnote 24 Place-names such as “Sidade De Gillaom” (Gilan), “Sidade De Masendaraom” (Masandaran), and “Sidade De Estarabat” (Astarabad, now Gorgan) all point to the Caspian basin, although the orientation is confusing, as the actual western shore with its protrusion at modern Baku appears northwards near the top of the map. On the actual northern shore, which here appears to the right, “Sidade de Barqe” most likely stands for Sarai Berke (also known as New Sarai), a trading emporium near modern Volgograd that had once been the capital of the Golden Horde and was destroyed in 1556.Footnote 25 On the shore of the smaller body of water, the toponym “Sidade De Atomar” stands for the Armenian ecclesiastic center of Akhtamar (or Akdamar). The central caption in fact signifies the existence of two smaller lakes between the Caspian and Lake Van, most likely Lake Urmia and Lake Sevan.Footnote 26
There was considerable confusion among cartographers in Europe, but also in the Islamic world, about the positions of these bodies of water. Only a systematic study of the remarkably vast corpus of medieval and early modern maps showing this region might throw more light on possible connections. For example, the Goan map shows Lake Van at about a third of the size of the Caspian, a proportion also found in the late thirteenth-century Syriac “Map of Bar Hebraeus,” copies of which might have survived into the sixteenth century in Armenia.Footnote 27 One could imagine that such a notion traveled from there to Goa, where it might have been mentioned in a conversation about these matters. But other than this tenuous link, there is no medieval or early modern design comparable to that of the Goan map. In other words, a genuine investment was made in Goa around 1560 to create a new image of the region. This region, where Ottoman and Safavid forces had fought a protracted war between 1532 and 1555, was of some strategic interest to the Portuguese.Footnote 28 The existence of Christians in Armenia and Georgia attracted further attention.Footnote 29 An Armenian source is indeed a distinct possibility: a new bishop known as Mar Joseph arrived in Goa from Armenia to serve India’s Chaldean Christian community precisely in 1557.Footnote 30 A map of the region at that time could therefore certainly have responded to political interests. The fact that a Goan mapmaker was looking to represent features as far inland as Sarai Berk is also remarkable, and could indicate an interest in going “terrestrial,” depicting large swathes of the interior of the continent. However, it is important to remain cautious in this regard. What we are looking at may not be a political map at all: Tabriz, the Safavid political center, is nowhere to be seen. The likelihood that the map, along with two others in the same volume (plate 4), represented an itinerary of sorts, to be followed for example by diplomatic envoys, is equally remote. Such an itinerary, from the Persian Gulf through the Tigris valley to the Armenian heartlands and the Caspian basin, would have traversed politically unstable areas and in fact bears little resemblance to the typical itineraries followed by Portuguese travelers as we know them from written accounts.Footnote 31
A much better explanation emerges if we take a closer look at this sequence of three maps from the 1563 atlas (later broken up when the codex was rebound in the nineteenth century). On the Tigris as shown on folio 8r, the last place-name to appear is “Sidade De Caramid,” a reference to modern Diyarbakir. This town is located, as a modern map would show, only about 200 km west of Lake Van, and less than one degree to the south. In fact, the caption set within the lake on folio 6v (“lake that is closest to the river Tigris”) underlines that the mapmaker wished to establish a link. That link was based, quite simply, on the element binding together all these features: water. Once we read these maps as hydrographical maps, everything falls into place. Virtually all the towns they name are represented adjacent to bodies of water. To be sure, Asterabad, Ardabil, and Damghan, all given on folio 6v as overlooking the Caspian, are not actually ports; Ardabil and Damghan are separated from the sea by mountains. But here they are depicted in proximity to the sea, suggesting that the cartographer believed they were there, or felt he should place them there for some reason—perhaps a sense that they were centers of trade close to the coastline. All the other towns marked on the chart have one thing in common: they are situated—both on the map and in the actual landscape—next to seas, rivers, or lakes. In other words, we are looking at a hydrographic, or hydrographically inspired, chart of a region that we would simply not have expected a Renaissance maritime cartographer to have worked on. But in Goa around 1560, someone felt the moment was right to begin charting those remote waters.
Maritime Charting and the Power of Measured Novelty
The sheer implausibility of such an enterprise—producing a fresh maritime chart of a landlocked sea unreachable to Portuguese navigation—should alert us to the power of the ideas at play. To understand what was at stake, it is worth taking a brief look at how Portuguese charting activities functioned in the open maritime space closest to the area we have observed so far: the Persian Gulf. The southern littoral of the Safavid empire was charted by the Portuguese with some thoroughness during the sixteenth century. A comparative analysis of the charts and the physical geography of the region suggests that relatively detailed observations were made in situ at various moments during the first half of the sixteenth century.Footnote 32 It is of course important not to idealize Portuguese charting as an exact science in the modern sense. Portuguese mapmakers were not exempt from the social and political tensions inherent to Renaissance mapmaking. As Alison Sandman has argued in her work on Spanish cartography, mapmaking was as socially contentious a field as any other human activity.Footnote 33 Felipe Fernández-Armesto has rightly highlighted that the ideal of data-gathering and mapping enterprises built around permanently and systematically updated matrix maps, the padrão in Lisbon and the padrón in Seville, was “sound in theory,” but frequently “chaotic in practice.”Footnote 34 It was often despite the existence of charts that vessels escaped shipwreck, not because of them. It is also important to underline that Portuguese cartographers made abundant use of “local” expertise—oral, embodied, embedded in the quotidian actions of people in Africa and Asia—when making their portolan charts.Footnote 35 We should thus remain critical about the extent to which the Portuguese surveyed Asian waters systematically.
But this does not mean that no measurements were made at all, that reliable charts were not appreciated on ships, or that the visual apparatus signaling such observations was meaningless. Beyond the drafting of preliminary sketches, the maritime charting techniques used at the time combined two main components in a series of steps that were taken very seriously. Firstly and most pervasively, the Portuguese collected navigational data based on compass directions and calculations of distances traveled by ships on the sea. Such relational data had been the bedrock of portolan charts since the thirteenth century, especially in smaller seas like the Mediterranean where magnetic variation was not an issue.Footnote 36 Secondly, the Portuguese took to measuring latitude and establishing approximate longitude for key locations—a practice less prevalent in the Indian Ocean than in the Atlantic, where magnetic variation made the compass less reliable. This allowed them to generate some (though not many) absolute coordinates, and thus to produce fixed points of reference for their charts. Much technical work went into improving the precision and reliability of such data sets.Footnote 37 The rigorous application of these methods was at the core of the professional ethos of a semi-formalized hierarchy of groups linked to the making and using of charts, from simple mariners through pilots to the mapmakers whose names have survived and, at the top, in a position sanctioned by exacting examinations, the royal cosmographers.Footnote 38 It has recently been argued that, thanks to this configuration, the Iberian world provides “a striking example of a stable and durable institutional basis that allowed—or at least facilitated—the bridging of the social distance between artisans and scholars.”Footnote 39 To be part of this structure was a matter of respectability and—for the middle and upper strata at least—prosperity.Footnote 40 The best way to signal such a status when making maps was to adopt the visual and technical conventions of mapmaking as it was practiced in the highest places, in celebrated institutional workshops such as those of the Casa da Índia e da Guiné in Lisbon and the Casa de la Contratación de las Indias in Seville.
While we do see different solutions emerge for the Persian Gulf (as for many other areas of the globe), especially between 1500 and 1550, virtually all the charts that have survived spoke a single visual language, signaling similar methods, rules, and ambitions. They follow the same basic visual idiom, anchored, albeit with substantial stylistic variations, in the portolan charting tradition, following techniques originally created in the Mediterranean during the medieval period and developed by Portuguese, Castilian, and other cartographers as European navigation expanded through the Atlantic, the Indian Ocean, and the Pacific.Footnote 41 A new chart of Asian waters based on information freshly collected by Portuguese navigators would, in the 1500s, always be a chart that applied to those littorals the cartographical language of the portolan chart. The trademark characteristics of this idiom are apparent in almost any maritime chart produced by Iberian cartographers from the fifteenth through the seventeenth centuries. The underlying structure consists not of a grid of latitudes and longitudes, but rather a set of rhumblines crossing each other in focal points that together form one or two full circles. These lines signal, in and of themselves, the notion of exact measurements taken with the help of a compass. It was to this base structure that, following novel techniques developed in the Atlantic, Portuguese cartographers began adding occasional data on latitude and longitude. The coastlines were generally drawn in a distinct pictorial style characteristic of the portolan tradition, consisting of clear lines traced confidently in dark ink, interrupted in a characteristically angular manner to signal river mouths, and inflected with geometrical rigor to mark protrusions (capes) and indentations (bays). The names of ports were traditionally written perpendicular to the coastline in black and red ink, generating a visual form resembling a list. Occasionally—as in two of the 1563 maps (plate 4), towns might be marked by elaborate icons, indicating a particular kind of elite patronage and a potentially palatial use of an elaborately decorated cartographical artifact as opposed to the simpler charts used in navigation.Footnote 42
While there can be no doubt that Portuguese mapmakers in Asia made use of what we tend to call “local knowledge,” it is equally clear that they subsequently reworked the pictorial results of such dialogues, added fresh measurements wherever possible, and thus overwrote any preexisting images by applying a cartographical idiom signaling novelty and rigor. This is not to say that there were not significant variations—styles or dialects, as it were—to this cartographical language. Even a quick glance suffices to distinguish the style of line drawing in the three charts attributed to Luís, for example. There seem to have been at least two, perhaps three distinct hands at work, and some of the drawing, especially in the map showing just the Persian Gulf and the Tigris valley (folio 8r), may even have gestured towards the abstract geometrical forms prevalent in late medieval Islamic mapping.Footnote 43 The elaborate icons on two of the maps perhaps carried some sort of Goan “flavor,” and are clearly at odds with the sober, list-like presentation of toponyms on other portolan charts. Even Luís’s main map of the Indian Ocean (folio 5v), which keeps closest to the Iberian portolan idiom, diverges slightly from the style of Lisbon workshops. There is, in other words, scope for a critique of the “portolan” category. But the maps that survived were all made by superimposing upon sketches now lost a design suggesting, broadly along the lines of the visual conventions of portolan-style maritime charts, the existence of a formalized approach.
Unfortunately, no original sketches made, for example, in the Persian Gulf, survive. But it is reasonable to assume that, prior to the designs produced in Goa and Lisbon, some simpler, more experimental sketches would have been made in loco. Such “early stage” designs have survived for the island world of southeast Asia in an unfinished chart book known as the Livro de Francisco Rodrigues (ca. 1512–1515).Footnote 44 They show relatively abstract shapes with only a few details, mostly on river mouths, and would later have been reworked to achieve the full level of detail expected from a portolan-style chart.Footnote 45 Crucially, these preliminary sketches by Rodrigues, for example that of the Malay Peninsula on folio 34 (plate 5), bear a resemblance to parts of the drawing of the Caspian on the 1563 map (plate 3). In other words, the design of the Caspian emulates an approach to maritime charting that was only theoretically possible in that region, since there were no Portuguese ships in the Caspian Sea. The source of the information was nevertheless deemed good enough to allow some portolan-style details to be included on the finished charts in a workshop. It is likely that the mapmaker would have first produced a sketch with a general outline of the sea, probably in dialogue with someone—a Portuguese traveler, an Armenian bishop, we simply do not know—who knew the region from direct experience: it could even be that the simpler outline given in the ca. 1560 map cited in my opening paragraph (plate 1) rendered the very first such sketch. He would then have attempted to work towards a more portolan-like level of detail for certain parts of the design, either with the same informant or with someone else. Texts may also have been consulted during the process, but the goal was clearly not to produce a cartographical commentary on some prestigious Classical or medieval source. The makers of these maps aspired to offer new images of the world as they learned more about it.
The notion of “novelty,” of course, poses challenges to historians. But between the extremes on the spectrum of heuristic possibilities—everything was new; nothing was new under the sun—our task is to understand how the new and the old interacted and were seen to interact. Mapmakers in Goa and Lisbon placed much weight on novelty as produced through direct experience and autopsy. The reputations of mapmaker families were built upon the insistent proclamation of the empirical and technically sophisticated character of the knowledge they made visible through charts. “Empirical” here implied that a chart should give a technically accomplished picture of geographical reality based on a maximum of fresh, ideally unmediated, observational data. The anchoring of a map in the visual world of portolan charts signaled precisely that. In Portuguese intellectual and technical circles, the idea that new areas of the globe were being literally “unveiled” (as per the verb descobrir, widely used at the time) was key.Footnote 46 Even for areas that had been described in earlier texts and maps, novelty was being produced through the disciplined, methodical, quantifiable gaze that scrutinized them anew and formalized their shapes through new maps. As the historian of ideas Luís Filipe Barreto has observed, these scholars and craftsmen took a “hyper-mimetic,” radically optimistic approach to the possibility of representing seen and measured reality.Footnote 47 This was the golden age of “experientialism,” a stepping-stone on the way to experimentalism.Footnote 48
While it has become problematic to argue over whether a map is more or less “accurate”—thereby confronting historical materials with an anachronistic, modern, notion of accuracy—it is important not to dismiss the specific ethos that drove the work of maritime chartmakers, often based in port cities, and their self-representation as professionals producing and selling a specific type of novelty closely bound up with the historical ideal of accuracy. In this context, the relative respectability of one image over another was determined to a significant extent by the perceived exactitude of its design. Contrary to what is sometimes argued, charts with designs such as those we have observed—almost certainly not the decorated specimens surviving today, but plain versions discarded once they were of no use—were handled on ships.Footnote 49 Even if they were often misleading and, combined with the incompetence of some pilots and captains, contributed to many a disaster, there was a vivid notion that a reliable chart could help navigation more than an unreliable one. A proper chart was also “falsifiable” in the Popperian sense of the word: nautical charts could and would be confronted with geographical realities, proven wrong, and consequently amended. It was this aspiration that was signaled by the portolan style.
What we are catching a glimpse of in an unexpected place, in the Caspian corner of mid-sixteenth-century Goan charts, is the extension of the experientialist ideal of cartographical accuracy to a sea where Portuguese ships were not present. These charts proclaimed the desirability of subjecting the region to the same practices of observation and representation as other maritime regions and marked the deliberate first step in a process of cartographical “modernization.”Footnote 50 The Caspian on the Goan charts may look somewhat sketchy in comparison to other areas on the same maps, but the region was being set on the path of perceived cartographical progress. This was the affirmation of a project: a project with a tangible political logic, perhaps, given contemporary hopes of gaining Safavid Persia as an ally against the Ottomans; but also one proclaiming autonomous epistemic capabilities as it furthered the precise and “modern” formation of knowledge about an inland sea.
Not All Knowledge Is Born Equal: The Problem of Mapping Land and Sea
If the notion of direct observation from the seas made it possible to construct a new cartographical image of distant coastlines, the reverse was also true. Wherever fresh information enabling a portolan-style charting process was not available, silence was generally considered more appropriate by maritime cartographers than speculation grounded in travelogues or bookish erudition. Though optimistic about the possibilities of maritime cartography, these men were far less sure about extending their work to inland areas distant from large bodies of water. Even when new surveying techniques grounded, theoretically, in Euclidean geometry began to inform European attempts to prospect large inland areas from the 1530s onwards, maritime mapmakers had reasons to consider the accuracy of their own data to be far superior.Footnote 51 In the eyes of Luís and many other Lusophone cartographers, including such towering figures as Francisco Rodrigues, Diogo Ribeiro, Gaspar Viegas, and various members of the internationally active Homem family, a respectable sea chart would not cover anything but the sea—that is, maritime shores—, because this was the only thing that could be charted with any acceptable degree of accuracy. Inland areas were thus left blank because nothing could be known about them in the way that things were known about the seas.Footnote 52 Inland areas were better described in texts, which the Portuguese produced and consumed avidly in their attempt to understand terrestrial space.Footnote 53
This did not necessarily mean that one could not also make maps of a different kind, or simply add—the most frequent practice—signs of bookish erudition. In such moments, usually responding to high-profile commissions, maritime chartmakers might reveal a willingness to depart from their professional orthodoxy. Diogo Homem, for example, included the Caspian in an erudite world map that opened his 1558 chart book known as the Queen Mary Atlas.Footnote 54 Even then, however, Homem did not include that same image in the respective regional map within the same atlas. He was aware that the model he used for the Caspian—based loosely on a late medieval tradition originally from Italy, which maintained some currency in sixteenth-century SpainFootnote 55—was outdated. He was thus willing to include it in a bricolage-type map covering the world as a whole and filled with Classical toponyms, but not in a medium-scale, regional chart more closely associated in the habitus of Portuguese mapmakers with the world of nautical inquiry. Such was the power of professional conventions in the workshops producing cartographical novelty.
Mapping the Continents in Venice: Giacomo Gastaldi’s Ptolemaic Approach
Although situated some 3,500 km from the Caspian Sea, Venice was not, in fact, more distant from it than Goa, and the Venetian ships navigating the eastern Mediterranean were no farther from its shores than Portuguese ships active in the Persian Gulf. Nicosia, the Venetian base on Cyprus, was actually closer to Armenia than Hormuz, the Portuguese base in the Gulf. Both mapmaking centers received information from this region mainly through individuals traveling alone or in small groups, often diplomats, traders, and spies, who traversed those lands at the mercy of the Ottomans and the Safavids.Footnote 56 But Venice, with its extended commercial and diplomatic networks, quite possibly received more Ottoman and Safavid visitors than any Portuguese city. And while Goa and Lisbon were major hubs for the transmission of geographical knowledge, by the mid-sixteenth century the Serenissima was arguably the most formidable marketplace in Europe for printed maps and travel books describing the latest explorations.Footnote 57 Venetian geographers and mapmakers also compiled vast amounts of information that reached them through Iberian networks.Footnote 58 Despite all this, Gastaldi, the most successful Venetian maker of printed maps, never produced a chart of the Caspian aspiring to the same kind of novelty held in esteem by the maritime cartographers we have observed in Goa.
In 1548, Gastaldi produced his first map specifically showing the region surrounding the Caspian. The Persia Nova Tabula (plate 6) was a relatively small, octavo-format print. Despite its title, it relied largely on Ptolemy’s Geographia, whose first vernacular translation it accompanied. It was simply “enriched,” in the words of historian of science Sonja Brentjes, with “a few names taken from letters or reports of Venetian travelers and envoys.”Footnote 59 But this small map became the first step in a much more ambitious philological and cartographical project. In 1549, the Council of Ten commissioned Gastaldi to draw a large map for a room now known as the Sala dello Scudo in the Doge’s Palace. The council was looking to obtain an image reflecting the most recent developments in Iberian exploration in the Atlantic, and the contract stated explicitly that “a book of Portuguese portolan charts” should be used as a model. At the same time, it made it clear that inland towns and routes should be included to offer a synthesis of maritime and terrestrial realities.Footnote 60 Alas, the map commissioned in 1549 has not survived, so we cannot know with certainty how it looked, nor even whether it included the Caspian.Footnote 61 What is almost certain, though, is that this commission, together with a second in 1553 for a map including East Asia with reference to Marco Polo and other, more recent texts, ended up drawing Gastaldi’s attention back to the Caspian region, and encouraged him to work on it again. The payments received for producing the palace maps would also have supported his subsequent endeavors as a printer. In 1559, he obtained a license to publish an entirely new, much enlarged and enriched map of the region titled La descrttione della prima parte dell’Asia (plate 2). The earliest surviving copies came off the press in 1561.
For this new map, Gastaldi put an enormous amount of work into identifying and positioning hundreds of inland towns. Before we come to this aspect, however, we need to ask how the mapmaker established the general outlines of the continents he would later “fill in.”Footnote 62 As David Woodward put it in his discussion of another Gastaldi project, a map of Italy, he would have aspired to a “judicious merging of information from portolan charts with [other] regional maps”Footnote 63—but what portolans, and how did he use them? In reality, Gastaldi made a series of strikingly eclectic choices regarding the shorelines that were to serve as the exoskeleton of his Asian continent. For the overall shape of the 1548 Caspian (plate 6), he followed a classical, oval model, derived from Ptolemy (the so-called “A” lineage).Footnote 64 This he enriched with a somewhat more sinuous coastline than earlier versions. For the Persian Gulf, Gastaldi dropped the old Ptolemaic tradition, which had been challenged by the Portuguese from the moment they reached those waters in 1507, and instead took inspiration from one or more recent Iberian charts—or, more likely, some copy or copies thereof, since his design does not match any particular Portuguese model. The “double-horned” shape of the northern tip of the Gulf rather points to the universe of Castilian adaptations of Portuguese maps, made in Spain in the 1520s–1530s by such authors as Nuño García Toreno, Giovanni Vespucci, and Diogo Ribeiro.Footnote 65 In particular, Gastaldi could have accessed this tradition based on a derivative design produced in Venice in the early 1540s by Battista Agnese.Footnote 66
In the 1559–1561 map of Persia (plate 2), substantially larger and more detailed than that of 1548, Gastaldi took things several steps further. While the Caspian is still oval overall, the details of the coastline have been dramatically altered to include a myriad capes, bays, and islands. These islands in particular are a sign of how far this map departs from physical reality: there are in fact hardly any in the Caspian at all, but of course some textual sources mentioned their existence, including Marco Polo’s Milione (which the Council of Ten’s commission of 1549 had insisted should be used as a source, in part for patriotic reasons). The same logic of graphic “enhancement” through added, largely imaginary, details can be seen at work in the Persian Gulf. Though keeping the general outline of 1548 that he had possibly gleaned from Agnese, Gastaldi proceeded to bend the line representing the border between sea and land in an extreme manner. Where earlier maps jotted a roughly continuous, arched line extending from the area of Hormuz to the Gulf’s northern tip with a limited, rather precise number of capes and bays, we are now confronted with a tremendously sinuous, indeed tortuous line suggesting a dense succession of large protrusions and deep indentations.Footnote 67 The only known map of the first half of the sixteenth century to present anything even vaguely comparable for the Persian Gulf is a planisphere attributed to Juan Vespucci, produced in Seville in 1526.Footnote 68 Whether a copy or an image following the same model made it to Venice, perhaps through Florence, is unknown. But this may not be the most relevant question to ask. Taking into consideration the graphic inventiveness shown by Gastaldi in his representation of the Caspian and other parts of the world, the notion that forms somehow “flowed” from one map to the next makes only limited sense. It is more valid to assume that in his work similar forces of invention, or stylistic departure from the portolan models, were at play in both the Persian Gulf (where the overall model in terms of shape was “modern”) and the Caspian (where the model was “ancient”). Gastaldi seems to have taken whatever material he felt was appropriate, and then altered it graphically by increasing the sinuosity of the coastlines as dramatically as he could. He, like the makers of portolan charts in Asian waters, was overwriting the existing graphic record and thus affirming his mastery of the material. He just decided to use a different idiom. The result is a line that could suggest a great amount of detail to the untrained eye, but is based on no fresh empirical evidence at all in the sense proposed by maritime cartographers. In other words, a design suggesting the existence of more information (or a more complicated reality) than the smoother, more abstract lines of the Goan charts carries, in reality, much less concrete, technically reliable information.
Gastaldi’s maps are, regarding the coastlines of almost any region outside the Mediterranean world, grossly wrong—much more so than the vast majority of Portuguese charts. But since Gastaldi’s maps were extremely successful, the question to prioritize may not be whether they would have been a navigational hazard if taken aboard a ship (the answer is clearly yes, they would—and no one would have used them for that purpose). What, then, was Gastaldi’s rationale? Was it something to do with the print medium and its purported inadequacy when it came to rendering the color schemes of portolan charts?Footnote 69 This would make limited sense at more than one level. A map might follow portolan-style outlines without the color, like the later Dutch printed maritime charts known as paskaerten. More strikingly perhaps, such a thesis would be at odds with the fact that Gastaldi first departed from portolan-style coastlines as part of the challenge of drawing on a very large canvas for the Sala dello Scudo commission in the Doge’s Palace in 1549. The challenge here seems to have been both technical and aesthetic. Gastaldi was clearly anxious about the visual impact that this large map was expected to have. As he was finishing his first line drawing on the canvas (which was then painted in by a hired artist), Gastaldi expressed concern to his patrons about the pictorial emptiness of the ocean, apparently musing that the gap (presumably between Africa and South America) could be compressed to improve the visual effect.Footnote 70 It makes sense to conjecture that the same anxiety would have arisen regarding the coastlines themselves. A giant portolan, with its sharp and often discontinuous lines, might have looked quite awkward and inadequate in a setting intended, as per Gastaldi’s contract, to impress visitors. This is not to mention the tight connection between the technicality associated with that style and Iberian expansion, a process in which Venice was only indirectly involved. It might, furthermore, have been difficult and time-consuming to transfer portolan-style details from a sheet of paper or vellum to a much larger surface: imprecisions would be easier to spot than on a longer and more sinuous line, which might thus paradoxically be quicker to draw (and, later, to engrave into a copperplate).Footnote 71 In fact, others had used comparably winding lines on large maps before. In the mappamundi of Fra Mauro, produced in Murano around 1458, the portolan-style coastlines available for the Mediterranean and the Black Sea lost their frugal crispness, gaining some of the drama that found its full expression a century later in Gastaldi’s work. A larger corpus of Italian maps, especially wall maps, seems to have engaged in a similar logic during the sixteenth century.
Was this simply a matter of style in a purely aesthetic sense? We may take the interpretation of such practices one step further. As cartographical historians have rather belatedly learned from art historians, an image will match the reality it purports to represent to the degree of accuracy required by the society or societies that produce and consume it.Footnote 72 What Gastaldi pursued was not a depurated, self-constrained praxis limited to the strictly verifiable features of coastlines that could be surveyed by navigators, but exactly the opposite: a cartography of plenty, and of plentiful exaggeration, where displaying a maximum of features provoked a “dazzling and comprehensive experience” as one contemplated the world on paper.Footnote 73 Accuracy in the sense advocated by the Goan (and Lisbon- and Seville-based) cartographers was not the main concern. It was quantity, per se indicative of a different kind of quality, that served as the guiding principle to Gastaldi. Cartographical historian Tony Campbell’s phrase “creative cartography” comes to mind, though it was coined in a somewhat different context.Footnote 74 While lightly sarcastic, it suggests that there must have been a specific logic to inventing “characterful” outlines with abundant details for coastlines.Footnote 75 This technique may have allowed maps to imply direct observation and “local knowledge,” and thus “more readily pass as genuine” than if a simpler line had been drawn. “Inventions of convenience” could thus become, in Campbell’s words, “fully fledged deceptions.”Footnote 76 But to approach Gastaldi’s design as “deceptive” in this sense may be to miss the point. In the Gastaldi maps, as in the portolan charts, the very existence of a certain kind of line functioned at the level of second-order myth, signifying in and of itself a distinct cartographical ideal of synthesis and accumulation. Gastaldi’s coastlines suggested a black-and-white “clarity” and “linearity” typical of Italian engraved maps at one level, but they also gestured towards the “painterly, recessional, soft-focused, multiple, and open” qualities of the upcoming Baroque visual world.Footnote 77 This combination performed the role of a trademark design. The sheer visual crowding of the interface between land and sea indicated that the Gastaldi maps would offer novelty not by following the strict visual conventions of the portolan tradition, but as part of an entirely different concept. In so doing, this printer was setting the stage for the most important of his own innovations, the systematic, indeed almost obsessive, filling in of the blank spaces left by maritime charts on the land.
Gastaldi was not alone in working towards a synthesis of maritime and terrestrial mapping, so his work did not appear in a vacuum. Agnese, a mapmaker whose early career had focused on the oceans and the production of manuscript charts in a portolan visual style, started to change his approach in the 1540s. From 1545, he began to include in his manuscript chart books what Corradino Astengo has described as “land maps in portolan style.” While these maintain “a characteristic feature of nautical charts: the system of wind lines,” they do not display “a dense series of coastal place-names.”Footnote 78 Instead, Agnese offered increasing amounts of detail for inland areas, coming closer to the then-emerging logic of “land maps pure and simple”—for example, the maps of Piemonte and Liguria that he produced around the same time.Footnote 79 Importantly, however, Agnese’s atlases were drawn by hand, catering to a wealthy audience willing to buy into the developing interface between maritime and terrestrial mapping at a very high cost.Footnote 80
To fill his landmasses with toponyms, Gastaldi clearly worked with an ample corpus of sources, but it has proven difficult to trace exactly where he found particular names. Brentjes has gone to painstaking lengths to establish what sources the mapmaker could or could not have used.Footnote 81 Beyond the obvious texts included in Giovanni Battista Ramusio’s Navigationi e viaggi (a project on which Gastaldi collaborated) and possibly some written accounts never printed, it is highly likely that he obtained “oral information [from] Ottoman and Safavid visitors of Venice.”Footnote 82 This would have included, for the Caspian region, merchants from Gilan.Footnote 83 Gastaldi’s goal was to fill the inland spaces on his maps and simultaneously improve the lists of modern toponyms clarifying the location of towns mentioned by Ptolemy. He seems to have been genuinely keen to learn as much as possible about the terrestrial geography of the Middle East from people who had experienced it first-hand. In this sense, he was doing something not dissimilar to his Goan contemporaries. But he also remained actively attached to the ideal of commenting on Ptolemy’s work and using it as the basis for his representations of the early modern world. To understand what exactly bound Gastaldi and the Goan mapmakers together and what kept them apart, we need to bring a third element into the picture: their respective audiences.
The Importance of Earnest Contracts: Mapmakers and Their Audiences
Luís and Gastaldi were catering to contemporary and, in some ways, comparable publics. It is fair to venture that “cartographic literacy” in Goa, Lisbon, and Venice would have been high, and interest in the ongoing “discoveries” intense. In this sense, a radical questioning of the shared intellectual landscape underlying European efforts at grasping the novelties generated by navigations may be one step too far. But there were nevertheless some important differences. In Goa and Lisbon, the prevalent practice was to reproduce, on maps drawn for wealthy commissioners, the line design of ocean-going navigational charts. At the most basic level, there was no reason to do anything else when the “real,” usable charts were at hand, on paper or vellum of a similar size, in the same workshops. More importantly, though, it seems that the aura of the technical language of portolan charts remained part of the product sold to erudite and wealthy elites, as if to suggest that they, too, partook in the fundamentally maritime endeavors of Iberian science and imperial expansion. Such visual elements signaled a shared technical and scientific culture, a proximity in habitus that seems to have been appreciated by the purchasers of these objects. Unfortunately, we know virtually nothing about who bought maps in Goa and how consumers made use of them. The fact that some were brought back to Europe could suggest that these were high-end “souvenirs,” comparable to certain Nanban screens made for export in seventeenth-century Japan, or Casta paintings from eighteenth-century New Spain: objects that invoked the imperial involvement and connoisseurship of those who possessed them.Footnote 84 In the case of our Goan maps, their style and design remained truthful to the original habitus of maritime charting. Even as Portugal and Goa were going through their own cycle of Classical literary revivalism in the middle third of the sixteenth century, the maritime imaginary kept its luster.Footnote 85 The sense that Portugal’s transcontinental reach was based upon a technical superiority on the seas remained at the core of the empire’s self-understanding, even at the height of the interest in Classical texts.
Gastaldi’s environment was different; or, to be more precise, it evolved in a different direction. Late medieval Venice had, like later Lisbon and Goa, been a place where hydrography and topographical mapping were held in the highest esteem. The city had its own long tradition of maritime charting.Footnote 86 Venice was involved, from the late 1300s, in a process of visual depuration that allowed for the emergence of a sober, fully sea-focused, “Italian style” of portolan chart, departing from the exuberant visual world associated with Majorcan mapmakers, and pointing the way to later Portuguese chartmakers.Footnote 87 In this sense, many Venetian mapmakers built up a habitus perfectly comparable to that of the Portuguese. Moreover, Italian merchant cities in general and Venice in particular enjoyed, as Denis Cosgrove has observed, “a high level of visual literacy as a result of geometrical training in the abacco which involved the recognition of simple spatial and volumetric relations together with mathematical and proportional calculations.”Footnote 88 But, and this is crucial, such literacy became part of another habitus that went beyond the imaginary of navigation. Venice, like Florence, embraced the heritage of Ptolemy very forcefully.Footnote 89 This gesture had much to do with the Serenissima’s understanding of itself as a center of power and learning in a world shaken by the Ottoman conquest of Constantinople. Moreover, as the maps made by Fra Mauro and Jacopo de’ Barbari during the second half of the fifteenth century suggest, some Venetian mapmakers kept close to the ideal of “moralized geographies.”Footnote 90 While they had to be precise and truthful to some extent, maps were also expected to celebrate the harmony of divine creation and the role of Venice at the apex of humanity. One can sense a departure here from mapping idealized as a plainly mimetic “art of describing” towards a stance where maps tell stories: Cosgrove, though he does not make such a connection explicit, has hinted at the common foundations of mapping, Euclidean geometry, and painting in northern Italy.Footnote 91 The cult of Ptolemy was part of this ideal in that it allowed for the measured, quietly intellectual, progressive contemplation of the real shape of the world created by God; not just its outlines but all it encompassed: climates, lands, rivers, mountains, and cities. To read the world, one would read Ptolemy, now updated with all the other sources made available to the people of Venice through their city’s privileged position.Footnote 92
If a Venetian erudite like Gastadi ventured to make new maps of this world, these would not—could not—be limited to the outline of the continents. And if Gastaldi was afraid that his public might point out any flaws on his maps, these would not have to do with this or that island or cape that someone with experience of the sea could unmask as an invention. The more immediate reputational risk came from readers who, confronted with new toponyms in the travel accounts, letters, and narratives of ongoing wars that were reaching Venice in impressive numbers, might find that they were missing from the map. Having promised comprehensiveness, he was likely to be held liable precisely on this point: the need to “have” every town and mountain of the world. This, more than anything else, is the reason Gastaldi included more than one variant for many place-names, effectively duplicating towns on his maps. It was better to have two items with similar names than to give just one and be accused of having missed the other. And while comprehensiveness could never be fully achieved, it could be suggested rather forcefully through visual plenty. Indeed, it was abundance—in curved lines, in islands, in impossibly large, meandering rivers, in mountain ranges, and above all in town after town spread across the maps and printed again with their possible coordinates in endless lists on separate sheets—that ensured the reader would find visual and intellectual satisfaction in contemplating and “working through” these maps.
It is important to emphasize that the large map of West Asia that came off the press in 1559–1561 was born of a very special interface. As described above, Gastaldi had produced a mostly Ptolemy-based map of the Caspian region, printed in 1548. He then received a commission to go further—not in print, but in drawing and painting on a very large canvas, in 1549. As he completed his first canvas map and began work on a second in 1553, he must have realized that there was a commercial opportunity in all the knowledge he was accumulating, which could be used on printed maps. By 1559, he obtained a license for such a usage. The design produced for canvas proved transferable in practice to the print medium—and viable commercially—because it spoke to a wider set of the Venetian public’s interests, not just the objective of their leaders to impress visitors to the Doge’s Palace. It appealed to those wishing to learn more about geography in general; to those intent on confronting texts, from the campaigns of Alexander to the latest travelogues, with maps; and to those, sitting in their homes, eager to perform voyages of the imagination, flying over or wandering through the countries on the map. Crucially, it also appealed to those who may have had few genuine interests in any of those areas, but nevertheless wished to suggest that they did. As Woodward observes, printed maps that could be hung on walls became popular in noble Venetian households in the second half of the sixteenth century as “a symbolic furnishing accessory projecting the owner’s interest in geography, reflecting his social and scholarly status.”Footnote 93 In accordance with the logics of nascent print capitalism and increasing consumption in other areas of material culture, Gastaldi himself contributed to his audience’s desire for more.Footnote 94 He was working in the right place at the right time, a city with unrivaled printing capabilities and a history of exporting its print productsFootnote 95 at a moment when, despite not having their own ships on distant oceans, Venetians still felt they could maintain their embrace of the world through knowledge. The nascent Venetian printed map trade of the mid-1500s broke loose from noble patronage, entered a close association with the librari or booksellers, and through them started responding to—and further stimulating—wider market forces: Gastaldi products soon made it into middle-class households.Footnote 96 At a time when “readers wanted new maps,” Gastaldi’s prints suggested he was offering precisely that,Footnote 97 but without this “novelty” being bound up too firmly with the more rigid language of nautical reliability. Format-wise, the trend included wall maps, maps in books, and books of maps.Footnote 98
Gastaldi’s marketing strategy relied on a combination of three notions which together acted in harmony with growing consumer demand throughout Europe. Firstly, Gastaldi promised his clients and readers novelty, by describing his products as “the latest,” “modern,” “new,” and “recent” (ultima, moderna, novo, novissima, recens).Footnote 99 As had been the case with maritime charts, this was connected semantically and logically with a second notion: that of truthfulness, expressed in words such as “true” and “exact,” often used in the superlative (vera, verissima, exacta, exactissima). Indeed, in these early days of map printing the aesthetic of copperplate-engraved black and white images was in itself a powerful signifier of novelty and precision. But there was also a third notion, absent from maritime charts, that I would argue was key: this was abundance, as conveyed in the single adjective “copious” (copiosa), and possibly reverberating through the notion of comprehensiveness and all-inclusiveness signaled by the word universalis.Footnote 100 In the nascent field of European map books that paved the way for the invention of the “modern” atlas by Abraham Ortelius in Antwerp in 1570, copiousness was both an ideal and a necessity.Footnote 101 The atlas form emerged against a historical backdrop where maps had been bound together sequentially for decades, either in editions of Ptolemy or in chart books, including those from Iberia. In the atlas developed by Ortelius in Antwerp, however, the idea of sequence was combined with that of a movement from the general to the particular and back again, zooming in and out of the earth’s surface as the book proceeded from one continent to the next. This game with scale (or “grain,” as Matthew Edney suggests we call itFootnote 102) was at the heart of Ortelius’s project, and it made the modern atlas extremely gluttonous in terms of geographical information. To zoom in, the mapmaker needed to mobilize all available resources, from names gleaned in Ptolemy to those taken from the latest travelers’ accounts, from features found in ancient maps to others appearing in copies of the newest ones. Ortelius’s “modern” atlas needed the copiousness afforded by Gastaldi and others for inland areas (plate 7).
It could also, incidentally, stick to the outlines provided by Gastaldi for the continents. In this regard, Ortelius’s audience would have had no more objections than the original Venetian buyers of Gastaldi’s products. Gastaldi himself had prepared the ground for a pan-European desire on the part of urban elites to see the world through cartographies of plenty. It was thus possible for Ortelius to appropriate by copying, rather than by reworking. The process of overwriting earlier achievements did not have to take place at the level of the drawing; it could be made to happen at the level of the packaging (the atlas format) and the use of color (though it is unclear how widespread the hand-coloring of maps was at the time). The information—both pictorial and textual—contained in the 1559–1561 Gastaldi map thus went straight into some of the most influential maps of the Orient ever made: Ortelius’s 1567 map of Asia, the map of Persia included in his 1570 Theatrum Orbis Terrarum (plate 7), and the 1578 map of Asia by Gerard de Jode.Footnote 103 Gastaldi’s maps therefore ended up informing a large part of the Netherlandish map production of the late sixteenth and seventeenth centuries.Footnote 104
The wide diffusion of Gastaldi’s work was partly down to disaster. In 1576, the Serenissima suffered an outbreak of plague, followed by a deep demographic and economic crisis. Countless businesses vanished, and copperplates used for the printing of maps were dispersed—again, not on grounds of some inherent ability to “flow,” but because there was an interest among entrepreneurs in the Low Countries in obtaining them at that precise moment. The inventions of Gastaldi entered the circuits of Flemish and early Dutch print capitalism because they responded to a particular need in a specific context: driven by the Verenigde Oostindische Compagnie (United East India Company), Dutch maritime charting would take off in Asian waters after 1600, thus taking the baton of high-precision, portolan-based mapping from the Portuguese and passing it to their own printing workshops in seventeenth-century Amsterdam. These workshops subsequently developed a flourishing business in both paskaerten (printed navigational charts) and erudite and decorative maps.Footnote 105 Before this, however, Europe was flooded by thousands of printed maps that had been made not in direct dialogue with the most mathematically advanced maritime cartography of the time, but rather based on images deliberately altered by Gastaldi, according to an entirely different logic.
At this point, the argument could easily slip back into a nation-centered register. Italianists may point out that a Venetian did some of the work that then made the fortune of Ortelius. Iberianists will feel an urge to emphasize that the coastlines of Asia, Africa, and much of America in the maps produced and reproduced by printers in northwestern Europe were, essentially, pilfered from Portuguese and Spanish sources, either via Venice (as in the maps of Ortelius and de Jode) or directly in Goa (as in the case of Jan Huyghen van Linschoten). Such reactions can provide an interesting counterpoint to the long-standing and often frustrating resilience of historiographical myths regarding the inability of southern Europe to innovate. Anyone studying Ortelius—or indeed the wider logics of “worldmaking” in the later sixteenth century—needs to consider the Iberian provenance of much of the information that he used. And anyone prone to celebrate the “Protestant” achievements of Dutch cartography should humbly recognize all that was accomplished, often to astonishingly high scientific standards, by Catholics. But it would also be short-sighted to reduce this remarkably complex matter to yet another dispute between national or confession-specific traditions. At stake is not so much the tension between “Portuguese,” “Italian,” and “Netherlandish” cartographical schools (though this may still be relevant to some extent), as the articulation and disarticulation between cartographies involving different intellectual, scientific, representational, and commercial strategies. Such things as “manuscript maritime charting” and “map printing”—two key factors in the story here explored—cut across linguistic or political boundaries. It is perhaps within this wider logic that, as announced at the beginning of this article, certain local specificities become significant again. For example, land mapping and map printing never took off in Lisbon or Goa. Why this was—whether it was due to a lack of interest, capital, technical expertise, or something else—remains to be fully explained.Footnote 106 But it is well known that local craft clusters can, at different times, be either very innovative or very reluctant to change. The cartographical profession in Lisbon and Goa may have been particularly entrenched and unable to shift strategies in the direction taken by Venice and Antwerp precisely because its members perceived themselves as excelling in the production of world-leading, manuscript maritime charts. Why would anyone there do anything else? Local specificity in terms of having an unrivaled pool of skills (or cultivating a reputation thereof) was, after all, at the heart of much artisanal production across the early modern world.
The Problem of (Dis)jointed Histories of Knowledge
Crucially, all this happened in a period of breathtaking connectivity, with countless people, images, texts, and ideas moving around the globe at often remarkable speed. The most striking aspect of the story is perhaps how, despite their enormity, the disjunctions at play have been hiding from us in plain sight. We are, it must be underlined, looking not just at an occasional, random lack of connection. We are staring into an abyss of disjunctions between different modes and different local traditions of mapmaking. A final twist may be allowed as we conclude, to signal how fractures run not only through space but also through time, in places where we may not expect them at all.
For Italians had once navigated the Caspian. Around 1262, the Venetian merchants Nicolò and Matteo Polo reached Bokhara via the Volga and the Caspian basins. Not much later, Genovese merchants began to take their own ships through the Don-Volga portage to the Caspian. The trade connecting the eastern Mediterranean via Tana (Azov), the Caspian, and Astrakhan with Central Asia and China is today rarely mentioned in studies of global history, and almost nothing is known about Venetian and Genovese naval activities in the Caspian itself. But although by the mid-fifteenth century they had ceased entirely, they lasted long enough for the making of surprisingly detailed maritime charts. A possible early reflection of this nascent tradition appears in the “Catalan Atlas” of 1375. A more elaborate design appeared sometime during the fourteenth or early fifteenth century, whose elegantly elongated S shape comes uncannily close to the form of the Caspian as we know it today.Footnote 107 Perhaps the earliest trace of this model is the so-called “Lesina” map, a medieval chart (or copy thereof) inserted into a copy of Ptolemy’s Geographia published in Strasbourg in 1525, found on the island of Hvar—a Venetian possession from 1420 to 1797. The design also appears in the map made by Fra Mauro in Murano during the 1450s. In this same lineage, the British Library holds two accomplished, detailed, and precise late fifteenth- to early sixteenth-century maritime charts specifically focused on the Caspian.Footnote 108 At least one of these, included in the “Cornaro Atlas,” was made in Venice around 1489 (plate 8), based on an earlier model of uncertain provenance, now lost.Footnote 109 A copy of the elongated S-shaped Caspian also appeared in the chart books of Angelo Freducci—one of the last great representatives of the so-called Ancona school of maritime charting—in the middle of the sixteenth century.Footnote 110
Either Gastaldi did not know any of these manuscript maps, or he chose to ignore them. Both hypotheses are significant. A whole cartographical tradition, no doubt a towering achievement of medieval maritime charting, thus fell quite simply into oblivion. It became a cul-de-sac or “cartographic backwater,”Footnote 111 and the knowledge it contained vanished from sight. It is safe to state that the truncated career of these Italian charts rendering the Caspian, which in the 1400s achieved a precision that would not emerge again until the eighteenth century, constitutes one of the most spectacular examples of what Peter Burke has called the “social history of forgetting.”Footnote 112 One could, of course, place the blame for Gastaldi’s act of neglect on a disjunction between manuscript and printing practices. But the elongated S shape of the Italian portolans of the Caspian does appear on an anonymous copperplate-engraved, probably Venetian, world map of around 1485. Few copies of this print survive, and it may have reached a very narrow audience.Footnote 113 Was it too early for a print map such as this to make an impact? Ironically, a decade or two after Gastaldi’s death, when it came to decorating the Stanza della Guardaroba in the Palazzo Vecchio in Florence with exclusive hand-painted maps—a project completed by 1589—, the models chosen were the ones circulating in print form. For a unique room, with a unique series of maps painted by Egnazio Danti onto a set of purpose-made cabinets, the shapes of the continents and the mountains and cities contained therein were drawn together from printed maps.Footnote 114 Around the same time, Philip II is said to have hung seventy sheets of the 1578 edition of Ortelius’s Theatrum in the throne hall at the Escorial palace near Madrid.Footnote 115 Even as the maps in Florence and at the Escorial underwent a re-aristocratization, becoming the most exclusive of artifacts only visible to a select few, the model chosen now came from the most democratic of all cartographical forms available at the time: the printed map.
Without Gastaldi and then Ortelius’s willingness to compromise in a Gargantuan manner, and without a growing audience of consumers prepared to buy into the new range of—technically flawed but otherwise highly desirable—products, Europeans may have continued to rely on textual accounts to fill, in readers’ minds, the blanks left by zealous maritime cartographers. Under such circumstances, the birth of map printing as a dominant cultural form in the early modern world, and along with it the making of the image of that very world, would have been quite a different affair. Ours is not just a garden of forking paths, where humans could take one turning or the other when it came to mapping the Caspian (or any other corner of the planet), allowing some designs to flourish and pushing others into oblivion, regardless of their topographical “accuracy.” It is also a garden where entire paths, in use for centuries, might be simply forgotten; a garden where the history of manipulating, obliterating, and disremembering was profoundly and intricately intertwined with the rise and fall of cities, business models, social habits, technical achievements, and competing modes of mapping the world. It is important that, in our attempts at studying the connections established between distant places during the late medieval and early modern periods, we do not lose sight of the disjunctions at play on each of those fronts.
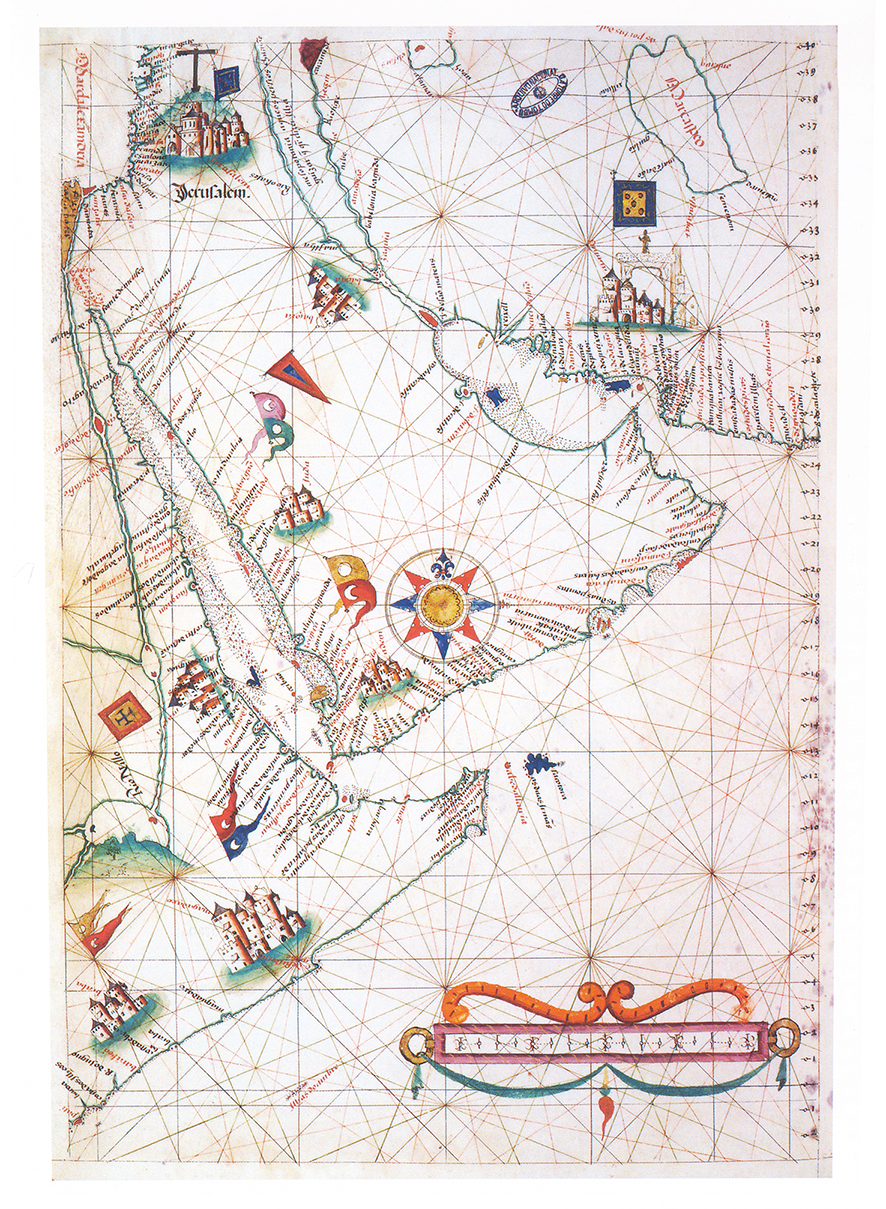
Plate 1. Chart of the northwestern Arabian Sea and adjoining regions

Plate 2. Map of western Asia

Plate 3. Chart of the Caspian and Lake Van
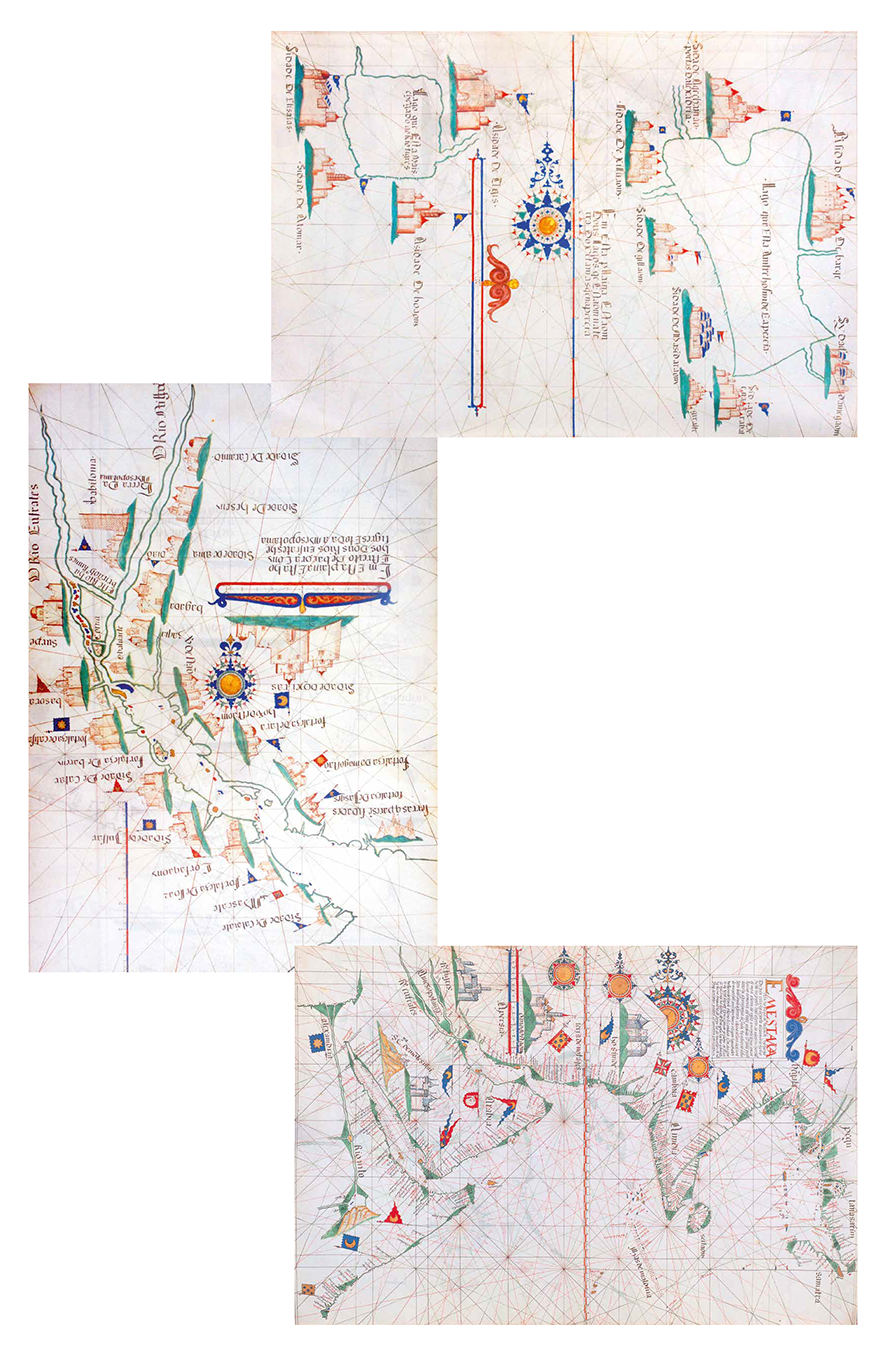
Plate 4. Three charts of the Indian Ocean and adjoining regions

Plate 5. Chart of the Malay Peninsula

Plate 6. A new map of Persia

Plate 7. Map of the Persian Empire

Plate 8. Chart of the Caspian
