Central obesity is associated with insulin resistance and an increased risk of developing type 2 diabetes and CVD( Reference Item and Konrad 1 , Reference O’Neill and O’Driscoll 2 ). In those without diagnosed type 2 diabetes, postprandial glucose excursions are a stronger predictor of HbA1c than fasting glucose and also increase the risk of CVD( Reference Bianchi, Miccoli and Penno 3 – Reference Fava 5 ). Postprandial hyperglycaemia, no matter how brief, drives inflammation, oxidative stress and vascular dysfunction( Reference Bonora and Muggeo 6 – Reference Monnier, Mas and Ginet 9 ). Thus, individuals who are centrally obese and insulin resistant may benefit from strategies that ameliorate postprandial hyperglycaemic excursions( Reference Monnier, Colette and Dunseath 10 ).
Recent non-pharmaceutical interventional studies have sought to reduce postprandial hyperglycaemia through whey protein supplementation (for review Stevenson & Allerton( Reference Stevenson and Allerton 11 )). Whey protein contains an abundant source of amino acids and bioactive peptides that are rapidly digested. These act as potent insulin secretagogues and can reduce gastric emptying, hepatic glucose production and can increase satiety( Reference Madureira, Tavares and Gomes 12 – Reference King, Walker and Campbell 16 ). Despite many trials in normal-weight populations or individuals with type 2 diabetes, few studies have been conducted using centrally obese participants without metabolic disease. This is surprising, given that such individuals are likely to be exposed to elevated postprandial glycaemic excursions( Reference Grundy 17 ) and their associated adverse metabolic effects( Reference Gerich 18 ).
There are practical limitations associated with implementing pre-meal whey protein as a strategy to reduce postprandial hyperglycaemia. First, studies have investigated the glycaemic response to single test meals of primarily high glycaemic index carbohydrate content( Reference Ma, Stevens and Cukier 19 , Reference Wu, Little and Bound 20 ), without investigating if the whey supplementation effects carry forward to subsequent meals. Second, dosages of whey protein administered are generally unrealistically large (45–55 g; approximately 850 kJ)( Reference Ma, Stevens and Cukier 19 , Reference Jakubowicz, Froy and Ahren 21 ). Furthermore, whey protein has shown most benefit when supplemented as a preload around 30 min before the main meal( Reference Ma, Stevens and Cukier 19 , Reference Akhavan, Luhovyy and Brown 22 ), thus restricting its ecological validity when applied in free-living conditions, as this does not reflect conventional eating habits( Reference Popkin and Duffey 23 ). From a clinical viewpoint, it is important to establish whether the beneficial effect of whey supplementation is retained at smaller doses, if the whey bolus is beneficial when consumed alongside or after the meal, and if the therapeutic effects influence glycaemia at subsequent meal times in centrally obese insulin-resistant individuals.
The purpose of this study was to investigate the effect of a realistic whey protein dose on postprandial metabolic and appetite responses in centrally obese insulin-resistant individuals, using timings and test meals that reflect habitual eating behaviours. We hypothesise that whey protein consumption will reduce the postprandial glucose response and positively affect subjective appetite, with more favourable effects resulting from earlier supplementation.
Methods
Participants
Centrally obese male participants, free from metabolic disease, were recruited from the local community. Participants who met the inclusion criteria for gender (male), age (18–55 years), waist circumference (>102 cm) and physical activity level (low) were included in the study (n 13; see Table 1 for participant characteristics). The waist circumference criterion value was based on the WHO threshold associated with the greatest risk of metabolic complications in males( Reference Alberti, Eckel and Grundy 24 ). This was measured at the mid-point between the lower costal border and the illiocristale, according to International Society for the Advancement of Kinanthropometry guidelines( Reference Stewart, Marfell-Jones and Olds 25 ). Physical activity level was assessed using the categorical scoring method following completion of the International Physical Activity Questionnaire( Reference Hagstromer, Oja and Sjostrom 26 ).
Table 1 Participant characteristics (Mean values with their standard errors, n 13)Footnote *
HOMA-IR, homeostasis model assessment for insulin resistance.
* Fasting values are presented as mean of fasting samples for each main trial.
Ethical approval
This study was conducted according to the guidelines laid down in the Declaration of Helsinki and all procedures were approved by the Faculty of Health and Life Sciences Research Ethics Committee (reference: HLSDA020415). All participants provided prior written informed consent. This study was registered at clinicaltrials.gov (NCT02658110).
Study design
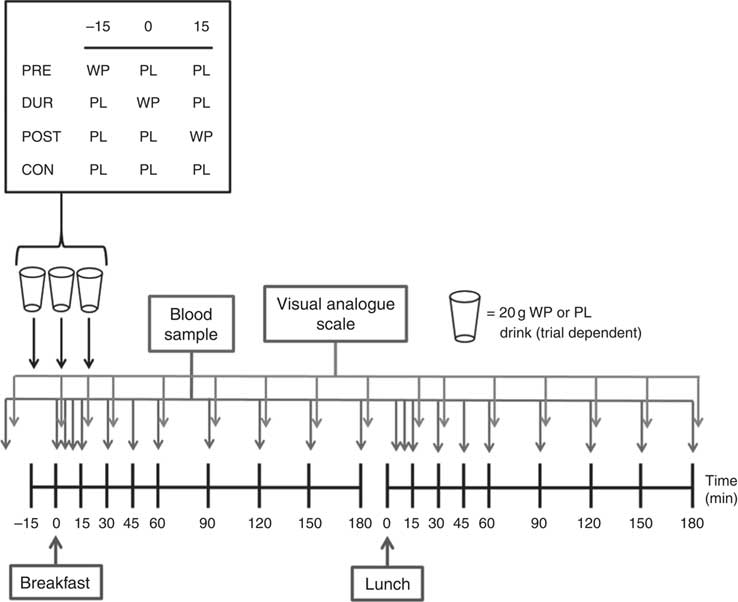
Participants completed four experimental conditions in a randomised order, as part of a single-blind, crossover design. Each condition was separated by at least 3 d. On all visits, participants consumed a standardised mixed-macronutrient breakfast meal, followed 180 min later by consumption of a standard lunch meal. The timing of additional protein supplementation varied by condition, with participants consuming 20 g whey protein as a preload 15 min before breakfast (PRE), during the breakfast meal (DUR) or 15 min post-breakfast consumption (POST). A control condition was also completed without additional protein supplementation (CON).
Pretrial standardisation
Before each experimental visit participants were provided with verbal and written instructions regarding diet and physical activity control measures. For 24 h before arrival, participants were instructed to avoid caffeine and alcohol consumption as well as strenuous physical activity. A mixed-macronutrient meal was provided before each visit (3501 kJ; 37/19/44 % energy from carbohydrate/protein/fat), and participants were instructed to consume this as their evening meal 12 h before their arrival time, to standardise macronutrient and energy intake.
Experimental protocol
The experimental protocol is presented in Fig. 1. Participants arrived at the laboratory at the same time (approximately 08.00 hours) on each occasion following an overnight fast. After insertion of a cannula in an antecubital vein, baseline venous and capillary blood samples were collected and subjective appetite was assessed using visual analogue scales. In the PRE condition, participants consumed a 20 g whey protein beverage, with flavoured water (placebo) provided in all other conditions. After a further 15 min, breakfast was consumed in all conditions, accompanied by either a whey protein (DUR) or placebo test drink (POST and CON). At 15 min post-breakfast consumption, a further test drink was provided, with whey protein administered in the POST condition and flavoured water during all other conditions. The remainder of the protocol was identical under all experimental conditions, with blood samples and appetite ratings collected at regular intervals (Fig. 1). Participants rested in a seated position for 180 min following breakfast consumption, after which a standardised lunch meal was consumed. Following a further period of seated rest (180 min), the cannula was removed and participants were able to leave the laboratory.

Fig. 1 Schematic representation of experimental trials. PRE, pre-breakfast protein condition; WP, whey protein; PL, placebo; DUR, during breakfast protein condition; POST, post-breakfast protein condition; CON, control condition.
Test meals
At each test drink time point (15 min before, during or 15 min after breakfast), either a whey protein or placebo drink was consumed which was condition dependent. The protein drink contained 23 g whey protein isolate powder (Lacprodan SP-9225 Instant; Arla Food Ingredients Group) mixed with 150 ml water and 0·5 ml energy-free strawberry flavouring (FlavDrops, Myprotein), providing 20 g protein (87 % protein content) and 343 kJ (82 kcal) energy. The placebo drink was matched for volume and taste using similarly flavoured water. All drinks were provided in opaque bottles and no reference was made to which condition was being conducted. An additional 200 ml drinking water was administered after each test beverage to eliminate any after taste.
A standardised breakfast of rolled oats (54·0 g) with semi-skimmed milk (260 ml) and honey (42·5 g) was provided under all conditions as a semi-liquid porridge mixture. This provided 1958 kJ (468 kcal) of energy (70 % carbohydrate, 17 % fat, 13 % protein). Participants were encouraged to consume this meal within 10 min. Porridge was selected to represent a habitually consumed breakfast food amongst the UK population( Reference Reeves, Halsey and McMeel 27 ) which provides a mixed macronutrient composition.
A standardised mixed-macronutrient lunch meal was provided in all conditions, as described previously( Reference Allerton, Campbell and Gonzalez 28 ). A 125 g portion of dried fusilli pasta was cooked and combined with 170 g of a tomato-based sauce (Dolmio; Mars), grated cheddar cheese (40 g) and olive oil (15 g). The resulting homogenous meal provided 3448 kJ (824 kcal) of energy (50 % carbohydrate, 36 % fat and 14 % protein). Participants were again instructed to finish the entire meal within 10 min. Water (500 ml) was also served alongside the lunch meal and was withheld in the post-lunch period.
Blood sampling and analysis
On arrival, a cannula (Vasofix 22G; B. Braun Melsungen AG) was inserted into a vein in the antecubital fossa while participants remained in a semi-supine position. At each sample point, 10 ml of whole venous blood was drawn into a syringe and transferred into an EDTA-coated tube (Vacutainer; Becton Dickinson) followed by centrifugation at 1734 g and 4°C for 10 min (Allegra X-22R; Beckman Coulter). Plasma was aliquoted into separate microtubes and stored at –80°C for subsequent analysis. Sterile stylets (22G; B. Braun Melsungen AG) were inserted to keep the cannula patent between blood samples. To control for any postural changes in plasma volume, participants were instructed to remain in a seated position throughout the protocol where possible.
Capillary blood samples (20 µl) were collected immediately following each venous blood draw using the finger-prick technique and processed for glucose (Biosen C_line analyser; EKF Diagnostics). Additional samples were collected at 5 and 10 min post-meal to increase the resolution of the blood glucose curve during the period where rapid changes may occur. Venous samples were processed and analysed for concentrations of plasma insulin, NEFA and TAG. Insulin concentrations were determined using a commercially available ELISA (IBL International), with intra- and inter-assay variation (CV) of 5·9 and 8·9 %, respectively. NEFA and TAG concentrations were determined by enzymatic colorimetric assays using an automated analyser (RX Daytona; Randox Laboratories), according to the manufacturer’s instructions.
Subjective appetite
Subjective ratings of appetite were captured at baseline and at regular intervals throughout (Fig. 1). The reproducibility of within-subject responses and the sensitivity to experimental manipulations for this technique have been established previously( Reference Stubbs, Hughes and Johnstone 29 ). Paper-based 100 mm scales were used to record perceptions of hunger, fullness, satisfaction and prospective food consumption (PFC).
Statistical analysis
A sample size calculation was performed using a reduction in postprandial glycaemia (AUC) as the primary outcome. Based on the observed 16 % reduction in glucose AUC following consumption of whey protein with a mixed-macronutrient breakfast in an overweight/obese population( Reference Pal, Ellis and Ho 30 ), it was calculated that a sample size of 11 would provide statistical power above 80 %, with a two-sided α level of 0·05. To account for a 20 % dropout, a minimum of thirteen participants was targeted.
Serial measures of blood analytes and subjective appetite responses were used to calculate AUC using the trapezoidal method. The resultant total AUC includes all area below the response curve to take account of situations where concentrations fell below baseline( Reference Matthews, Altman and Campbell 31 ). Insulin sensitivity was assessed using the Matsuda insulin sensitivity index (ISI) calculated using fasting and postprandial concentrations of plasma glucose and plasma insulin( Reference Matsuda and DeFronzo 32 ). A combined appetite score, was used to combine the four aspects of subjective appetite assessment, as described previously( Reference Gonzalez and Stevenson 33 ).
Statistical analysis was conducted using SPSS (version 21; IBM). Blood and plasma analyte concentrations and subjective appetite responses were tested for differences between conditions over time using two-way (condition×time) repeated-measures ANOVA. AUC was analysed using one-way ANOVA. Post hoc analysis was performed upon identification of significant main effects and the Bonferroni correction was used to correct the level of α for multiple comparisons. The level of statistical significance was set at P<0·05, and data are presented as mean values with their standard errors.
Results
Post-breakfast responses
Fasting values did not differ between conditions for all physiological and appetite variables assessed (P>0·05). Blood glucose responses displayed a significant condition×time interaction effect (P<0·001) in addition to the main effects of condition (P<0·001) and time (P<0·001). Glucose peaked at 30 min post-breakfast under all conditions (Fig. 2(a)), with the magnitude of the peak significantly reduced when whey protein was consumed as a preload or alongside breakfast compared with whey after the meal or no supplementation (PRE: 7·2 (sem 0·3), DUR: 7·8 (sem 0·3) v. POST: 8·6 (sem 0·3), CON: 8·6 (sem 0·2) mmol/l; all P≤0·046). A tendency for peak glucose to be reduced in PRE compared with DUR was also observed; however, this was not statistically significant (P=0·076). Compared with CON, glucose was lower in PRE at 10–45 min (P≤0·017) and in DUR at 30–60 min post-breakfast (P≤0·041). Concentrations returned to baseline levels under all conditions thereafter (P>0·05). Glycaemia across the post-breakfast period was significantly lower following whey preload compared with POST and CON conditions (AUC: PRE: 982 (sem 30) v. POST: 1031 (sem 36) and CON: 1065 (sem 37) mmol/l×180 min; P≤0·042) but not significantly different from the whey with meal condition (DUR: 1013 (sem 32) mmol/l×180 min; P=0·77; Fig. 2(b)). Glycaemia was not significantly different from CON when whey was supplemented during (P=0·171) or after (P=0·816) the breakfast meal.
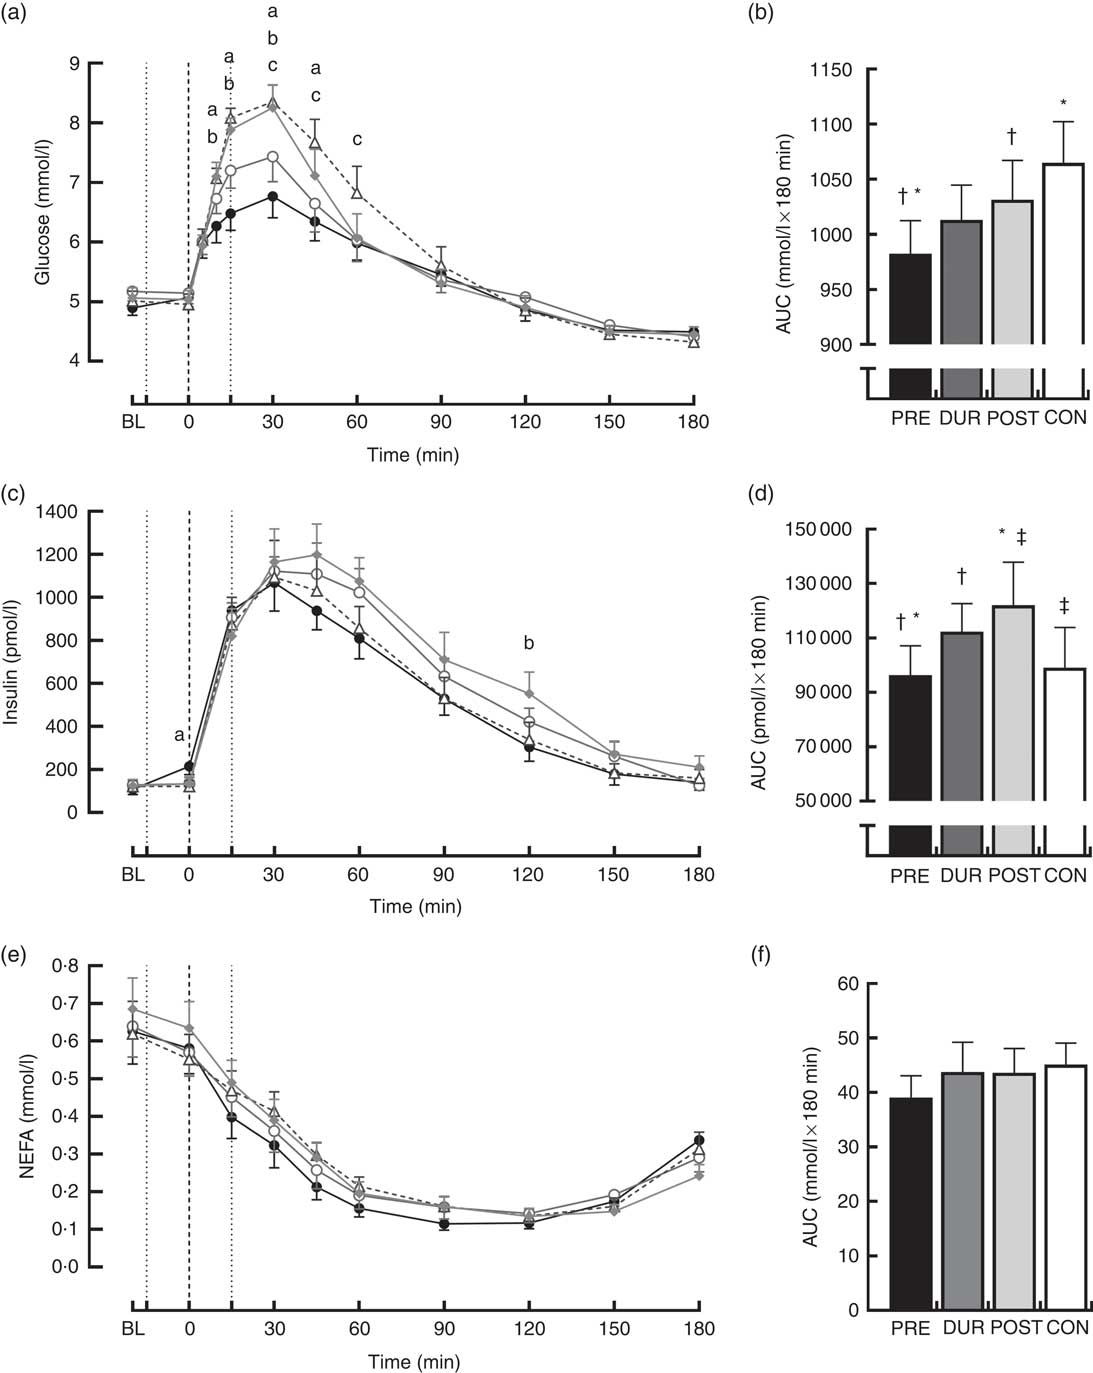
Fig. 2 Time course changes in glucose (a), insulin (c) and NEFA (e) concentrations and AUC for glucose (b), insulin (d) and NEFA (f) during the post-breakfast period (0–180 min). Significant differences (P<0·05) between conditions at individual time points are defined as follows: (a) PRE v. CON; (b) PRE v. POST; (c) DUR v. CON; black dotted line indicates the time of breakfast consumption; grey dotted line indicates time of whey protein consumption during PRE and POST conditions. Bars sharing a common symbol differ significantly from one another (P<0·05). Time course data were analysed using two-way (condition×time) repeated-measures ANOVA. AUC data were analysed using one-way repeated-measures ANOVA. Values are means, with their standard errors represented by vertical bars. BL, baseline. ![]() , PRE;
, PRE; ![]() , DUR;
, DUR; ![]() , POST;
, POST; ![]() , CON. PRE, pre-breakfast protein condition; DUR, during breakfast protein condition; POST, post-breakfast protein condition; CON, control condition.
, CON. PRE, pre-breakfast protein condition; DUR, during breakfast protein condition; POST, post-breakfast protein condition; CON, control condition.
Postprandial plasma insulin concentrations displayed significant effects of time (P<0·001) and significant condition×time interactions (P=0·008; Fig. 2(c)). At the time of breakfast consumption (0 min), insulin was elevated in PRE compared with CON (P=0·04). Concentrations rose following breakfast consumption, remaining significantly elevated above baseline level at all time points between 15 and 120 min post-breakfast (P≤0·007; Fig. 2(c)). Insulin AUC across this period showed a reduced insulin response when whey was supplemented before breakfast compared with other supplementation times (AUC: PRE: 96 340 (sem 10 807) v. DUR: 112 344 (sem 10 310) and POST: 121 997 (sem 15 862) pmol/l×180 min; P≤0·032; Fig. 2(d)), but was similar to the response following breakfast without additional protein (CON: 99 115 (sem 14 656) pmol/l×180 min; P>0·05). When whey was supplemented after the meal, insulinaemia was approximately 23 % greater than CON (P=0·049). Insulin sensitivity did not significantly differ between conditions during the post-breakfast period (Matsuda-ISI; PRE: 3·8 (sem 0·6), DUR: 2·9 (sem 0·5), POST: 2·8 (sem 0·4), CON: 3·3 (sem 0·5) arbitrary units; P=0·161).
Post-breakfast NEFA concentrations were significantly affected by time (P<0·001) such that concentrations were immediately suppressed following breakfast consumption under all conditions and remained significantly below baseline from 15 to 180 min post-breakfast (P≤0·006; Fig. 2(e)). There was no effect of condition (P=0·611), and NEFA AUC was similar between conditions across this period (P=0·517; Fig. 2(f)).
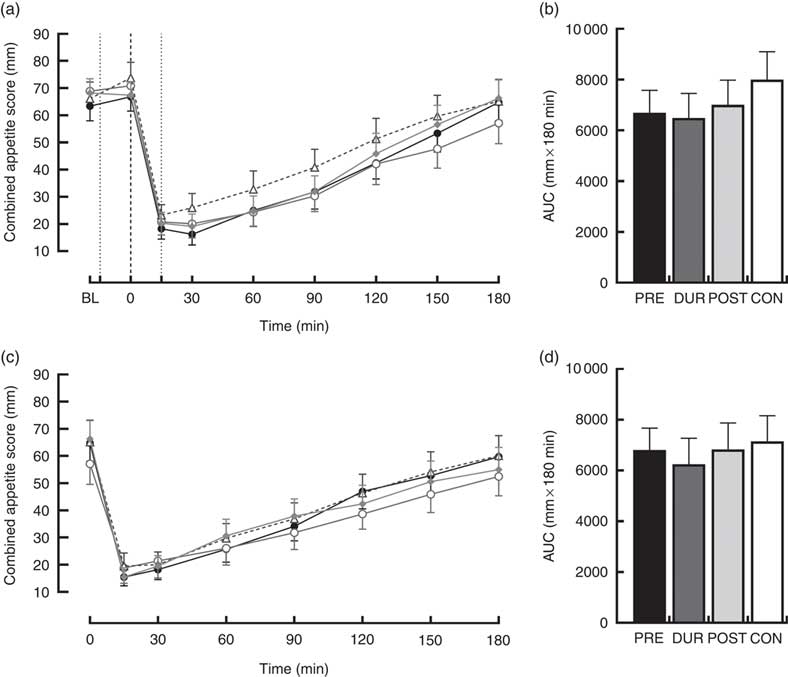
An effect of time (P<0·001), but not condition (P=0·26) or condition×time interaction (P=0·423), was observed on appetite perceptions following breakfast. Combined appetite ratings were similarly suppressed under all conditions following breakfast consumption, reaching their nadir at 15–30 min post-consumption, the magnitude of which was not different between conditions (PRE: 14 (sem 4), DUR: 15 (sem 4), POST: 17 (sem 4), CON: 20 (sem 4) mm; P=0·344; Fig. 3(a)). Appetite subsequently increased gradually, reaching similar levels to baseline at 120–180 min post-breakfast in all conditions (P>0·05). There were no significant differences in AUC between conditions for combined appetite score (Fig. 3(b)) or individual subjective appetite components across this period (P>0·05; Table 2).
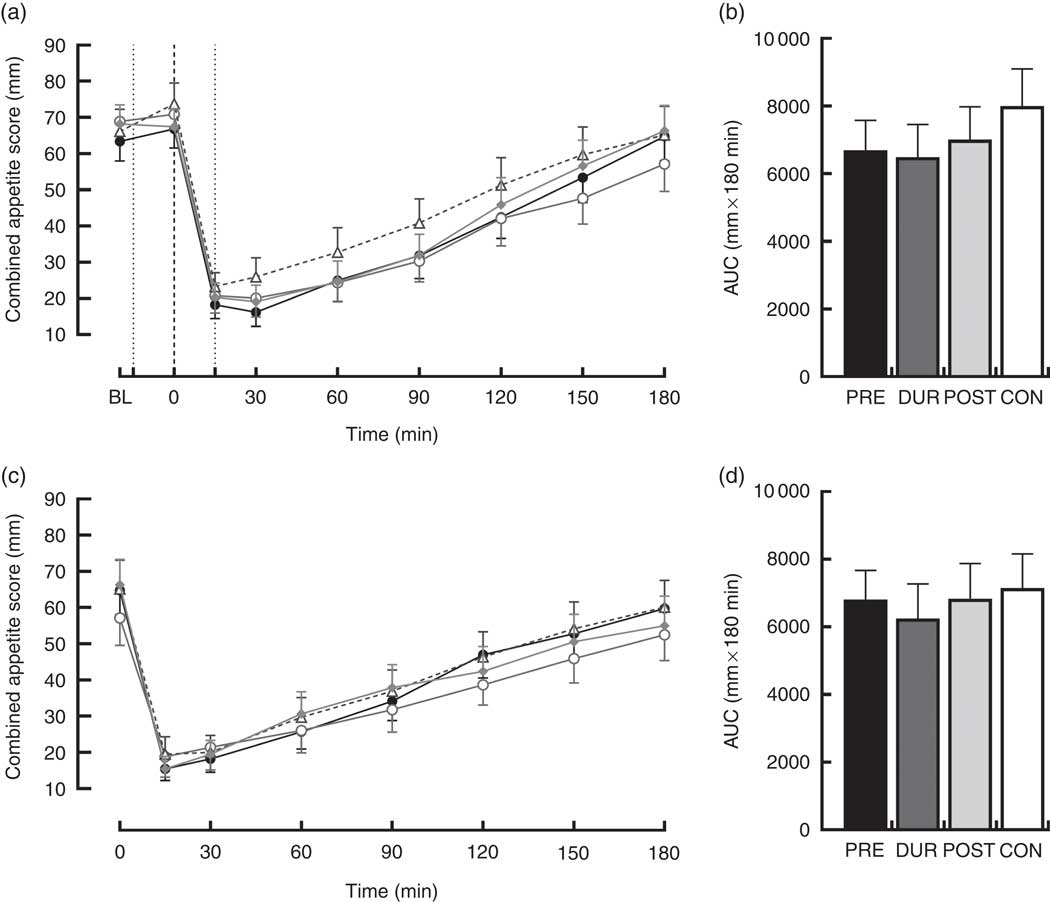
Fig. 3 Time course changes and AUC for combined appetite score during the post-breakfast (a, b) and post-lunch (c, d) postprandial periods. Black dotted line indicates the time of breakfast consumption; grey dotted line indicates the time of whey protein consumption during PRE and POST conditions. Time course data were analysed using two-way (condition×time) repeated-measures ANOVA. AUC data were analysed using one-way repeated-measures ANOVA. Values are means, with their standard errors represented by vertical bars. BL, baseline. ![]() , PRE;
, PRE; ![]() , DUR;
, DUR; ![]() , POST;
, POST; ![]() , CON. PRE, pre-breakfast protein condition; DUR, during breakfast protein condition; POST, post-breakfast protein condition; CON, control condition.
, CON. PRE, pre-breakfast protein condition; DUR, during breakfast protein condition; POST, post-breakfast protein condition; CON, control condition.
Table 2 AUC for components of subjective appetite during post-breakfast (0–180 min) and post-lunch (180–360 min) postprandial periods (Mean values with their standard errors, n 13)Footnote *
PRE, pre-breakfast protein condition; DUR, during breakfast protein condition; POST, post-breakfast protein condition; CON, control condition; PFC, prospective food consumption.
* AUC data were analysed using one-way repeated-measures ANOVA.
Post-lunch responses
Following consumption of a standardised lunch meal, both glucose and insulin concentrations displayed a significant effect of time (P<0·001), with no condition×time interactions observed (P>0·05). Concentrations peaked similarly across all conditions before returning to pre-lunch levels at 60 and 90 min post-lunch for glucose and insulin, respectively (Fig. 4). Post-lunch AUC revealed no differences between conditions in glycaemia (P=0·262) or insulinaemia (P=0·271; Fig. 4).
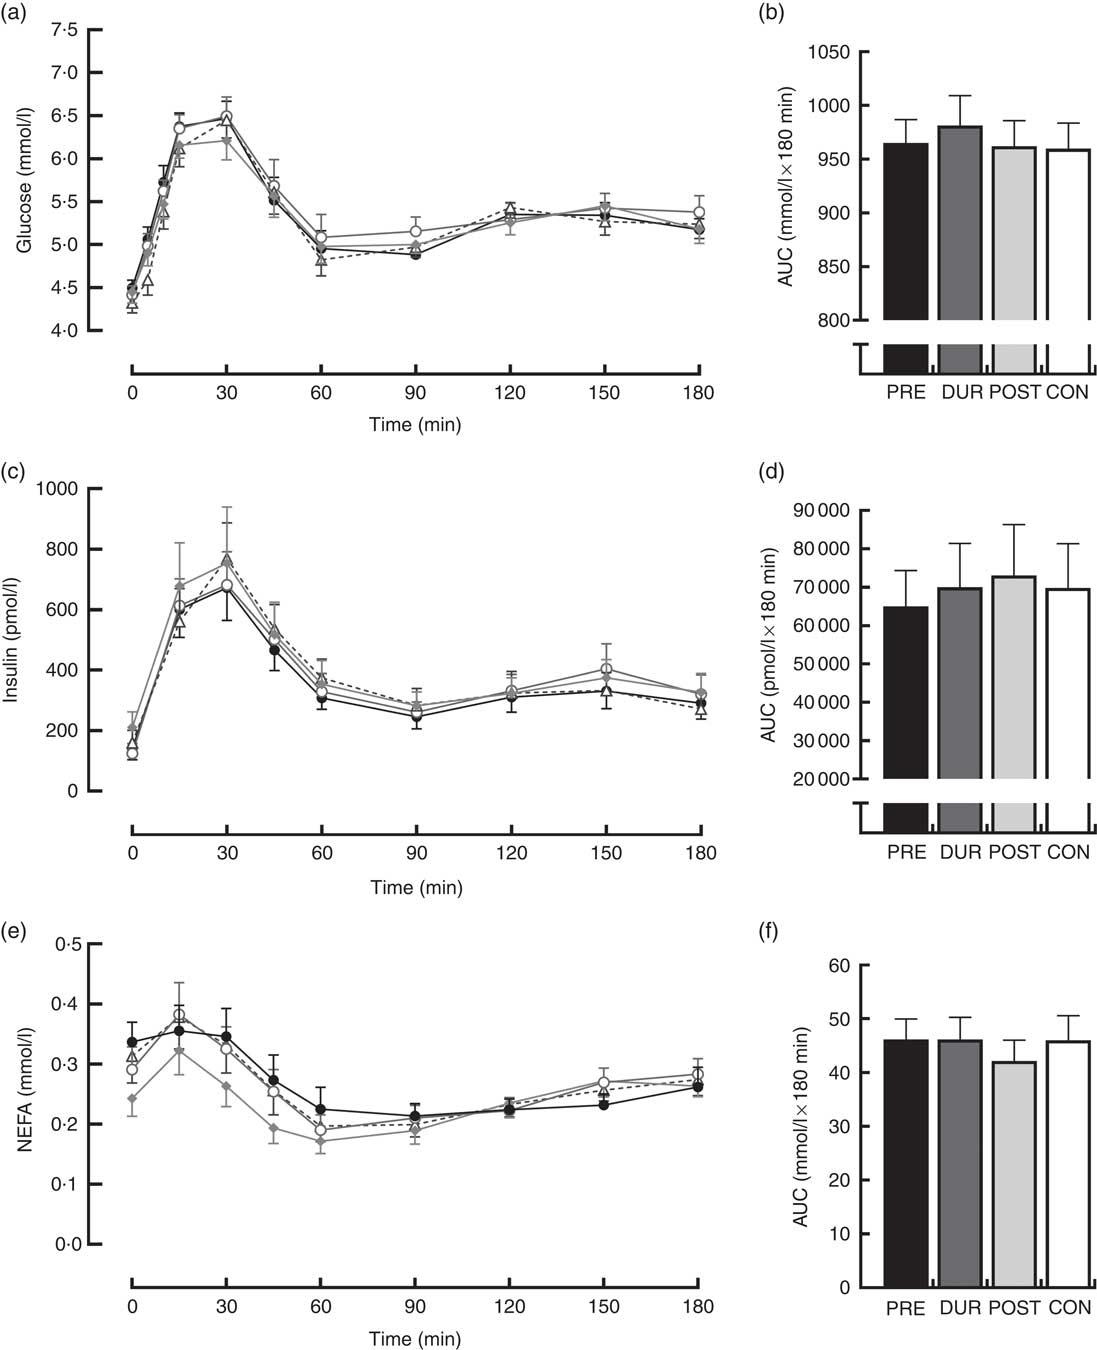
Fig. 4 Time course changes in glucose (a), insulin (c) and NEFA (e) concentrations and AUC for glucose (b), insulin (d) and NEFA (f) during the post-lunch period (180–360 min). Time course data were analysed using two-way (condition×time) repeated-measures ANOVA. AUC data were analysed using one-way repeated-measures ANOVA. Values are means, with their standard errors represented by vertical bars. ![]() , PRE;
, PRE; ![]() , DUR;
, DUR; ![]() , POST;
, POST; ![]() , CON. PRE, pre-breakfast protein condition; DUR, during breakfast protein condition; POST, post-breakfast protein condition; CON, control condition.
, CON. PRE, pre-breakfast protein condition; DUR, during breakfast protein condition; POST, post-breakfast protein condition; CON, control condition.
Post-lunch NEFA concentrations were not influenced by condition (P=0·346), with similar AUC observed between conditions (P=0·587; Fig. 4(f)). Concentrations were moderately suppressed at 45–60 min post-lunch under all conditions, before returning to pre-lunch levels at 90–180 min (Fig. 4(e)). Appetite was similarly affected by consumption of lunch in all conditions (P=0·423). An effect of time was present (P<0·001), such that there was an immediate reduction in combined appetite score following lunch, before gradually returning to pre-lunch levels at 150–180 min post-consumption across all conditions (Fig. 3(c)). There were no significant differences observed in post-lunch AUC for combined appetite score (Fig. 3(d)) or its constituent components of hunger, fullness, PFC and satisfaction between conditions (P>0·05; Table 2).
Plasma TAG
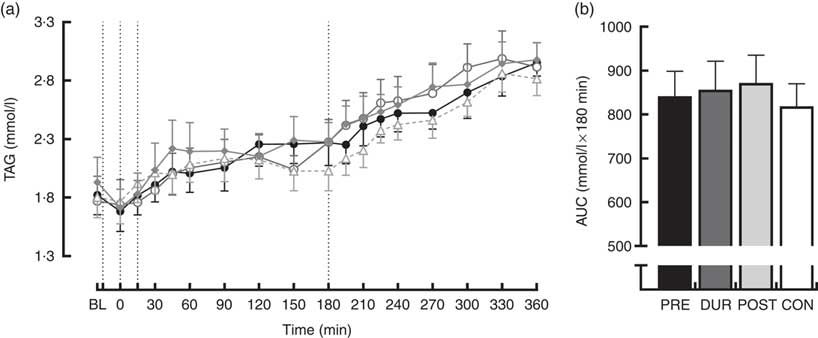
TAG concentrations increased similarly over the course of the experimental protocol in all conditions. Post hoc analysis of the main effect of time (P<0·001) indicated that levels were elevated above baseline concentration from 60 min post-breakfast onwards (P≤0·018) and continued to rise throughout (Fig. 5(a)). There was no effect of condition on TAG concentrations (P=0·653), and AUC was similar between conditions for TAG response across the full postprandial period (P=0·64; Fig. 5(b)).

Fig. 5 Time course changes (a) and AUC (b) for plasma TAG concentrations throughout the full experimental protocol (0–360 min). Black dotted line indicates time of breakfast consumption; grey dotted line indicates the time of whey protein consumption during PRE and POST conditions. Time course data were analysed using two-way (condition×time) repeated-measures ANOVA. AUC data were analysed using one-way repeated-measures ANOVA. Values are means, with their standard errors represented by vertical bars. BL, baseline. ![]() , PRE;
, PRE; ![]() , DUR;
, DUR; ![]() , POST;
, POST; ![]() , CON. PRE, pre-breakfast protein condition; DUR, during breakfast protein condition; POST, post-breakfast protein condition; CON, control condition.
, CON. PRE, pre-breakfast protein condition; DUR, during breakfast protein condition; POST, post-breakfast protein condition; CON, control condition.
Discussion
The findings of the present study demonstrate that consumption of a 20 g whey protein bolus, either before or alongside a mixed-macronutrient breakfast, attenuates peak postprandial glucose excursions in centrally obese, insulin-resistant males. Furthermore, consuming whey as a preload appears to confer the greatest beneficial effect to reducing postprandial hyperglycaemia. Moreover, post-meal whey protein consumption raises insulinaemia but without a concomitant reduction in hyperglycaemia. The beneficial effects of prandial whey protein supplementation are acute and do not carry forward to subsequent meals.
Peak glucose excursions and glucose AUC were reduced when whey was supplemented as a preload or with the meal. Postprandial hyperglycaemia is a greater risk factor for CVD than increased fasting glucose in non-diabetics( Reference Bianchi, Miccoli and Penno 3 , Reference Gerich 4 ), where its contribution to overall glycaemia is particularly marked. Furthermore, postprandial glycaemic excursions have been established as the main causative factor in glycaemic variability in non-insulin-treated individuals with impaired glucose tolerance( Reference Monnier, Colette and Owens 34 ), and such excursions manifest adverse metabolic effects via activation of oxidative stress and endothelial dysfunction( Reference Ceriello, Esposito and Piconi 35 ). Thus, evidence supports recommending reductions in postprandial hyperglycaemia as a relevant clinical goal in delaying or preventing the onset of type 2 diabetes( Reference Monnier and Colette 36 ). Our data show that a moderate 20 g dose of whey protein offers practical utility as a meal-time aid for reducing the hyperglycaemic burden, with a post-breakfast reduction in peak glucose of 17·0 and 9·2 % when whey was consumed before or alongside the meal, respectively. In addition, a 7·3 % decrease in glucose AUC across the postprandial period was observed following the whey preload, devoid of any significant change in insulin AUC. Whilst it is understood that postprandial hyperglycaemia is predictive of various complications and metabolic derangements, as described above, the clinical significance of such a reduction in glucose AUC of the magnitude shown in our study, in terms of translation to a clinical end point, remains unclear.
The mechanisms explaining the reduction in postprandial glycaemia are yet to be fully elucidated. Our data contrast with prior literature( Reference Ma, Stevens and Cukier 19 , Reference Jakubowicz, Froy and Ahren 21 ), in that the insulin concentrations were not elevated during the postprandial period with the preload supplementation strategy. However, at the onset of the breakfast ingestion, we observed raised insulin concentrations under PRE in comparison to CON (Fig. 2). A reduction in the early postprandial insulin response to feeding is a characteristic associated with insulin resistance and type 2 diabetes( Reference Garber 37 ), and thus the raised insulin may have contributed to clearing glucose, suppressing hepatic glucose output and opposing the potential rise in glucagon that can occur with protein feeding. Furthermore, consuming whey as a preload is known to slow gastric emptying( Reference Ma, Stevens and Cukier 19 ). Thus, a combined influence of raised insulin concentrations before meal ingestion and a slower rate of gastric emptying could explain the superior influence of the preload strategy on reducing postprandial glycaemia. This explanation is supported by insulin concentrations that were similar between DUR and CON, yet glycaemia was significantly lower with DUR. Moreover, insulin concentrations were elevated with post-meal supplementation, without any improvement in glycaemia.
The effects of whey protein ingestion, independent of timing of consumption, were limited to glucose and insulin responses in the present study. Postprandial lipaemia was not affected by co-ingestion of whey protein with breakfast, which is in line with previous findings in normal-weight males( Reference Allerton, Campbell and Gonzalez 28 ) and those with and without type 2 diabetes( Reference Bjornshave, Holst and Hermansen 38 ) but differs from the findings of Pal et al. ( Reference Pal, Ellis and Ho 39 ) Pal et al. observed a 21 % reduction in plasma TAG AUC following 45 g whey, compared with the same dose of glucose, when administered alongside a mixed-macronutrient meal in obese females. Such a disparity cannot be attributed to differences in fat content of test meals, as postprandial TAG was unaffected when relatively low-fat (the present study) and high( Reference Bjornshave, Holst and Hermansen 38 )-fat test meals have been supplemented with prior whey protein. The amount of supplemental whey administered by Pal et al., however, was over 2-fold greater than both these studies, which may have influenced the observed TAG-lowering effect.
Subjective appetite appeared to be unaffected by whey protein supplementation, regardless of the condition. Prior research demonstrated an appetite-suppressing effect of whey protein, with wide ranging protocols and participants, for example, in overweight males after a 55 g preload( Reference Bowen, Noakes and Trenerry 40 ) and with a 15 g whey bolus in type 2 diabetes( Reference King, Walker and Campbell 16 ). In the study by King et al. ( Reference Pal, Ellis and Dhaliwal 41 , Reference Flint, Moller and Raben 42 ), pre-meal whey protein resulted in greater post-meal insulin concentrations compared with control, possibly playing a role in appetite suppression. However, in the present study, the elevated pre-meal insulin during PRE, and the greater insulin during POST, did not translate into changes in appetite sensations. A mixed effect of whey on subjective appetite ratings in non-diabetic individuals has been shown previously. Several studies have reported reductions in appetite( Reference Hall, Millward and Long 43 – Reference Zafar, Waslien and AlRaefaei 45 ), though the exact mechanisms remain to be elucidated, while others show no effect on perceptions of appetite with( Reference Bowen, Noakes and Clifton 46 , Reference Astbury, Stevenson and Morris 47 ) or without reductions in energy intake( Reference Bowen, Noakes and Clifton 48 ). Future research should explore appetite sensations and energy intake following both acute and longer-term use of prandial whey protein supplementation.
Whey protein at breakfast did not affect post-lunch responses across all outcomes assessed in the present study. This appears to confirm the previous findings in normal-weight individuals( Reference Allerton, Campbell and Gonzalez 28 ) and suggests that any effects of whey protein on postprandial glycaemia are transient and may provide rationale for researchers to investigate the supplementation of whey protein at multiple sequential meals.
To the authors’ knowledge, this was the first study to assess the effect of timing of whey protein consumption on post-meal glycaemia in a non-diabetic population. The methodology was strengthened by efforts to increase the ecological validity of findings, including administering a dose of protein that could realistically be supplemented alongside a meal, and timings of supplementation that would not inconvenience individuals wishing to carry out this strategy to reduce glycaemic excursions. Care was also taken to use foods that were typical of those consumed at breakfast and lunch meals across the population. Further examination of the findings, and associated mechanisms underpinning them, is however limited. The measurement of circulating concentrations of amino acids and incretin hormones, as well as rates of gastric emptying, may have been beneficial in this regard. Whilst the aim of the present study was to investigate the effect of whey protein supplementation and its timing, irrespective of the mechanisms of action, consideration should be given to incorporating these measures into future work.
In summary, consumption of whey protein alongside a mixed-macronutrient meal attenuated postprandial glucose excursions in centrally obese insulin-resistant males. In addition, as hypothesised, consumption of whey as a preload had a similar effect on peak glucose, also attenuating glycaemia over the subsequent 3 h, with a simultaneously reduced insulin response. Reductions in postprandial glycaemia may be beneficial in preventing or delaying the progression from normal to impaired glucose tolerance or type 2 diabetes. Postprandial lipaemia and subjective appetite, contrary to the original hypothesis, were not affected by the supplementation of 20 g whey protein or its timing of consumption. The benefits of whey supplementation are acute, and future research should explore glycaemic responses and macro- and micronutrient intake following long-term supplementation.
Acknowledgements
The authors would like to thank all volunteers for their participation in the study.
Arla Food Ingredients Group (Viby) kindly provided the whey protein supplement used in this study. Arla Food Ingredients Group had no role in the design, analysis or writing of this article.
D. M. A., P. L. S. R., D. J. W. and E. J. S. designed the research; D. M. A. conducted the research; D. M. A. analysed the data; P. L. S. R., D. J. W. and E. J. S. contributed to writing the paper; D. M. A. wrote the paper. All authors read and approved the final manuscript.
The authors declare that there are no conflicts of interest.