INTRODUCTION
Norovirus is notorious for causing highly explosive epidemics, while also creating significant disease through community endemic transmission. As the most common cause of epidemic gastroenteritis across all age groups [Reference Fankhauser1], noroviruses are responsible for more than 90% of viral gastroenteritis and about 50% of all-cause gastroenteral outbreaks worldwide [Reference Patel2]. In the USA, norovirus infections cause an estimated 71000 hospitalizations annually, costing nearly $500 million per year [Reference Lopman3]. The role of endemic norovirus, while not as well characterized as its role in outbreaks, is major; endemic incidence is estimated at around 5% per year for all ages and 20% per year in children aged <5 years [Reference Lopman4, Reference Tam5].
Norovirus is transmitted through aerosolized vomitus and faecal contamination, either directly from person-to-person or indirectly through the environment. Although there is little data to inform the relative roles of the different transmission pathways, there is evidence to support both symptomatic and asymptomatic transmission [Reference Sukhrie6, Reference Ozawa7]. Symptomatic shedding such as a vomiting event has been shown to be the source of many outbreaks, but it is likely that symptomatic individuals remove themselves from the community, limiting their rate of contact. Asymptomatic individuals, on the other hand, mix readily in the public. Additionally, post-symptomatic shedding has been shown to occur in high concentrations [Reference Atmar8–Reference Aoki10], at levels similar to symptomatic individuals [Reference Aoki10].
While typical norovirus infections are self-limiting, with the shedding period lasting from a few days to a few weeks, many individuals can shed noroviruses long past symptom resolution [Reference Gallimore11–Reference Vanderpas13], and some can shed for months or even years. Infants are often in this long-shedding group; an immature immune system or the presence of maternal antibodies (found in about 75% of infants aged <6 months [Reference Murata14]) can lead to extremely lengthy shedding periods. Similarly, immunocompromised individuals, who are unable to fully clear the infection, may shed norovirus for months or even years [Reference Henke-Gendo15, Reference Furuya16].
Despite these data indicating the presence of long shedders and the resultant heterogeneity in shedding duration, current norovirus transmission models assume short and homogeneously distributed durations of viral shedding. For example, of two recent models of nosocomial norovirus transmission, one assumes an infectious shedding period of <2 days [Reference Vanderpas13] and the other a distribution from 1 to 8 days [Reference Lee17], while a recent household transmission model estimates an average infectious period of 1·17 days [Reference Zelner18]. These short infectiousness periods may be appropriate in understanding transmission in small, enclosed environments such as a house or hospital, where symptomatic individuals shed a high magnitude of virus and quickly exhausts a closely connected and limited population; however, they cannot capture the effects of long shedders in sustaining community transmission.
To better characterize the effect of long-term shedding on norovirus risk, we reviewed the existing literature for empirical data on human norovirus shedding duration. These data are used to estimate distributions of shedding duration that include realistic heterogeneity. This information was then used to inform a norovirus transmission model. Using this model, we demonstrate how the presence of a long-term shedding group affects risk outcomes including the number of infections, duration of transmission, and probability of outbreaks.
METHODS
Literature review search strategy
We reviewed the literature for individual-level human viral shedding duration data through the electronic database Scopus by a key word search using the terms ‘norovirus’ paired with ‘shedding’ and/or ‘excretion’. These articles were supplemented with sources identified from bibliographies of the resultant studies and with unpublished data from known norovirus researchers.
We restricted the results to English-language human studies containing individual-level data that were acquired through the use of polymerase chain reaction (PCR). Studies that compare PCR with earlier techniques (electron microscopy and ELISA) demonstrate substantial improvements in detection capabilities [Reference Atmar8, Reference Amar19], and thus more accurate estimates of viral shedding duration. PCR does not distinguish between viable and non-viable viruses, and because noroviruses are non-culturable, there is no way to determine the infectivity of those detected through this method [Reference Li20]. Even with this constraint, PCR data can be used to estimate the duration of infectiousness. It has been shown that passage through a human host does not diminish infectivity [Reference Teunis21], meaning that shed viruses, although not culturable, remain viable. Second, norovirus has an extremely small minimum infectious dose [Reference Yezli and Otter22] – challenge studies have demonstrated infection with 4·8 RT–PCR units [Reference Atmar8], and the estimated average probability of infection for a single norovirus particle is about 0·5 [Reference Teunis21]. This low infectious dose, along with the high number of particles that are excreted, support the hypothesis that detection indicates a sufficient dose, even if some viral particles have mutated to have non-infectious capsids while remaining sufficiently intact to protect the easily degradable RNA.
Estimating the distribution of shedding durations
In the challenge studies, shedding duration was calculated from the first positive stool sample to the last positive stool sample. For other types of studies (e.g. outbreak investigations), the date of the first positive stool sample was not known, so we assumed that viral shedding starts with the onset of symptoms and continues until the last positive sample. If shedding lengths were reported in days after inoculation [Reference Atmar8], we subtracted the number of days to symptom onset to account for the incubation period, and for consistency among the datasets. Although pre-symptomatic shedding has been reported in <30% of the population [Reference Glass, Parashar and Estes23], it is generally for <1 day [Reference Atmar8, Reference Leon24, Reference Goller25] and there is no indication that it would affect the individual shedding groups differently.
We used two methods to identify the long-shedder population (Table 1). First, we examined the literature to identify individual characteristics potentially related to long-term shedding. If an individual was identified in the original study as having one or more of these characteristics s/he was categorized into the long-shedding group (operational long shedders). Because not all individuals in these categories were long shedders, and because others who do not have these characteristics may shed for long times, we developed a comparative method. With the second definition, long shedders were those whose shedding durations exceeded a set maximum shedding length, regardless of individual characteristics (functional long shedders). We chose the value of 34 days as this cut-off, as it was the maximum duration in controlled experiments using only healthy individuals [C. L. Moe, previously unpublished data (available in the Supplementary material)] [Reference Leon24, Reference Seitz26]. Because of the uncertainty in these estimates, we also performed a sensitivity analysis on this parameter.
Table 1. Criteria used for data stratification

We fitted the data to multiple distributions, and using a likelihood ratio test we found that both the lognormal and gamma distributions fit the data well. We chose gamma distributions based on biological plausibility [Reference Höhne and Schreier27], precedence [Reference Sartwell28], and because this distribution can be included in a deterministic model using multi-compartmental waiting times when the shape parameter is >1 (see [Reference Zelner18] for an explanation). The stratified data were fitted to gamma distributions using the dgamma function in R [29], which estimates parameters using maximum likelihood.
Model design
The data from the review were used to parameterize two modified susceptible (S), exposed (E), infectious (I), recovered (R) transmission models (SEIR models) based on the schematic in Figure 1 and the equations below.
 $${\displaystyle{{{\rm dS}_{\rm R}} \over {{\rm d}t}} = - \beta {\rm S}_{\rm R} ({\rm I}_{\rm L} + {\rm I}_{\rm R} )},$$
 $${\displaystyle{{{\rm dS}_{\rm L}} \over {{\rm d}t}} = - \beta {\rm S}_{\rm L} ({\rm I}_{\rm L} + {\rm I}_{\rm R} )},$$
 $${\displaystyle{{{\rm dE}_{\rm R}} \over {{\rm d}t}} = \beta {\rm S}_{\rm R} \left( {{\rm I}_{\rm L} + {\rm I}_{\rm R}} \right) - \varepsilon {\rm E}_{\rm R}}, $$
 $${\displaystyle{{{\rm dE}_{\rm L}} \over {{\rm d}t}} = \beta {\rm S}_{\rm L} \left( {{\rm I}_{\rm L} + {\rm I}_{\rm R}} \right) - \varepsilon {\rm E}_{\rm L}}, $$
 $${\displaystyle{{{\rm dI}_{\rm R}} \over {{\rm d}t}} = \varepsilon {\rm E}_{\rm R} - \gamma _{\rm R} {\rm I}_{\rm R}}, $$
 $${\displaystyle{{{\rm dI}_{\rm L}} \over {{\rm d}t}} = \varepsilon {\rm E}_{\rm L} - \gamma _{\rm L} {\rm I}_{\rm L}}, $$
 $${\displaystyle{{{\rm dR}_{\rm R}} \over {{\rm d}t}} = {\rm I}_{\rm R} \gamma _{\rm R}}, $$
 $${\displaystyle{{{\rm dR}_{\rm L}} \over {{\rm d}t}} = {\rm I}_{\rm L} \gamma _{\rm L}}, $$
We first examined a standard deterministic transmission model that includes both a regular-shedding group (represented by a subscript R) a long-shedding group (represented by a subscript L). Second, we examined a stochastic, discrete-time version of the deterministic model. In both of these models, individuals may be in any of the following states, reflecting the within-host stages of norovirus infection: susceptible (SR or SL), exposed/incubating (ER or EL), infectious/shedding (IR or IL), or recovered (RR or RL).

Fig. 1. Model schematic. S, Susceptible; E, exposed; I, infected; R, recovered; subscript (R), regular shedding; subscript (L), long shedding. Parameters: β, transmission probability; ε, 1/incubation period; γ R, 1/regular-shedder infectious period; γ L, 1/long-shedder infectious period; ρ, fraction that is long-shedding.
For the deterministic model, vital dynamics such as host births and deaths are excluded because of the relatively short time scale of the simulations (2500 days). We also assumed permanent immunity after recovery. We assumed the absence of competing strains and co-infection, and that host mixing between the regular- and long-shedding groups is proportional. Infectious states (IR and IL) are assumed to exert an equal force of infection due to (1) low infectious dose [Reference Teunis21], (2) high levels of asymptomatic excretion [Reference Ozawa7, Reference Marshall30], and (3) lack of correlation between virus titre in the first positive stool with shedding length [Reference Tu9]. We use a singular infectious period that does not account for symptoms. We examined the more complete process that includes symptomatic transmission and found that our conclusions were robust; even when 50% of infections resulted in a 1-day symptomatic period that was 1000 times more contagious, the importance of long shedding remained (see Supplementary material).
The population is split into two groups: a fixed proportion (ρ) is in the long-shedding group, with the remainder (1 – ρ) in the regular-shedding group. When time (t) = 0, an infectious seed of one individual is in the regular exposed state (ER), and the remainder are in the susceptible states (SR, SL). Susceptible individuals become exposed (ER or EL) at an average per-infected rate of β, and transition into the corresponding infectious/shedding state (IR or IL) at an average rate of ε, which is assumed to be the same for both shedding groups. Individuals enter recovered states (RR and RL) at rate γ R for regular shedders, and γ L for long shedders. Estimated parameters used in these simulations are provided in Table 2.
Table 2. Parameter definitions and values used in simulations
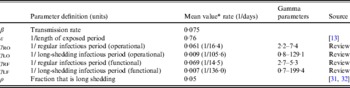
* Value used when parameter was not varied in simulation.
We estimate the percentage of the U.S. population in the operational long-shedding group, ρ (infants and/or immunocompromised), to be about 5%. The number of infants born in the U.S. in 2007 was 4317119 [Reference Hamilton, Martin and Ventura31] in a population of 304059724 [32], about 1·4% of the population. The number of immunocompromised individuals in the USA has been previously estimated to be about 10 million individuals (3·6% of the U.S. population), a number that includes organ transplant recipients, HIV-infected individuals, and cancer patients [Reference Kemper, Davis and Freed33].
We assessed risk in the deterministic model by examining changes in the basic reproduction number (R 0), which is a measure of the potential of a disease to spread in a population. R 0 is typically defined as the expected number of secondary infections produced by a single index case in a completely susceptible population [Reference Anderson and May34]. It can be expressed as the product of the expected duration of the infectious period and the rate at which secondary infections occur; in a standard SEIR model with a mean infectious period of 1/γ and a transmission rate of β, R 0 is given by equation (1).
 $$R_0 = \displaystyle{\beta \over \gamma} .$$
In our model, where multiple infectious phases are possible, R 0 is the sum of the expected number of secondary cases generated by an individual in each state, weighted by the probability that the index case will occupy that state. For the model presented here, R 0 is a product of the transmission probability β and the expected time an individual will spend in each of the infectious states IR and IL (1/γ R and 1/γ L) and the probability ρ of being in the long-shedding group [equation (2)].
 $$R_0 = \beta \left( {\displaystyle{{(1 - \rho )} \over {\gamma _R}} + \displaystyle{\rho \over {\gamma _L}}} \right).$$
We use a discrete-time stochastic model to examine probability, duration, and severity of outbreaks, where individuals can be in the same disease states as presented in the deterministic formulation above (SR, SL, ER, EL, IR, IL, RR, RL; Fig. 1). In this model, we assumed a single population with a frequency-dependent contact rate. The model is initialized with a population of size 10000, with one infected individual at t = 0 and the rest of the population in the susceptible states. The total number of new infections Xt is drawn from a binomial distribution (St, λt), where St is composed of both SR and SL individuals. The exposed period is assumed to follow an exponential distribution with mean duration 1/ε. The regular-shedding and long-shedding infectious periods (1/γ R and 1/γ L) are assumed to follow gamma distributions with parameters obtained by maximum-likelihood estimation using data collected from our literature review (Table 2).
RESULTS
Data extraction
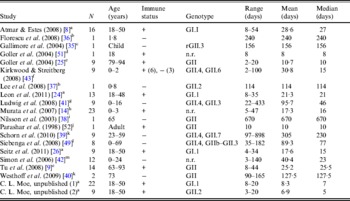
The literature search resulted in a total of 18 English-language studies with individual-level human norovirus molecular-shedding duration data (listed in Table 3), and we received two previously unpublished datasets (for unpublished data see Supplementary material).
Table 3. Description of studies and data used in empirical review

+, Immunocompetent; –, immunocompromised; n.r., not reported; r, recombinant.
a Challenge study. b Case study of infant transplant recipient. c Case study of child with genetic disorder.
d Investigation of healthcare worker. e Outbreak investigation in an elderly care facility. f Prospective hospital study. g Retrospective study of paediatric oncology patients. h Outpatients at a paediatric clinic. i Case study. j Outbreak investigation of food handlers. k Study of transplant recipients. l 2-year hospital survey. m Outbreak investigation in paediatric oncology and haematology unit.
Shedding duration ranged from 2 to 898 days across all studies (N = 168 individuals) with total mean and median values of 49 days and 19 days, respectively. Much of the variability in this dataset is explained by stratification of the population on two individual characteristics: compromised immunity and infancy. Sixty-two of the 168 individuals were labelled as immunocompromised and/or infants, thus considered together as operational long shedders, while the remaining individuals were considered operational regular shedders. Mean shedding lengths between these groups differed by about 90 days (Table 4). The immunocompromised group included a child with a genetic disorder [Reference Gallimore35], transplant recipients [Reference Florescu36–Reference Westhoff40], paediatric oncology patients [Reference Ludwig41, Reference Simon42], and one individual with multiple sustained norovirus infections whose immune status was not evaluated, but was assumed to be immunocompromised [Reference Kirkwood and Streitberg43]. Infants were those individuals whose age was reported as <1 year in the study. It is reasonable to expect differences in shedding length to vary by genotype as well, because of different levels of immune response, but we did not have sufficient data to examine this possibility.
Table 4. Shedding duration summary from empirical review for operational and functional shedding categories
Infants that were immunocompetent shed on average for 22·1 days, 1·3 times longer than those in the regular-shedding group (immunocompetent and >1 year old) who shed for a mean of 16·4 days. Regardless of age, immunocompromised individuals shed on average >6 times longer than regular shedders (139·1 days for >1 year old and 106·6 days for infants). The observed effect of both compromised immunity and infancy (90·2 days) is less than the expected additive joint effect (128·4 days). We tested for additivity using linear regression in R [29]; the P value for this test was <0·01, prompting us to reject the additive effects model. This indicates that either condition can cause long shedding, but both together (being both an infant and immunocompromised) does not result in extremely long-shedding durations beyond the effect of either condition alone.
This operational definition is useful for the a priori identification of high-risk individuals and for understanding the causes underlying long shedding, but was not ideal for our analysis as many cases in our dataset are missing data on age or immune status, and thus cannot be correctly classified using our operational criteria. Further, some individuals who are labelled as immunocompromised, and therefore labelled as long shedders with our operational definition, actually shed for short durations. We therefore, stratified the data based on actual shedding length (functional long shedders shed for >34 days). The mean of the two groups by the functional definition differs by over 120 days (Table 4).
The fitted distribution for the unstratified data is highly variable (Fig. 2). When we stratify the data based on both of our defined shedding groups (functional and operational), much of this variability remains in the long-shedding group (coefficient of variation: 147·1 operational, 121·1 functional), while the regular-shedding groups are more homogenous (coefficient of variation: 71·3 operational, 58·4 functional) (Table 4). Using the law of total variance, the variance of the aggregated populations is 10826·2 for the operational definition and 20989·2 for the functional definition. By dividing the variance of the means by the total variance, we estimated that stratification into long-shedding and regular-shedding groups explains 35% (functional) to 37% (operational) of the total variance.
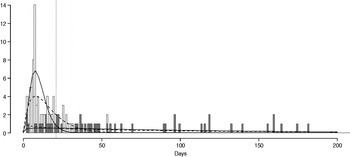
Fig. 2. Shedding lengths and fitted gamma distributions of individual shedding duration data from empirical review. Data are truncated at 200 days; the figure does not include seven individuals who shed for >200 days (up to 898 days). Grey bars indicate operational long shedders (infants and immunocompromised individuals) and white bars indicate operational regular shedders (immunocompetent non-infants). The dotted verticalline at 34 days delineates the cut-off point for the functional definition. Dashed lines represent fitted gamma distributions for the operational definition (regular-shedder parameters = 2·2, 7·4; long-shedder parameters = 0·8, 129·1) and solid lines are gamma distributions fitted to the functionally defined populations, where regular shedders <34 days, long-shedders ⩾34 days (regular-shedder parameters = 2·7, 5·3; long-shedder parameters = 0·7, 199·4).
Deterministic model results
Changes in R 0 determine whether an epidemic will occur as well as the subsequent course of transmission. If R 0 ⩽ 1, transmission will be limited to sporadic secondary infections, and a major outbreak will not occur, whereas if R 0 > 1 an outbreak can result. Based on equations (1) and (2), and assuming ρ = 5%, the inclusion of a long-shedding group [mean = 105·6 days (operational) and 136·3 days (functional)], increases risk by increasing R 0 (1·3-fold increase for the operational definition, 1·5 for functional). Because our value of ρ is estimated, we examined the effect of its increase; if ρ grows to 10% of the population (e.g. increased survival rates for those with compromised systems or an increase in birth rate), the inclusion of the long-shedding group results in a 1·5-fold (operational) or 1·7-fold (functional) increase in R 0 over a population without long shedders. Similarly, a twofold increase in the mean shedding length of the long-shedding group (1/γ L) results in a 1·6-fold (operational) or 1·8-fold (functional) increase in the value of R 0 (Table 5). The effects of changes in these long-shedding related values are independent of the transmission rate, β, meaning that resultant relative increases in R 0 are robust to scenarios of different transmission rates, including environmental or symptomatic transmission.
Table 5. Deterministic model results: estimated fold increase in R0 with addition of long shedders
Stochastic model results
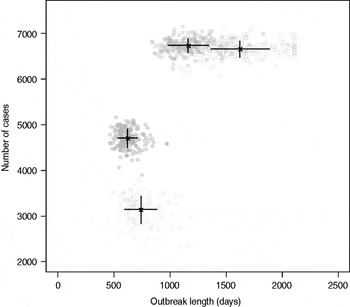
Results from stochastic simulations demonstrate that the presence of long shedders increases the probability that an outbreak will occur while increasing the severity and duration of transmission when disease does not die out. We examined changes in the probability of high transmission events where high transmission was defined as >200 cases. Based on our simulation results, transmission above this level was sustained long term, and below this level would die out. In the absence of long shedders (ρ = 0, i.e. the entire population draws shedding durations from the functional regular-shedding distribution), there is a 23% chance that high transmission will occur in 1000 runs using our estimated parameters (Table 6). If we allow 5% of the population to draw from the functional long-shedding distribution, the probability of high transmission increases to 31%. This effect is less evident using the operational definition, where the probability remains at about 37% (Table 6). As shown in Figure 3, including a long-shedding group by either definition increases both the attack rate, and its duration of sustained transmission. With the addition of long shedders, the mean attack rate increases 145% (operational) to 225% (functional) over a population with only regular shedders (Table 6). The duration of sustained transmission also increases, approximately doubling for both definitions (operational: 633–1199 days; functional: 756–1683days). Figure 3 demonstrates that these outcomes are dependent on our method of stratification. For example, the number of cases in the absence of long shedders is much higher using the operational definition (filled circles) than the functional definition (open circles), due to the wider range and higher mean of this subset.

Fig. 3. Outbreak duration and severity using shedding length parameter values from our empirical review (Table 2). Only model runs resulting in high transmission events (>200 cases) are shown. Runs with both long-shedding and regular-shedding groups are represented by squares, runs with only regular shedders are represented by circles. Filled shapes indicate use of the operational (a priori) definition and open shapes indicate use of the functional definition (>34 days) for long shedders. Black lines show the mean and standard distribution for each scenario.
Table 6. Results of stochastic simulations using parameters from the review
* Set as baseline, column indicates fold increase over this value.
Sensitivity analysis
Our estimates are based on an incomplete dataset of all true shedding times (1/γ L) due to publication bias and the difficulty of obtaining data on asymptomatic community infection. We therefore examined the sensitivity of our outcomes over a wide range of values for this parameter. The probability of high transmission increases by about 10% as the mean long-shedding duration (1/γ L) increases from 20 to 250, levelling off at a maximum probability of 42% for the operational definition and 34% for the functional definition when γ L > 100 days (Fig. 4). The higher probability in the operational definition is again attributed to the wider range and higher mean shedding duration of the regular-shedding group, which contains the bulk (95%) of the population.
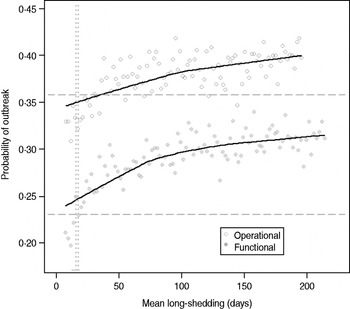
Fig. 4. Sensitivity of outbreak probability to variable long-shedding duration (1/γ L). Outbreaks are defined by having >200 cases. Dashed lines show the probability for each definition in the absence of long shedders, and dotted lines represent the shedding duration of the regular-shedding groups (γ = 16·4 days, γ = 14·5 days). Open circles represent use of the operational definition, and filled grey circles represent use of the functional definition for stratification.
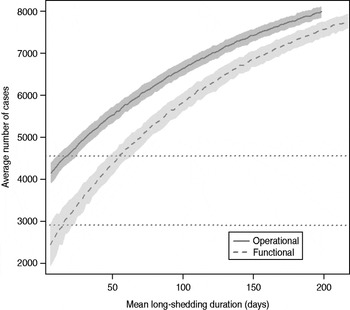
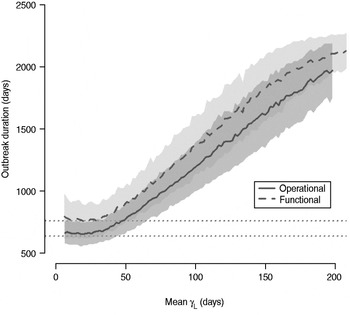
The total number of infected individuals also increases with 1/γ L, as shown in Figure 5. In simulations in a population of 10000 individuals, the maximum number of cases is about 8000 for both definitions (80% of the population), and remains well above the average number of cases in the absence of long shedders (46% operational, 29% functional). Transmission duration, measured as the last time at which there is at least one infected individual in the population, increases as 1/γ L increases (Fig. 6). The maximum expected duration of about 2000 days (about 5·5 years) is reached when 1/γ L = 200 days for both definitions. Again, this is much longer than the average duration in the absences of long shedders (633 days operational, 756 days functional).

Fig. 5. Sensitivity of outbreak severity to variable long-shedding duration (1/γ L). Outbreaks are defined by having >200 cases. Dashed line shows average and standard definition for 1000 runs with the functional definition (solid line) shows average and standard deviation for operational definition. Dotted lines show average number of cases in the absence of long shedders.

Fig. 6. Sensitivity of outbreak duration to variable long-shedding duration (1/γ L). Outbreaks are defined by having >200 cases. End of outbreak occurs when there are no exposed or infected individuals remaining. Dotted lines show average duration for each definition in the absence of long shedders.
DISCUSSION
Heterogeneity in viral shedding duration has clear implications for norovirus transmission dynamics, and should be included when estimating disease risks. In the case of norovirus, estimates of short average shedding duration do not capture the potential effects of long-term shedding individuals in sustaining community transmission. Our empirically derived characterization of norovirus shedding duration allows us to model its impact on population-level norovirus risk. Our analysis indicates that inclusion of long shedders results in a 50–80% increase in the basic reproduction number R 0, about a 20% increase in the number of cases, and about a 100% increase in the duration that transmission is sustained in a population.
The importance of an increase in R 0 depends on its original value, as the number of excess cases that result from an increase in R 0 is highly dependent on the transmission rate, β. For example, if R 0 is already quite high (such as within a home), then an outbreak would already be likely to spread through a population and a twofold increase would not have much effect. If R 0 ⩽ 1 (probably true for community transmission), then this same increase can mean the difference of an outbreak dying out or of it taking off in a population (see [Reference Koopman and Longini44, fig. 1] for further explanation). Long shedders are likely, therefore, to be more important for community transmission where they can potentially impact the probability of outbreak occurrence.
Since long shedders tend to be asymptomatic, estimating the transmission rate due to asymptomatic shedders is important. If asymptomatic individuals do not transmit norovirus then long shedders cannot play a role in norovirus transmission. However, evidence and documentation that asymptomatic individuals can be the index case of outbreaks suggest that asymptomatic transmission does occur and is probably enhanced by long shedders [Reference Sukhrie6, Reference Ozawa7].
Any effect of long shedders would become more profound with the addition of more complicated and realistic structure, including social structure and effect of varied levels of infectiousness. In a structured meta-population comprised of loosely connected groups, a pathogen must persist within its initial group long enough to allow for migration into another one. This type of long-shedder-driven persistence may provide an explanation for the explosive but episodic character of norovirus outbreaks: long shedders may allow the virus to circulate at low levels in the population until it either reaches an individual with a high contact rate (e.g. a food handler or symptomatic individual in a closed scenario), or a pocket of susceptible individuals (e.g. an unexposed school), resulting in a large new outbreak. A socially structured model could also account for other transmission processes, including clustering of long shedders in healthcare facilities and other high-risk zones.
The effect of long shedders may also become more profound if we relax the assumption of homotypic immunity. Immunity has been estimated to last 14 weeks [Reference Matsui and Greenberg45], but this is a highly debated topic [Reference Donaldson46]. When the duration of shedding (1/γ L) is greater than the duration of immunity, the long-shedding group can act as a reservoir, allowing the infection to persist in a population and potentially re-seed periodic epidemics, in a manner similar to herpes viruses and other pathogens with long-term carriage, such as Salmonella typhi.
Because host immune pressure can impact calicivirus RNA evolution [Reference Nilsson38], long shedders may also impact the population ecology of noroviruses [Reference Grenfell47]. Since the amino acids that mutate most frequently are those involved in immune evasion [Reference Lindesmith48, Reference Siebenga49], escape mutants may emerge over the life of a single long-shedding infection. In fact, the number of amino-acid mutations arising over the course of a year within-host is similar to the number distinguishing outbreak variants from each other [Reference Siebenga49]. Consequently, long shedders represent a potential mechanism for introducing novel variants into populations that have achieved herd immunity against the most recent circulating strains.
Our parameter estimates are sensitive to differences in technique and study design across studies (Table 1), including differences in faecal viral concentration, specimen storage, RNA extraction efficiency, presence of faecal reverse transcriptase inhibitors, and primer usage [Reference Patel50]. Many studies terminated sample collection while patients were still shedding [Reference Atmar8, Reference Nilsson38, Reference Goller51], resulting in right-censored data, and systematic underestimates of actual shedding durations. Publication bias exists in the literature, so that published studies may not reflect the true distribution in the population. Future studies, with increasingly sensitive techniques, will provide more accurate estimates of actual post-infection viral shedding duration.
CONCLUSIONS
We have demonstrated the importance of including an empirically validated representation of between-host heterogeneity in norovirus natural history when assessing population-level transmission risks. These results should be incorporated in models that include other potentially important sources of transmission heterogeneity such heterogeneous contact networks, protective immunity, and strain competition. This will facilitate the development of policies and interventions that can target the individuals who are both the most susceptible and the most likely to transmit disease. As we deepen our understanding of the different types, degrees, and interactions of heterogeneity in disease transmission systems, we can make more informed policy decisions and recommendations and more effectively protect human health.
SUPPLEMENTARY MATERIAL
For supplementary material accompanying this paper visit http://dx.doi.org/S0950268813000496.
ACKNOWLEDGEMENTS
This work was funded under the U.S. Environmental Protection Agency Science to Achieve Results (STAR) grant no. RD83172701 and by the U.S. Department of Homeland Security University Programs grant no. R83236201.
DECLARATION OF INTEREST
None.