


Introduction
Dicamba is an ionizable organic acid, and pH affects its behavior. The preponderance of the literature on dicamba and pH effects relates to either degradation using various Fenton reactions (Huston and Pignatello Reference Huston and Pignatello1999) or the pH effect of sorption phenomena onto various solid matrices, such as clays (Carrizosa etal. Reference Carrizosa, Koskinen, Hermosin and Cornejo2001). The reported pKa for dicamba is 1.87 (Shaner Reference Shaner and Shaner2014). The pH of the spray mixture of dicamba has been implicated as an important factor in potential off-target movement, with solutions lower than pH 5.0 being associated with more off-target movement (Hemminghaus etal. Reference Hemminghaus, MacInnes and Zhang2017; MacInnes Reference MacInnes2017). No published literature is available reporting the pH of spray mixtures of recently introduced dicamba formulations and the effect of adding various additives to those dicamba mixtures.
New formulations of dicamba have been registered for use in dicamba-tolerant crops. Monsanto introduced a diglycolamine (DGA) salt of dicamba that includes an acetic acid:acetate pH modifier, referred to in this article as DGA+VG (Hemminghaus etal. Reference Hemminghaus, MacInnes and Zhang2017; MacInnes Reference MacInnes2017; Werle et al Reference Werle, Oliverira, Jhala, Procotor, Rees and Klein2018). BASF introduced the N,N-Bis-(3-aminopropyl) methylamine salt (BAPMA) for use in dicamba-resistant crops. Extensive label restrictions have been placed upon users to attempt to reduce off-target movement of dicamba from either particle or vapor drift (Anonymous 2018a, Anonymous 2018b).
Off-target movement of dicamba to sensitive non-target broadleaf vegetation has been extensively reported in recent years (Bish and Bradley Reference Bish and Bradley2017; Bradley Reference Bradley and Kruger2017; Hager Reference Hager and Kruger2017; Steckel etal. Reference Steckel, Ducar, York, Scott, Barber, Bradley and Kruger2017). The reports have attributed these off-target dicamba injury cases to a number of elements. Some research has suggested that dicamba volatility could be reduced by increasing spray pH, thus favoring the dicamba salt moiety (Hemminghaus etal. Reference Hemminghaus, MacInnes and Zhang2017; MacInnes Reference MacInnes2017).
Dicamba is often applied in combination with several products in tank mixtures to increase efficacy or broaden the weed control spectrum. Glyphosate is often added to dicamba applications to accomplish this goal. Ammonium sulfate (AMS) is commonly used to increase the activity of glyphosate, especially in hard water conditions (Jordan etal. Reference Jordan, York, Griffin, Clay, Vidrine and Reynolds1997). Data have suggested that the observed antagonism of glyphosate may be caused by interaction with cations in the spray mixture and that the addition of AMS can overcome this antagonism––a theory that appears to be chemically based (Thelen etal. Reference Thelen, Jackson and Penner1995). Although we found few refereed publications on spray pH, de Carvalho etal. (Reference de Carvalho, Damin, Dias, Yamasaki and Christoffoleti2009) reported that an increase in glyphosate concentration promoted gradual acidification of the spray solution, which stabilized at a pH of 4.5. AMS caused minor acidification of the herbicide solution. A broad host of adjuvants are available to be added to spray mixtures to improve the performance and convenience of various herbicide applications (McMullan Reference McMullan2000). Water-conditioning agents must be added before the herbicides to prevent herbicide ion interactions. Acidification and buffering agents function in a similar fashion, reducing or increasing spray solution pH.
The manufacturer’s label for DGA+VG states that auxin herbicides such as dicamba have the potential to volatilize in lower pH spray mixtures (Anonymous 2018a). Knowing and adjusting the pH of the spray mixture to avoid low-pH spray mixtures (e.g., pH <5.0) can reduce the potential for volatilization (Anonymous 2018a). These label instructions also specifically caution not to tank-mix with AMS products, as AMS can greatly increase the volatility potential of dicamba. The manufacturer’s label for the BAPMA formulation also warns not to tank-mix products containing AMS (Anonymous 2018b) and to avoid mixing any adjuvants that will further decrease pH or acidify the spray solution. This label also states that spray mixtures with pH levels less than 5.0 can increase the potential for volatility of dicamba, and lists a website where Environmental Protection Agency (EPA)–approved pH modifiers are found to increase spray tank pH.
This article details four experiments to validate label directions referring to pH mitigation of the DGA+VG and BAPMA salt and associated claims (Witten Reference Witten2019). Having a clear and accurate understanding of what is happening to spray mixture pH is foundational to the sustainable and environmentally responsible use of dicamba products, although no direct efficacy or volatility measurements are made in this report.
Materials and Methods
Four experiments were conducted under laboratory conditions in Knoxville, Tennessee. In all experiments, pH measurements were made using an Orion three-star benchtop pH meter with a liquid-based probe (ThermoFisher.com). Before measurement each day, the pH probe and meter were calibrated using multi-point pH buffer standards of 4.0, 7.0, and 10.0 (ThermoFisher.com). These calibration standards included points that were outside of the normal measurements for samples, so all measurements were above the lowest standard and below the highest standard, thus ensuring linearity of response in the equipment. All measurements were made at a lab temperature of 24 C. Experiments were conducted by placing 100 ml of untreated water from the respective sources into 250-ml LDPE plastic bottles and adding the various components to that water. The mixtures were allowed to equilibrate for 60 s, and then the external pH probe was inserted into the water and gently swirled for 15 to 30 s until the pH measurement stabilized on the instrument.
Study 1. Dicamba, Glyphosate, and Carrier Volume Effects
The first study utilized three water sources. All pH values were measured as previously described. The first source was deionized water (DI) produced by filtration and reverse osmosis in the laboratory of the Plant Biotechnology Building at the University of Tennessee, Knoxville, with a pH of 6.2. Previous use of this water source in other research had shown this was a consistent pH for this source. The second source (high pH) was from a well in Union County, TN, and had a pH of 7.7. The third source (low pH at pH 4.7) was collected from a naturally occurring surface water in Fentress County, TN. All water sources were used as collected, and no filtration or other modification was conducted prior to their use. All the water samples were visually inspected and had no detectable particulate matter suspended within them.
Three dicamba formulations were used in the first experiment: the DGA formulation, the BAPMA salt, and the DGA including pH modifier (VaporGrip™), hereafter referred to as DGA+VG. The research used commercial formulations of each product, and their trade names were Clarity, Engenia, and XtendiMax, respectively (Anonymous 2018a, Anonymous 2018b, Anonymous 2018c). The dicamba salt in DGA and DGA+VG was identical (Anonymous 2018a, Anonymous 2018c). Three levels of glyphosate were used: a no-glyphosate addition, the commercial formulation of Roundup PowerMax II (a potassium salt of glyphosate, GLY-K) (Bayer, St Louis, MO), and the commercial formulation of Cornerstone Plus [an isopropyl amine (IPA) salt of glyphosate, GLY-IPA] (Winfield United, Spencer, IA). Each combination of herbicides was examined in three carrier volumes: 94, 140, and 187 L ha–1. A complete factorial arrangement of three dicamba levels, three GLY levels, and three carrier volumes resulted in 27 total treatments. Each experiment had three replications, and the entire experiment was conducted twice. Pooled results are presented in Table 1 and statistical comparisons in Tables 2, 3, and 4.
Table 1. pH of dicamba mixtures as affected by dicamba formulation, glyphosate salt, and carrier volume of three water sources. a – c
a Data represent the mean of six observations (two runs of each study with three replications).
b Mean separation used was Tukey’s Honest Significant Difference (HSD) at 5% probability level.
c Water pH in the absence of additives was not included in the statistical analysis.
d DGA indicates that the diglycolamine salt formulation of dicamba was used.
e DGA+VG denotes the DGA formulation of dicamba with “VaporGrip™” (acetic acid/acetate) included as a pH modifier.
f BAPMA indicates that N,N-Bis-(3-aminopropyl) methylamine salt of dicamba was used.
g IPA denotes that the isopropylamine salt formulation of glyphosate was used.
h K is a potassium salt formulation of glyphosate.
Table 2. Comparisons of mixture pH as affected by addition of DGA, DGA+VG, and BAPMA salts averaged across other factors. a b

a Abbreviations: BAPMA, N,N-Bis-(3-aminopropyl) methylamine salt of dicamba; DGA, diglycolamine salt formulation of dicamba; DGA+VG, the DGA formulation of dicamba with “VaporGrip™” (acetic acid/acetate) added as a pH modifier.
b Data points show the mean of measurements pooled across runs, replications, and factors. Starting pH values for high, low, and DI were 7.7, 4.7, and 6.2, respectively.

a Abbreviations: IPA, isopropylamine salt formulation of glyphosate; K, potassium salt formulation of glyphosate.
b Data points show the mean of measurements pooled across runs, replications, and factors. Starting pH values for high, low, and DI were 7.7, 4.7, and 6.2, respectively.
Table 4. Comparisons of the main effect on pH of carrier volume across dicamba + GLY formulations. a

a Data points show the mean of measurements pooled across runs, replications, and factors. Starting pH values for high, low, and DI were 7.7, 4.7, and 6.2, respectively.
Study 2. Initial Water pH and Drift Retardant
The second experiment examined the effect on solution pH of mixing either BAPMA or DGA+VG dicamba formulations followed by GLY-K followed by a drift retardant with the trade name Intact™ (Precision Laboratories, Waukegan, IL) on 12 water sources (pH values of 4.5 to 8.3) from across Tennessee (Figure 1). Although the collection of the water samples was from a limited geographical range, it would be expected that water from other areas would behave similarly to these. The dosages were 0.56 and 1.2 kg ae ha–1for dicamba and GLY-K, respectively. Intact was added at 0.5% v/v. A separate run was conducted for each water source and dicamba formulation, and triplicate bottles were used for each measurement. Each study was conducted twice, giving a total of 24 runs for each dicamba formulation. The pH measurements for each individual experimental sequence were mathematically transformed in the following procedure:
 $$Original\, pH - pH\, of\, dicamba = pH\, change\, due\, to\, dicamba$$
 $$pH\, of\, dicamba - pH\, of\, dicamba\, plus\, GLY-K = pH\, change\, due\, to\, GLY-K$$
 $$pH\, of\, dicamba\, plus\, GLY-K - pH\, after\, the\, addition\, of\, Intact = final\, pH$$

Figure 1. Locations of water sources used in the various experiments. Numbers represent approximate location of collection point. Sources are color-coded in red for pH < 6.0, blue for pH 6.0 to 7.0, and green for pH > 7.0.
The change in pH due to the dicamba addition was plotted against the original-source water pH, and the relationship was linearly regressed (Figures 2, 3). The pH values of the dicamba-containing solutions and the dicamba plus GLY-K solutions were also plotted for visual presentation and discussion.
Figure 2. Effect of adding dicamba, glyphosate (GLY), and the drift retardant Intact on water pH. (A) Change in pH from adding BAPMA to each water source. The regression line and parameters shown to fit a linear model. (B) Change in pH from adding GLY-K salt to the same mixture that already contained dicamba. (C) Change in pH in the same water source after adding drift retardant. (D) The pH of each mixture after adding BAPMA. (E) The pH of each mixture after adding BAPMA and GLY-K salt.

Figure 3. Effect of adding dicamba, glyphosate (GLY), and the drift retardant Intact on water pH. (A) Change in pH from adding diglycolamine + VaporGrip® (DGA+VG) to each water source. The regression line and parameters shown to fit a linear model. (B) Change in pH from adding GLY-K to the same mixture that already contained dicamba. (C) The change in pH in the same water source after adding drift retardant. (D) The pH of each mixture after adding DGA+VG. (E) The pH after adding DGA+VG and GLY-K salt.
Study 3. AMS Effects
The third experiment examined the effect of adding AMS to dicamba and GLY-K–containing mixtures on the resultant pH. The AMS used, S-Sul, had 21% ammonium nitrogen and 24% sulfur (American Plant Food, Galena Park, TX). A single, naturally occurring water source with a pH of 6.2 was used. A 2 × 2 factorial arrangement of treatments was conducted, with the rate of the two dicamba formulations of BAPMA and DGA+VG of 0.56 kg ae ha–1 and the AMS at a dosage of 10 g L–1. The AMS was examined by either adding first to the spray mixture or in a separate series of treatments as the last component into the spray mixture. The experiment had three replications and was conducted twice.
Study 4. pH Modifiers
The fourth experiment was conducted to examine if three pH modifiers listed on label would raise the pH of the spray solution above 5.0 (Anonymous 2018a, Anonymous 2018b). The three potential pH modifiers Novus K (Innvictis Crop Care, Loveland, CO), SoyScience (AgXplore, Parma, MO), and ChemPro CP-70 (Chemorse, Des Moines, IA) were listed on the Engenia tank mix site (Anonymous 2018b). A single, naturally occurring water source with a pH of 6.2 was used.
A factorial arrangement of treatments included two dicamba formulations (BAPMA and DGA+VG), three potential pH modifiers (Novus K, SoyScience, and ChemPro), and two possible time points of modifier addition. All pH modifiers were added either first or last to the mixture at a rate of 1 L of product per hectare. The pH modifier dosage was arbitrarily selected, as label guidance is ambiguous (Anonymous 2018a, Anonymous 2018b). This 2 × 3 × 2 factorial arrangement resulted in 12 total treatments, and this experiment utilized three replications and was conducted twice.
Statistical Analysis
Data were analyzed using the GLIMMIX procedure of SAS (ver. 9.4; SAS Institute, Cary, NC). Main effects and interactions were tested using the appropriate expected mean square values as recommended by McIntosh (1983). Each run was considered an environment sampled at random from a population of runs as suggested by Carmer etal. (Reference Carmer, Nyquist and Walker1989). Considering runs (environments) a random effect permits inferences about treatments to be made over a range of environments (Carmer etal. Reference Carmer, Nyquist and Walker1989; Blouin etal. Reference Blouin, Webster and Bond2011). With this model construction, all runs of the same experiment were pooled together as suggested by Carmer etal. (Reference Carmer, Nyquist and Walker1989). Environments, replication (nested within environments), and all interactions containing these effects were declared random effects in the model. Herbicide treatments were considered fixed. Type III statistics were used to test the fixed effects, and least square means were separated using Tukey’s Honest Significant Difference (HSD) at α = 0.05. Regression analysis for Study 2 was performed using Sigmaplot version 14.0.
Results and Discussion
Study 1. Dicamba, Glyphosate, and Carrier Volume Effects
Dicamba and GLY formulations affected pH (Table 1). Carrier volume had only a minor effect on final-mixture pH (Table 1). The addition of DGA dicamba raised the pH across the three water sources (Tables 2–4). BAPMA and DGA+VG had mixed pH effects, with some increasing and some decreasing, depending on the initial pH. The addition of GLY to DI water and high-pH water lowered solution pH. When the three dicamba for mulations were mixed with GLY in the high-pH water source, pH was lowered, but the final-mixture pH (5.07 to 5.09) was similar (Tables 2–4). The same comparison using the low-pH and DI water resulted in DGA+VG being the most alkaline followed by the BAPMA and then the DGA salt formulations. It should be noted that though the DGA+VG formulation was the most basic across the low-pH and DI water sources, the final pH values of 4.84 and 4.95 are below the new EPA recommendations of pH 5 on the product label (Anonymous 2018a). When no GLY was added to the three dicamba formulations, the final pH was always above 5.0. When compared across the three dicamba formulations, GLY-IPA had a higher pH than GLY-K regardless of water source (Table 3). Carrier volume pooled across herbicide formulations did not affect mixture pH for the low-pH water source. However, for both the high-pH and DI water sources the 187 L ha–1 treatment showed higher final mixture pH than the 94 L ha–1 treatment (although lower than water-alone pH).
Study 2. Initial Water pH and Drift Retardant
The water sources collected had a wide range of pH values (Figure 1). Many producers may not know the pH of the water they use in their pesticide applications. Although most commercial pesticide formulations are flexible in that pH may have little or no effect, the application of dicamba may encourage pesticide applicators to examine their water sources more carefully. Whereas we measured only pH in this research, previous research showed a range of water hardness in this geographic area (Mueller etal. Reference Mueller, Main, Thompson and Steckel2006). From water samples in the same geographic area, the calcium ion concentration ranged from 3 to 36 ppm, magnesium from 1.2 to 7.3 ppm, and sulfur from 0.3 to 10.2 ppm (Mueller etal. Reference Mueller, Main, Thompson and Steckel2006). Farmers in this previous study were often surprised at the aspects of the water used in their pesticide applications.
Adding the BAPMA dicamba formulation increased the pH in relation to the water source when the water source pH was below 5.75 but lowered the pH under more alkaline water sources (Figure 2A). The addition of the GLY-K to the water source and BAPMA dicamba formulation mixture lowered the mixture pH by 1.5 to 1.9 units (Figure 2B). The addition of the drift reduction agent had no impact on pH (Figure 2C). Across all water sources, with pH range from 4.6 to 8.3, the BAPMA alone always had a pH >6.2 (Figure 2D). When GLY-K was added to BAPMA, most mixture pH values were <5.0 (Figure 2E). Interestingly, a group of water sources near an initial pH of 7.0 had about half of the final pH readings >5.0 and about half <5.0. Water chemistry is affected by several factors, and the cations present, other dissolved materials, dissolved oxygen, as well as small particulates may have affected our pH measurements.
Similar to the response of the BAPMA dicamba formulation, adding the DGA+VG formulation increased the pH when the water source had a lower original pH and decreased the pH when the herbicide was mixed into water with higher original pH values (Figure 3A). Likewise, the addition of the GLY-K to the water source and DGA+VG dicamba formulation lowered the mixture pH by 0.5 to 1.7 units (Figure 3B), such that almost all were <5.0 (Figure 3E), indicating a label violation and probable increased dicamba volatility (Anonymous 2018a). The addition of the drift reduction agent had no impact on mixture pH (Figure 3C). The addition of the GLY-K reduced pH below 5.0 for all water sources with original pH values <7.2 (Figure 3D). DGA+VG spray mixture pH varied over a wide range from 5.5 to 6.8 (Figure 3D), and all recorded pH values were >5.0 and thus allowable according to the label (Anonymous 2018a).
Study 3. AMS Effects
A single water source with a pH of 6.2 was used for this experiment, and this initial starting pH choice could have affected the results. AMS is often used when hard water (and higher pH) affects glyphosate activity (Mueller etal. Reference Mueller, Main, Thompson and Steckel2006).
BAPMA results are shown in blue lines (Figure 4A, B) and DGA+VG in red lines (Figure 4C, D). The text label for each line segment on the figure indicates the addition of that component and the endpoint of that addition. For example, in Figure 4A, the starting pH was 6.2. Adding AMS decreased the pH to 5.5. Adding BAPMA increased the pH to 6.9, adding GLY-K decreased the pH to 4.6, and adding the drift retardant Intact had no effect on the pH. Generalized observations from this experiment were that BAPMA always raised the pH, whereas adding the DGA+VG formulation decreased the pH. Adding GLY-K to either dicamba formulation substantially reduced the pH, and adding AMS only slightly reduced the pH (for this particular water source). The addition of the drift reduction agent to any of the four mixtures had no impact on mixture pH. It is interesting to note that the pH effects of GLY additions were much more pronounced than the addition of AMS (Figure 4).
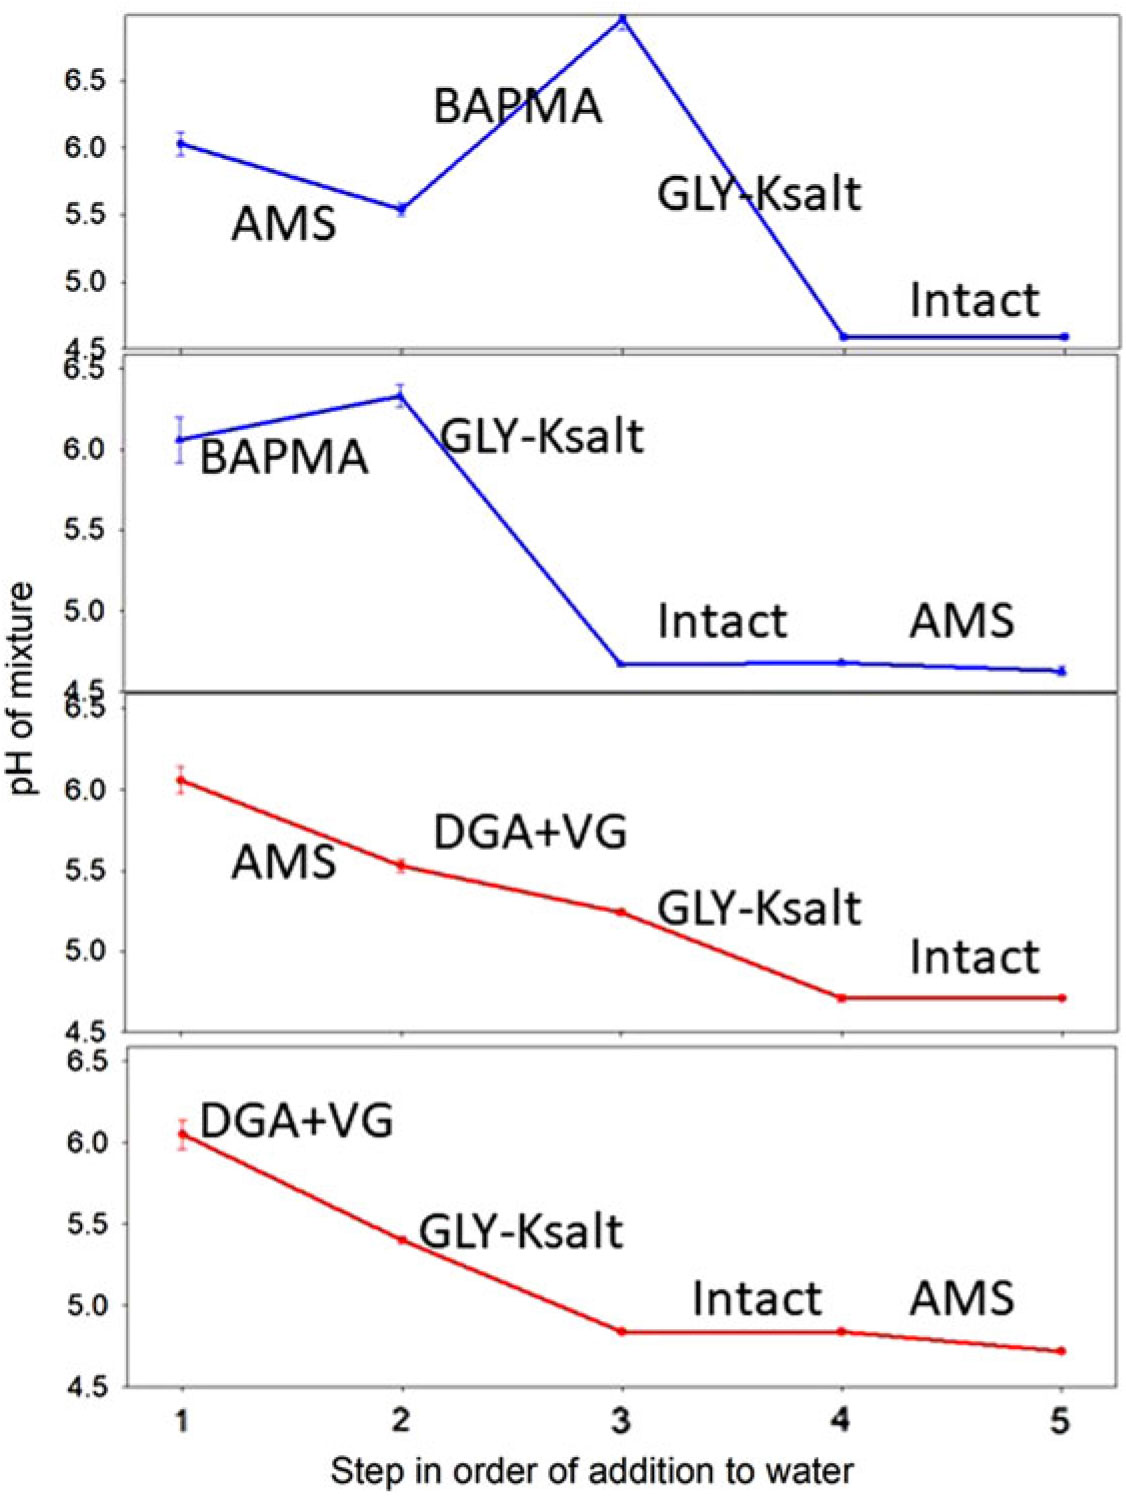
Figure 4. pH as affected by the addition of ammonium sulfate (AMS) either first into the spray mixture (A, C) or last (B, D) and BAPMA (A, B) or diglycolamine + VaporGrip® (DGA+VG) (C, D) and the drift retardant Intact.
Study 4. pH Modifiers
The three pH modifiers have a range of characteristics. Novus K is a nutritional additive that can be applied POST to several crops. It contains 20% total nitrogen with 16.4% urea nitrogen and 3.6% gradually available water-soluble nitrogen, 6% soluble potash (K2O), 3% combined sulfur, 0.25% boron, and 0.1% chelated iron. SoyScience contains 4% urea nitrogen, 10% soluble potash, 0.5% boron, and 1.5% manganese as chelated manganese. ChemPro CP-70 is a proprietary blend of chelating and buffering agents (Chemorse Ltd, Des Moines, IA). The lack of exact component information will be common as growers search for choices for spray pH modifiers.
The three pH modifiers increased the pH of the respective mixtures of either BAPMA or DGA+VG salts of dicamba mixed with GLY (Table 5). The SoyScience product brought about the greatest increase in alkalinity across the three water pH levels tested. Adding the pH modifier first or last made some difference, but all final pH values were still >5.0 (Table 5). There are many more possible adjuvants available to raise spray pH, but these few were selected to examine them for effectiveness.
Table 5. Experiment 4 and the effect of pH modifiers to raise the pH of dicamba and glyphosate mixtures.

a Abbreviations: BAPMA, N,N-Bis-(3-aminopropyl) methylamine salt of dicamba; DGA+VG, the DGA formulation of dicamba with “VaporGrip™” (acetic acid/acetate) included as a pH modifier.
Discussion
Witten (Reference Witten2019) published several key findings (labeled sequentially) that were starkly different from conclusions drawn in this report (available from the author):
A. AMS is prohibited for use with dicamba treatments,
B. Only GLY-K is allowed to be used with dicamba POST applications,
C. Adding Roundup PowerMax (Gly+K) formulation to DGA+VG results in a pH shift of 0.2 to 0.3 units,
D. The final pH of the DGA+VG and glyphosate tank mix should be 4.8 to 4.9,
E. Dicamba formulations other than DGA+VG undergo a larger pH shift from the addition of glyphosate, and
F. The pH of the source water is not a primary factor for volatility.
Our findings relate to each of these in the following ways.
A. The addition of AMS to spray mixtures always reduced the solution’s measured pH, but not as much as the addition of GLY-K. Given the prominent attention that AMS has received as a dicamba volatility enhancer (Anonymous 2018a, Anonymous 2018b) and the minor effect on pH of AMS on our solutions, perhaps another mechanism exists other than pH that influences dicamba volatility under field conditions when AMS is used. If pH is the main driver for dicamba volatility, then these data suggest that adding GLY would enhance volatility more than does AMS. Another possible mechanism affecting dicamba volatility could be cation interactions in the spray mixture, with AMS and GLY-K addition increasing the concentration of cations in the spray solution.
B. Starting with three different pH levels and two water sources from naturally occurring environments, the GLY-IPA formulation examined usually had a higher final pH than GLY-K (Table 1). If the basis for reducing DGA+VG dicamba volatility under field conditions is the pH of the spray mixture (Hemminghaus etal. Reference Hemminghaus, MacInnes and Zhang2017), then GLY-IPA was only slightly favored over the K salt based on our observations (Table 1). Witten’s (Reference Witten2019) disallowance of the use of IPA salts is analogous to the late 1990s, when only certain types of GLY could be used on RoundupReady® crops, whereas the trimesium salt of GLY and others were eventually allowed to be used (Royal etal. Reference Royal, Lunsford and Greeson1999). The various GLY formulations have differing inert ingredients, which could impart various attributes that would affect dicamba volatility under field conditions. However, the basis for DGA+VG having lower volatility has been claimed to be only pH related, thus the IPA salt would be equivalent to the K salt with respect to dicamba volatility. If pH is the main driver, then these data would suggest that the DGA+VG label not allowing tank mixtures with GLY-IPA is due to marketing and not science.
C. In our measurements with DGA+VG, the addition of GLY-K caused a pH change much greater than 0.3 (Figure 3). The actual magnitude of the change in pH units was from a +1.0 to a –2.0 units, which is a 1,000-fold or three orders of magnitude change in pH. This substantial pH change could have profound effects not only on dicamba volatility but also on herbicide efficacy and other behaviors.
D. Although some pH observations were slightly above 5.0, most of the final pH values of the DGA+VG tank mixes with GLY-K were in fact approximately 4.8 (Figure 3E). What the ramifications are of a pH of 4.8 on dicamba volatility under field conditions is not completely known. Mueller and Steckel (Reference Mueller and Steckel2019) reported that adding GLY-K to DGA+VG lowered mixture pH and increased detection of dicamba departing from a treated soil surface over a 60-h period in humidome research over a range of temperatures. It could also be that if a GLY-K is mixed with DGA+VG, in many cases the tank mixture pH would be <5.0 and counter to label directions (Anonymous 2018a) and registrant’s assertions (Witten Reference Witten2019).
E. When GLY-K was added to BAPMA, the pH change was from –1.0 to –2.0 pH units (Figure 2B), and the pH change for DGA+VG after GLY-K addition was from –0.5 to +1.5 pH units (Figure 3B). So, numerically the assertion of Witten (Reference Witten2019) may be true. However, the BAPMA salt’s effect in decreasing volatility compared to the DGA+VG salt may in part be due to other mechanisms independent of the spray mixture pH. There was also a greater disparity in actual changes in pH in the DGA+VG formulations, with some increases and decreases in the pH, whereas the pH of BAPMA mixtures was always reduced by the addition of GLY-K.
F. Volatility was not measured in this research, but in the absence of the GLY-K in the spray mixture all BAPMA and DGA+ VG pH values were well above 5.0 and thus would be presumed to be less volatile (Anonymous 2018a, Anonymous 2018b). Adding GLY-K had a differential response at the different pH levels, and thus source water pH may be a factor in dicamba behavior. Although pH was the only measurement in this research, other factors could have been affecting dicamba volatility under field conditions, such as temperature, humidity, cation interactions, surfactant effects causing a differential rate of plant uptake, speed of drying on the leaf or soil surface, or any of a myriad of other processes that would affect dicamba volatilizing from the applied surfaces.
Author ORCIDs
Thomas C Mueller https://orcid.org/0000-0001-9907-2853
Acknowledgments
The project was conducted under Hatch project TEN00526 and was partially funded by the Tennessee Soybean Promotion Board. No financial conflicts of interest have been declared. Technical assistance by Joe Beeler, Trey Clark, Greg Stapleton, Luke Shoffner, and John Williams is gratefully acknowledged.


 Open access