


Introduction
Genetically modified (GM) herbicide-tolerant (HT) crops are one of the most revolutionary developments in agricultural technology. They allow in-crop use of some herbicides that were previously not employed due to limited selectivity (Heap Reference Heap2014). Additionally, GM crops with two-way or three-way stacked HT traits provide flexibility and convenience in use of herbicide mixtures. Examples include corn (Zea mays L.), soybean [Glycine max (L.) Merr.], and cotton (Gossypium hirsutum L.) cultivars with stacked traits providing tolerance to glyphosate, glufosinate, auxins, and/or 4-hydroxyphenylpyruvate dioxygenase inhibitors (HPPD) inhibitors, some of which have already been commercialized, while others are under development (Green Reference Green2014). While GM crops bring benefits and convenience to modern agriculture, there are concerns that their use may exacerbate selection for herbicide resistance in weeds, because they promote frequent herbicide applications. Furthermore, GM crops may deter the adoption of more complex alternative weed-management techniques that supplement herbicide-based programs.
PRE herbicides with residual activity have been used in agriculture for decades, especially when highly effective POST product options were limited. As the battle against herbicide resistance in weeds, for example, Palmer amaranth (Amaranthus palmeri S. Watson) and waterhemp [Amaranthus tuberculatus (Moq.) Sauer (syn. rudis)], becomes increasingly challenging, PRE herbicides have attracted growing attention. These herbicides do not necessarily stop weed germination but interfere with the formation of new root or shoot cells in very early growth stages of some weedy plants (Vats Reference Vats and Lichtfouse2015). For successful crop establishment, it is essential to apply effective weed-management practices early in the season; this concept is known as early-season weed control (Page et al. Reference Page, Cerrudo, Westra, Loux, Smith, Foresman, Wright and Swanton2012) or early weed management (EWM). To achieve optimum yield, a field should be kept weed-free, especially in the first 30 d after crop emergence (Swanton et al. Reference Swanton, Chandler and Shrestha1999). However, growers are usually hesitant to implement proactive management tactics (Norsworthy et al. Reference Norsworthy, Ward, Shaw, Llewellyn, Nichols, Webster, Bradley, Frisvold, Powles and Burgos2012) such as applying herbicides before weeds appear in the field. Besides, with more than two decades of adoption of glyphosate-tolerant cropping systems, practical skills and expertise of using soil-applied residual herbicides is currently lacking among many growers and agronomists.
Both stacked HT traits and residual herbicides enable more diversity in the way herbicides are used. Other diverse tactics include cultural and mechanical practices such as tillage, crop rotation, planting cover crops, interrow hoeing, and harvest weed seed destruction (Harker et al. Reference Harker, O’Donovan, Turkington, Blackshaw, Lupwayi, Smith, Johnson, Pageau, Shirtliffe, Gulden, Rowsell, Hall and Willenborg2016; Walsh et al. Reference Walsh, Broster, Schwartz-Lazaro, Norsworthy, Davis, Tidemann, Beckie, Lyon, Soni, Neve and Bagavathiannan2018). A grower’s choice of which tactic to use is usually based on a balance between crop safety, commodity prices, product availability, effectiveness, cost, practicality, and sustainability. Conventionally, the short-term effectiveness of a weed control program is tested in field trials. In recent years, there has been growing awareness that the sustainability, that is, the long-term effectiveness, of a program is equally important and should be evaluated before it is recommended to growers. Simulation models are useful tools for fulfilling such an evaluation (Neve et al. Reference Neve, Busi, Renton and Vila-Aiub2014; Renton et al. Reference Renton, Busi, Neve, Thornby and Vila-Aiub2014; Thornby et al. Reference Thornby, Werth, Hereward, Keenan and Chauhan2018). Predictions from the models usually include weed population density and the risk of resistance evolution. In an earlier study, a generic modeling framework was developed for assessing herbicide resistance in annual weed species (Liu et al. Reference Liu, Bridges, Kaundun, Glasgow, Owen and Neve2017). The present study accounted for both quantitative resistance and single-gene effects in order to investigate the following questions: (1) What role do crops with stacked HT traits have in weed control with and without the presence of cross-resistance to multiple herbicide SOAs in weeds? (2) What are the benefits of using residual herbicides? (3) What are the economic implications of a proactive resistance management strategy?
Materials and Methods
Species Studied
The model was parameterized for A. tuberculatus, which is one of the most widespread and problematic weed species in midwestern U.S. soybean and corn production systems (Bensch et al. Reference Bensch, Horak and Peterson2003; Steckel and Sprague Reference Steckel and Sprague2004; USDA Reference Thornby, Werth, Hereward, Keenan and Chauhan2018). Life-history parameters used in the model are summarized in Liu et al. (Reference Liu, Bridges, Kaundun, Glasgow, Owen and Neve2017).
Model Description
The published model implemented the basic intra- and interannual population dynamics of A. tuberculatus using an individual-based modeling approach (Liu et al. Reference Liu, Bridges, Kaundun, Glasgow, Owen and Neve2017) and was programmed in the NetLogo modeling environment (Wilensky Reference Wilensky1999). A prolonged A. tuberculatus emergence ranging from April to July was simulated, with late-emerging individuals having higher natural mortality and lower fecundity as a result of competition with crops. Random mating was assumed in this dioecious species. The model was validated using a worst-case glyphosate-only management scenario, and the predicted time for glyphosate resistance matched field observations (Liu et al. Reference Liu, Bridges, Kaundun, Glasgow, Owen and Neve2017).
Simulation Scenarios
The focus of the present study is to test the herbicide resistance risks in different weed management situations, adopting either stacked HT traits or the EWM strategy. The scenarios were designed based on commonly observed herbicide efficacy values, and the genetic parameters were assumed based on representative field populations (Table 1). Five representative herbicides were hypothesized as H, W, X, Y, and Z. Herbicides W and Z were used PRE, and H, X, and Y were used POST. Genetic basis for resistance in the present study was modeled either in a quantitative manner (H, X, and W) or as a single dominant-gene effect (Y and Z). The former was to represent non–target site resistance or gene amplification and the latter to represent target-site resistance inherited in Mendelian fashion (Table 1). The model simulates a 100-ha (250-acre) soybean field in each run. In general, one PRE application with soil-residual activity and three POST applications are possible; however, not all are needed in each herbicide program. Residual herbicides W and Z provided 99.5% control (i.e., full efficacy) during the time when they have full residual activity, and during the degradation phase, efficacy was assumed to decline linearly from 99.5% to 60% (i.e., reduced efficacy), after which no activity (0% efficacy) was assumed. Additionally, one mechanical control method was included, and the efficacy was assumed to be similar to herbicide applications for direct comparison. Simulation scenarios are detailed in Table 2. Three initial levels of quantitative resistance to POST herbicide H were assumed: 1%, 20%, and 80%, which correspond to populations with low, medium, and high resistance levels, respectively, due to prior herbicide exposure. Each year, there is an influx of seeds (1% of the initial seedbank size) from neighboring fields, the resistance level of which was assumed to be the same as the initial population.
Table 1. Population genetic attributes, herbicide application rates, and residual activity in the model.a
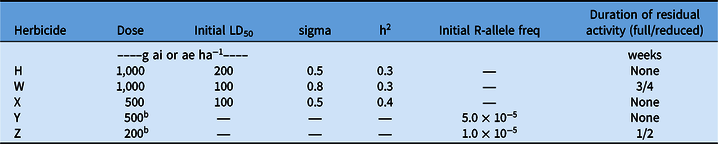
a Resistance to H, W, and X was endowed by quantitative traits; resistance to Y and Z was endowed by single target-site mutation. H, W, X, Y and Z all had different herbicide SOAs. LD50, median lethal dose; sigma, standard deviation of the log-normal distribution of resistance phenotypes; h2, heritability.
Table 2. Simulation settings and the consequent percent exposure in the tested scenarios.

a DAP, days after planting.
b The % exposure is derived from the weed emergence curve and the application/practice dates. Before planting, 32% of the total population emerged and was controlled by preplant burndown or cultivation. Values listed here are % exposure with full efficacy, and in parentheses % exposure with reduced efficacy due to larger plant size or degradation of PRE herbicides.
c Full efficacy of herbicides on sensitive individuals or efficacy of mechanical control regardless of herbicide resistance.
d All emerged individuals are exposed to the mechanical practice, i.e., independent of growth stage.
The simulations were run under several assumptions: (1) Evolution of resistance to each individual herbicide was assumed to be independent of other herbicides, except for scenarios presented in Figure 1D–F. In Figure 1D–F, H and X were assumed to have cross-resistance, implemented via a bivariate log-normal distribution of their phenotypic values (correlation coefficient = 50%). (2) Efficacy values were based on “normal” weather occurring during the season, that is, adequate rainfall or irrigation being received. (3) All A. tuberculatus that emerged before planting were removed either by tillage or preplant burndown and hence do not contribute to resistance evolution. Crops were planted in clean (i.e., weed-free) fields.
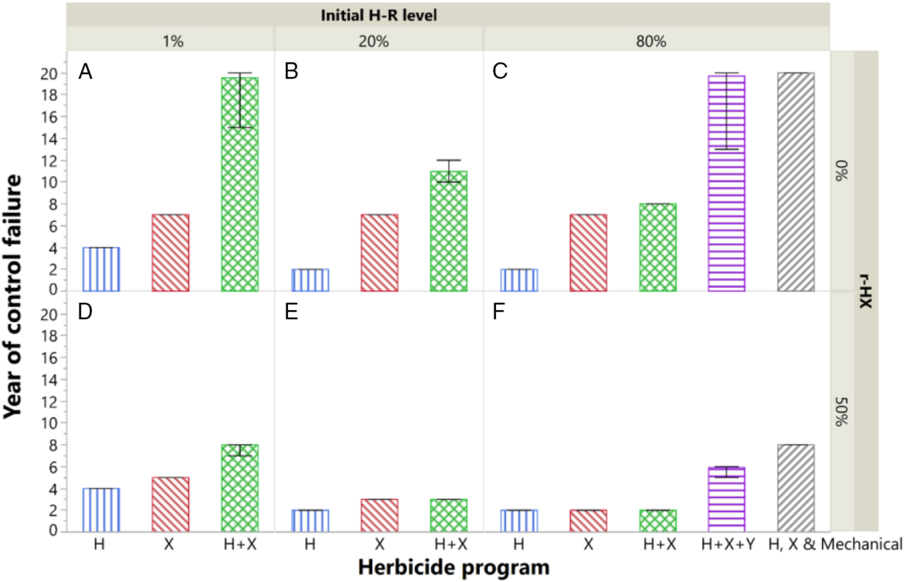
Figure 1. Sustainability of the POST-only programs, as influenced by the number of herbicide SOAs and the initial level of quantitative resistance to herbicide H. Cross-resistance between herbicides H and X is included in D–F. Results are presented as the year of weed control failure; bars represent the mean, and error bars represent the range of 100 replicates. Herbicide scenarios are detailed in Table 2. r-HX, correlation coefficient between phenotypic values of H and X.
Model Output
The model outputs include time series of population density (plants m−2), total percentage of resistant individuals, and the percentages of A. tuberculatus resistant to each herbicide SOA used in the programs. Each scenario was run with 100 replicates. A management program was considered to fail when A. tuberculatus population density exceeded 1 plant m−2, and the year of control failure was recorded.
Cost–Benefit Calculations
Herbicides and GM seeds available on the U.S. market were used as examples in the economic calculations to demonstrate the cost of different herbicide-based management programs and the consequent weed control effectiveness, as well as the profits made by different quality and yield of grains (Table 3). Scenario H represents a POST-only scenario with a solo herbicide SOA, which failed after 7 yr of practice due to evolved resistance, at which time crop yield and grain quality were affected negatively. The other scenarios represent two sustainable herbicide programs for which the resistance risk was low and weed population density was maintained at desired low levels for at least 20 yr: scenario H+X+Y used three-way stacked HT traits with three POST applications, while scenario EWM(ii) used a residual herbicide PRE followed by one POST application in a two-way stacked system (Table 3). The three calculations exemplified scenarios presented in the sustainability evaluation; however, note that the weed populations were assumed to be pristine in the economic calculations while 1%, 20%, and 80% preexisting levels of resistance were assumed in Figures 1 and 2. Calculation of costs was based on the estimated price of herbicides, adjuvants, GM seeds, labor, and application of herbicides. Calculation of benefits accounted for commodity price, which was influenced by grain quality, as well as yield potential, which was impacted by both the short- and long-term effectiveness of herbicide programs. For simplicity, the calculation did not consider the cost of fertilizers, insecticides, fungicides, irrigation, or land rental.
Table 3. Cost–benefit calculation of three example weed control scenarios using products available on the U.S. soybean market.a
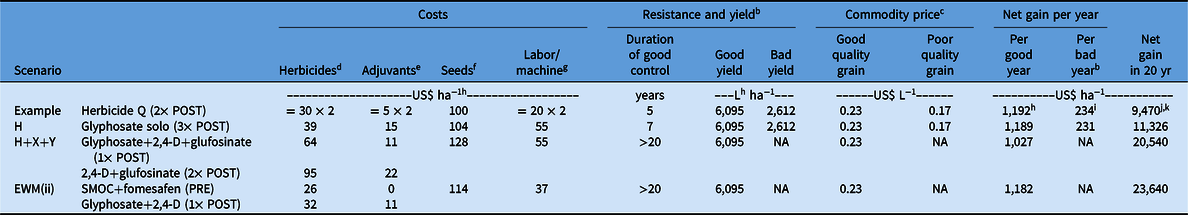
a Note that the calculations here are only presented as figurative examples and do not aim to promote any particular herbicide.
b Good yield without herbicide failure or bad yield (or bad year) due to resistance/weed control failure.
c Considering impacts of weed seed contamination and grain quality.
d Based on Enlist One® (Corteva Agriscience, Wilmington, DE), Enlist Duo® (Corteva Agriscience, Wilmington, DE), Liberty® 280 SL (BASF Corporation, Raleigh, NC), Prefix® (Syngenta Crop Protection, Inc., Greensboro, NC), and Roundup® PowerMax (Bayer Crop Science, St. Louis, MO).
e Based on N-Pak® AMS (Source AMS 34 2 × 2.5. Winfield® United, St. Paul, MN) and drift reduction agent Intact™ (2 × 2.5. Precision Labs Inc., Northbrook, IL).
f Based on Enlist™ soybeans (Corteva Agriscience, Wilmington, DE), Enlist E3™ soybeans (Corteva Agriscience, Wilmington, DE), and Roundup Ready® 2 soybeans (Bayer Crop Science, St. Louis, MO).
g Based on 2018 Iowa Farm Custom Rate Survey.
h 1 ha = 2.47 acre; 1 L = 0.028 U.S. bushel.
i Equals (6,095 L × US$0.23 L−1) − (US$30 × 2 herbicide cost) − (US$5 × 2 adjuvant cost) − US$100 seed cost − (US$20 × 2 labor and machine cost).
j Equals (5 good years × US$1,192) + (15 bad years × US$234).
k Equals (2,612 L × US$0.17 L-1) − (US$30 × 2 herbicide cost) − (US$5 × 2 adjuvant cost) − US$100 seed cost − (US$20 × 2 labor and machine cost).
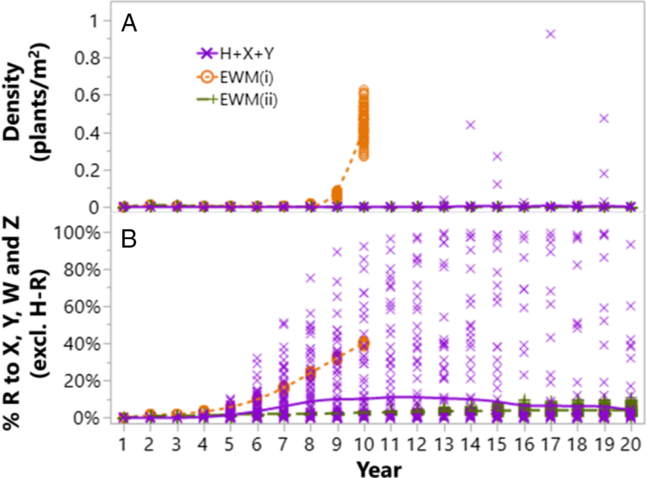
Figure 2. Sustainability of the programs with stacked HT traits or residual herbicides, as influenced by application time (PRE and POST) and number of herbicide SOAs on (A) weed density and (B) resistance evolution. Resistance evolution is presented as % individuals that are resistant to at least one of the herbicides excluding H, either in the form of single or multiple resistance. The populations consist of 80% individuals resistant to H initially. Herbicide scenarios are detailed in Table 2. The simulations were set to stop when weed density exceeded 1 plant m−2, hence the incomplete lines of scenario EWM(i).
Results and Discussion
Stacked Traits and Multiple POST Herbicide SOAs
A program relying on a single POST herbicide SOA, H, led to a control failure in less than 4 yr if the field already contained resistant weeds (Figure 1). In reality, this has been demonstrated by Norsworthy et al. (Reference Neve, Busi, Renton and Vila-Aiub2014) with repeated applications of glyphosate in cotton fields containing glyphosate-resistant A. palmeri. Using a different SOA, X, but applied alone, led to control failure in 7 yr due to evolved resistance to X. Provided that there was no cross-resistance between H and X, the sustainability of X alone was independent of the initial resistance level to H (Figure 1A–C).
Deploying stacked HT traits and multiple herbicide SOAs could add more diversity in management programs and give rise to more effective and sustainable weed control. For example, West et al. (Reference Walsh, Broster, Schwartz-Lazaro, Norsworthy, Davis, Tidemann, Beckie, Lyon, Soni, Neve and Bagavathiannan2018) showed the value of using mixtures of 2,4-D and glyphosate to control glyphosate-resistant A. palmeri; however, this was only valid at an extremely low proportion (i.e., 0.02%) of glyphosate-resistant weeds in a population. Our simulations showed that the advisability of using two herbicide SOAs, H+X in mixtures, for better control than X alone depended upon both the current resistance level to H and cross-resistance between H and X. When 80% of the population was dominated by H-resistant weeds, the added value of using H+X mixture was inconsequential (Figure 1C and F). Similarly, Bagavathiannan et al. (Reference Bagavathiannan, Norsworthy, Smith and Neve2014) suggested that once herbicide resistance has evolved, growers should stop using that herbicide SOA to avoid negative impact on other spray options. Despite the minor contribution of H to the program at a high resistance level, some growers may still choose to include H in their program to control other weed species.
To some growers, a simple strategy may be to use efficient tools repeatedly until they fail, for example, using H solo until failure then switching to X solo. As demonstrated by Figure 1A and C, such a strategy is likely to induce high risk—at the time when H failed, the population would have already reached a problematically high density level. Using X in this situation would result in 7 yr of suboptimal control at best; not to mention if H and X are cross-resistant, scenario X would fail within 2 yr (Figure 1F). Repeated use of the same herbicide SOA, the lack of rotation of crops with different phenologies, applying products at suboptimal rates or time, and the absence of nonchemical control methods have resulted in resistance to 167 different herbicides in 255 weed species around the world to date (Heap Reference Heap2019). Resistant A. tuberculatus populations to various herbicide SOAs have been reported, including acetolactate synthase inhibitors (WSSA SOA Group 2), synthetic auxins (Group 4), photosystem II (PSII) inhibitors (Group 5), 5-enolpyruvylshikimate-3-phosphate synthase inhibitors (Group 9), protoporphyrinogen oxidase inhibitors (Group 14), HPPD inhibitors (Group 27), and long-chain fatty-acid inhibitors (Group 15), in the form of both single and multiple resistant traits (Bell et al. Reference Bell, Hager and Tranel2013; Heap Reference Heap2019; Ma et al. Reference Ma, Kaundun, Tranel, Riggins, McGinness, Hager, Hawkes, McIndoe and Riechers2013; Owen et al. Reference Owen, Beckie, Leeson, Norsworthy and Steckel2014).
For control of the highly H-resistant (i.e., 80%) populations, an additional effective herbicide SOA, Y, was needed, had the relevant stacked trait been available (Figure 1C). As expected, the same scenario, H+X+Y, was able to control populations with lower resistance levels to H (1% and 20%) sustainably for at least 20 yr (data not shown in Figure 1). The use of multiple effective herbicide SOAs helps to avoid overreliance and high selection pressure on any individual compound at any one time (Norsworthy et al. Reference Norsworthy, Ward, Shaw, Llewellyn, Nichols, Webster, Bradley, Frisvold, Powles and Burgos2012).
In reality, there may not be many effective herbicides or stacked traits that are commercially available in a particular market. Nevertheless, replacing herbicide Y with a cultural or mechanical control method (Table 2, H, X & Mechanical) would have been a valuable nonchemical alternative to the available herbicides (Figure 1C).
The aforementioned weed control improvement enabled by the stacked HT traits (Figure 1A–C) would not be as great had there been cross-resistance between H and X. When cross-resistance was assumed, all tested scenarios failed within 8 yr (Figure 1D–F). In particular, the mixture of H+X did not sustain any longer than H alone in the highly H-resistant (80%) field, due to the coselection between H and X (Figure 1F). The deficiency of H and X shifted the selection pressure to Y in the H+X+Y scenario and resulted in control failure within 6 yr. In contrast, mechanical control method was intact and the scenario H, X & Mechanical was affected to a lesser extent (Figure 1F). Since the 1980s, there has been mounting evidence of metabolic resistance underpinned by a common suite of metabolic genes, such as cytochrome P450 monooxygenases and glutathione S-transferases, affecting a wide range of herbicide SOAs (Heap and Knight Reference Heap and Knight1986; Nandula et al. Reference Nandula, Riechers, Ferhatoglu, Barrett, Duke, Dayan, Goldberg-Cavalleri, Tétard-Jones, Wortley and Onkokesung2019). In this sense, stacked traits can potentially lead to more rapid selection of non–target site resistance, often a quantitative trait, as for H and X. The resulting cross-resistance will likely reduce the sensitivity of a broad range of herbicides from similar or dissimilar chemical classes, as well as voiding new chemicals that are yet to be discovered (Nandula et al. Reference Nandula, Riechers, Ferhatoglu, Barrett, Duke, Dayan, Goldberg-Cavalleri, Tétard-Jones, Wortley and Onkokesung2019; Yu and Powles Reference Yu and Powles2014). Simulations presented in Figure 1D–F were simplified scenarios. The actual impact of cross-resistance on weed population dynamics depends on a range of factors, such as the level of correlation between the herbicides (here a bivariate correlation coefficient of 50% was presented only for demonstration purpose), gene expression level, variation among the metabolic genes, and weed species (Gaines et al. Reference Ervin and Jussaume2014). A further complication and challenge for model parameterization is the coexistence of and possible interaction between metabolic resistance and target-site resistance (Nakka et al. Reference Nakka, Godar, Wani, Thompson, Peterson, Roelofs and Jugulam2017).
With the sequential evolution demonstrated by multiple resistance (Figure 1A–C) and simultaneous evolution demonstrated by cross-resistance of H and X (Figure 1D–F), our model is among the first few that address genetic or ecological interactions in the prediction of herbicide resistance, for example, pleiotropic effects (Colbach et al. Reference Colbach, Chauvel, Darmency, Delye and Le Corre2016) or multiple weed species (Thornby et al. Reference Thornby, Werth, Hereward, Keenan and Chauhan2018). Other forms of interaction include chemical interaction, such as synergy and antagonism. For instance, HPPD- and PSII-inhibiting herbicides are synergistic, manifested by interactions on photosynthesis, resulting in potentially better control of atrazine-resistant weeds when atrazine is applied with mesotrione (Abendroth et al. Reference Abendroth, Martin and Roeth2006; Woodyard et al. Reference Woodyard, Hugie and Riechers2009). Model functions to address this phenomenon should be developed where relevant herbicide SOAs are involved.
Early Weed Management with Residual Herbicides
The POST-only scenario H+X+Y was sufficient to maintain the A. tuberculatus population at acceptable low density for at least 20 yr, which, however, was accompanied by 30% probability (out of 100 replicates) of evolved resistance to the mixture partners, X or Y (Figure 2B, purple crosses). Alternatively, growers can use residual herbicides to clean up fields early, followed by POST products as a backup, rather than as the first line of defense, as recommended by the EWM strategy. However, the EWM programs need to be designed properly to ensure weed populations are exposed to at least two effective herbicide SOAs in any given time. A solo herbicide SOA, W PRE, resulted in evolved resistance to W and control failure within 9 yr (Figure 2, EWM(i)). In contrast, the mixture of W+Z PRE followed by the same H+X POST resulted in weed density <0.1 plants m−2 for 20 yr, with resistance level <11% in all of 100 replicates, excluding preexisting resistance to H (Figure 2, EWM(ii)). Although with 80% H resistance, there was only one effective SOA POST, X, in the program, there was a period of overlap between the residual activity of W and X during the 4th week after sowing (Table 1). One additional advantage of EWM(ii) is that it required one fewer application than the POST-only scenario.
To enable programs like EWM(ii), the agrochemical industry is expected to bring more innovative herbicides or SOAs to the market. However, weeds evolve resistance faster than new herbicides are invented (Gould et al. Reference Gould, Brown and Kuzma2018). Moreover, with the increasingly challenging regulatory environment, bringing new products to the market has become more difficult and costly (Hillocks Reference Hillocks2012; McDougall Reference McDougall2016). In this respect, revisiting old chemistries with new formulations or adjuvants, better application technology, or mitigation options to alleviate their potential environmental influence may offer new opportunities. Another challenge is to change the mind-set of growers and stakeholders to embrace the concept of EWM, for which more educational campaigns and demonstration trials are required.
Economic Indications
Although the price difference between various products in Table 3 was small, with careful planning to avoid or delay resistance evolution, the benefit could be substantial. A conventional system with a single herbicide SOA may appear to be economical enough during the first few years; however, repeated use of a solo herbicide SOA would result in rapid evolution of resistance (Figure 1, scenario H), at which time grain quality and yield potential would both be significantly reduced. As a result, the average net gain in 20 yr was less than half the initial annual gain (Table 3, scenario H).
In contrast, proactive herbicide programs, such as H+X+Y and EWM(ii), which required slightly more investment, proved to be highly profitable, returning 1.8 to 2 times higher net gain than scenario H in the long term (Table 3). In this particular case, using more stacked traits with POST-only applications (scenario H+X+Y) was more expensive than the EWM(ii) scenario. This was because of higher cost of the GM seeds with more stacked traits and a higher frequency of herbicide applications, which was accompanied by greater chemical use and labor costs. The figurative examples might have differed had other herbicide products been used.
Additionally, sowing at higher seeding rates or narrower row space increases seed costs but may be beneficial to weed control and consequently increase yield. The actual cost of sowing and harvesting may also be dependent on the herbicide program. Harvesting can be greatly impacted by weed control, although this is difficult to quantify, especially the additional time and fuel for harvesting fields with higher weed population densities. Moreover, commodity prices and grain yields fluctuate considerably from year to year and field to field, hence there may be variations around the absolute values presented in Table 3.
The battle against herbicide resistance is not only a research subject, but also an important socioeconomic problem, the success of which will eventually depend on the cooperation of each grower (Ervin and Jussaume Reference Liu, Bridges, Kaundun, Glasgow, Owen and Neve2014). Therefore, a practical and realistic cost–benefit calculation is key to an educational campaign of sustainable weed control strategies.
Final Remarks
To conclude, in the case of POST-only programs, additional chemical and nonchemical management approaches increased the sustainability of stacked GM crops by reducing the selection pressure. Preexisting resistance and potential cross-resistance compromised control success and sustainability. In the case of EWM programs, the length and overlap of herbicide residual activity played a key role. The higher investment in stacked traits or residual herbicides in earlier years proved to be worthwhile from a long-term cost–benefit point of view.
The focus of this study was to demonstrate best management principles for the mitigation of evolved resistance, in order to provide practical and timely management directions for GM crop varieties that may be available on the market. Examples presented here, however, are specific to the parameter settings, such as weed emergence pattern, residual activity, herbicide efficacies, and genetic parameters. In reality, for any decision-making recommendations, management practices need to be tested by the model on a case-by-case basis.
Finally, whether it is using additional effective herbicide SOA(s) on crops with stacked HT traits, or treating the field with residual herbicides before weed emergence, the essence of a successful herbicide program is to be proactive. Nevertheless, herbicides alone are not the solution to herbicide resistance. The necessity and value of reintroducing nonherbicidal practices to complement chemical solution was illustrated by the model.
Acknowledgments
This research received funding from Syngenta. No conflicts of interest have been declared.


 Open access