


‘Generativity is the basis of the existence and evolution of civilization’ (Huta & Zuroff, Reference Huta and Zuroff2007, p. 47).
In his life-span theory of development, Erikson (Reference Erikson1963) argued that belief in the goodness of human life and hope for human progress and advancement in the future was a crucial developmental goal. He termed this concern for the species ‘generativity vs. stagnation’, describing it as ‘concern in establishing and guiding the next generation’ (Erikson, Reference Erikson1963, p. 267) and as essential for the ‘maintenance of the world’ (Erikson et al., Reference Erikson, Erikson and Kivnick1994, p. 50). Browning (Reference Browning1975) similarly described generative concern for the species as crucial to survival, consisting of passing down skills and good traditions, establishing the next generation, protecting the world, and other tasks essential for continuity of the species. Despite this important role, no study has yet produced a well-fitting measure of generativity. The sole existing twin study indicated that the construct confounds distinct factors and was unable to resolve genetic and family environmental modes of transmission (Fassbender et al., Reference Fassbender, Wiebe and Bates2019). Here, we address these needs, answering three questions: (1) Is generativity unitary or multifactorial? (2) What is the content of those factor(s)? and (3) To what extent does each factor show genetic and environmental underpinnings? In Study 1, we build a three-factor well-fitting model of the Loyola Generativity Scale (LGS) (McAdams & de St. Aubin, Reference McAdams and de St. Aubin1992) and replicate this in Study 2. Study 3 tests the environmental and genetic basis of these three factors in a large twin sample. Before this, we background the origins of generativity in the work of Erikson (Reference Erikson1963) and others building on his work (e.g. de St. Aubin & McAdams, Reference de St. Aubin and McAdams1995; Kotre & Kotre, Reference Kotre and Kotre1984). We then describe the LGS and the competing models for its psychometric and genetic structure before presenting three studies that establish the psychometric structure of generativity, replicating this structure and testing the heritable and environmental effects on this well-fitting structure.
Theoretical Background
Erikson coined the term generativity to describe the period of life following a lengthy period of role identification and establishing lasting relationships, at which point an individual could tackle the tasks of transcending their own existence through work that would maintain society establish and aid the next generation, and create a legacy that might propagate into the future (Erikson et al., Reference Erikson, Erikson and Kivnick1994). The absence of this was described as a period of stagnation (Erikson, Reference Erikson1963).
Erikson’s focus on earlier phases of life meant he conducted little research on the motives and structure of generativity and developed no measurement for generativity. These tasks fell to subsequent researchers, with a growth in interest especially since the 1980s. At this time, it was recognized that research was greatly hampered by the lack of high-quality measures (Ryff & Migdal, Reference Ryff and Migdal1984). Early measures of generativity (e.g. Ochse & Plug, Reference Ochse and Plug1986; Ryff & Heincke, Reference Ryff and Heincke1983) were criticized as lacking discriminant and convergent validity, for being based on wider-ranging aspects of Erickson’s developmental model, and/or as having strong correlations with social desirability (McAdams & de St. Aubin, Reference McAdams and de St. Aubin1992). In an influential paper, McAdams and de St. Aubin (Reference McAdams and de St. Aubin1992) set out to address these problems in their LGS.
Based on an initial pool of items derived from the work of researchers such as Kotre and Kotre (Reference Kotre and Kotre1984), who had developed items measuring central forms of generativity such as ‘outliving the self’, McAdams and de St. Aubin (Reference McAdams and de St. Aubin1992) selected a set of 20 items that correlated with existing generativity scales (e.g. Hawley, Reference Hawley1985; Ochse & Plug, Reference Ochse and Plug1986) but also showed low correlations with social desirability. Example item content includes the following: ‘I try to pass along the knowledge I have gained through my experiences’, ‘I feel that I have done nothing that will survive after I die’ (R), and ‘I feel as though my contributions will exist after I die’. The resulting scale showed adequate internal consistency and test–retest reliability and has become the de facto standard for assessing generativity (McAdams & de St. Aubin, Reference McAdams and de St. Aubin1992). Despite this wide usage, no formal structural models of the scale have been reported. McAdams and de St. Aubin (Reference McAdams and de St. Aubin1992) reported a factor analysis of the LGS items, arguing that while two factors appeared warranted, that these simply reflected opposite valences of generativity and that the LGS had a unitary structure. No formal model assessment was undertaken, and, perhaps more surprisingly, to our knowledge no subsequent studies have examined the structure of the full LGS scale. Thus, despite many hundreds of references to the scale, the question of the structure of the leading assessment instrument remains unexamined. For this reason, we set out in our Study 1 to conduct a formal test of the factor structure of the LGS, followed by constructing a structural model of the scale, and demonstrating its replicability in an independent sample. In Study 2, we replicate this structural model in an independent dataset, assuring ourselves that this structure is replicable. In Study 3, we apply this new three-factor structure to a representative twin sample, modeling the genetic and environmental influences on each factor to resolve the questions of genetic and environmental causation left open in Fassbender et al. (Reference Fassbender, Wiebe and Bates2019).
Study 1: Testing the Phenotypic Structure of Generativity
Most previous studies of the LGS structure have used a heavily modified and abbreviated six-item version of the scale. In perhaps the most comprehensive analysis of this scale, Einolf (Reference Einolf2014) showed that a single factor structural equation model of the six items fits adequately and was measurement invariant across gender and a range of ages. However, this short scale is focused on concerns of participants to help others and neglects contributing to future generations and maintaining society. Einolf (Reference Einolf2014) himself predicted that desire to form a legacy would likely form a separate factor if the full LGS was used. Surprisingly, in a twin study capable of revealing differential transmission of the items, Fassbender et al. (Reference Fassbender, Wiebe and Bates2019) found that three distinct factors were required to account for the patterns of family transmission in the short scale: (1) a general factor of concern for the future, (2) a factor of feeling oneself to be a valued source of advice and assistance for others and (3) a factor involving being a good influence on the lives of others. This multifactorial structure suggested to us that, in the full LGS scale, the multicomponential descriptions of generativity described by Kotre and Kotre (Reference Kotre and Kotre1984), and Erikson (Reference Erikson1963) would emerge.
Based on Erikson (Reference Erikson1963) and on the results of the genetic study conducted by Fassbender et al. (Reference Fassbender, Wiebe and Bates2019), we hypothesized the full LGS would be multifactorial, conforming to a three-factor phenotypic structure. Following Kotre and Kotre (Reference Kotre and Kotre1984) and McAdams and de St. Aubin (Reference McAdams and de St. Aubin1992), we predicted that the content of these factors would be (1) a factor of maintaining society, (2) a factor tapping establishing and aiding the next generation and (3) a factor involving seeking symbolic immortality and leaving a legacy. Given the evidence for correlation among items, we predicted also that emerging factors would correlate with each other.
Method
Participants
The sample consisted of 2780 participants available within the Brisbane Adolescent Twin Study (Couvy-Duchesne et al., Reference Couvy-Duchesne, O’Callaghan, Parker, Mills, Kirk, Scott, Vinkhuyzen, Hermens, Lind, Davenport, Burns, Connell, Zietsch, Scott, Wright, Medland, McGrath, Martin, Hickie and Gillespie2018; Mitchell et al., Reference Mitchell, Campos, Renteria, Parker, Sullivan, McAloney, Couvy-Duchesne, Medland, Gillespie, Scott, Zietsch, Lind, Martin and Hickie2019). Participants were recruited through primary and secondary schools from Queensland, with others recruited through the Australian Twin registry or through word of mouth. For more details, see Wright and Martin (Reference Wright and Martin2004), and Gillespie et al. (Reference Gillespie, Henders, Davenport, Hermens, Wright, Martin and Hickie2013). All participants were volunteers. Of those, participants who did not complete the LGS were excluded (n = 1210). This resulted in a final sample of 1570 participants (male = 492, mean age at testing 28.69 years, SD = 6.70; female = 896, mean age at testing 29.23 years, SD = 7.53; missing sex = 182).
Measures
Generativity was measured using the 20-item LGS. Responses to the items were measured on a Likert scale ranging from 1 (never applies to you) to 4 (applies to you very often). Example items include the following: ‘I try to pass along the knowledge I have gained through my experiences’, ‘I do not volunteer to work for a charity’ (reversed) and ‘I feel as though my contributions will exist after I die’. In our study, the Cronbach alpha for the scale was good (α = .84).
Procedure
The research gained ethical approval from QIMR Berghofer Medical Research Institute and from the University of Edinburgh ethics committees. After consenting, subjects completed the questionnaire online as part of a larger battery and were compensated $20 AUD.
Results
The goal of this study was to determine the number of factors in the LGS and to generate a well-fitting structural model of the structure. Modeling was done using the umx package (Bates, Maes et al., Reference Bates, Maes and Neale2019) and in R (R Development Core Team, 2021). Thresholds for good fit used were root mean square error of approximation (RMSEA) ≤.06, comparative fit index (CFI) and Tucker-Lewis index (TLI) > 0.95, as suggested by Hu and Bentler (Reference Hu and Bentler1999). Prior to analysis, data were residualized for age and sex.
We built and compared the fit of one-, two- and three-factor structural models in which each factor was permitted to load on all items, and the factors themselves were permitted to correlate. The one-factor and two-factor models fit poorly (TLI = 0.678; RMSEA = 0.072 and TLI = 0.819; RMSEA = 0.054 respectively). The three-factor model, by contrast, provided a reasonable fit to the data (TLI = 0.885; RMSEA = 0.044) and better than either one- or two-factor models. We next modified the three-factor model to achieve conventional good fit, by removing 20 nonsignificant path loadings. We used a nominal .05 value for significance, but in practice the paths dropped were estimated near zero and had negligible effect on fit. We also required that the Akaike information criterion (AIC; Akaike, Reference Akaike1974) did not increase as a further check when dropping paths. This yielded a model that approximated simple structure, with clearly interpretable item content on each factor. Based on an examination of the residual covariance matrix, three item-item covariances were added: item 6 with item 7; item 18 and 8; and item 17 and 19. These were not specified by theory but generated significant misfit if omitted. This modified model fit well (TLI = 0.933, RMSEA = 0.035) and is shown in Figure 1.
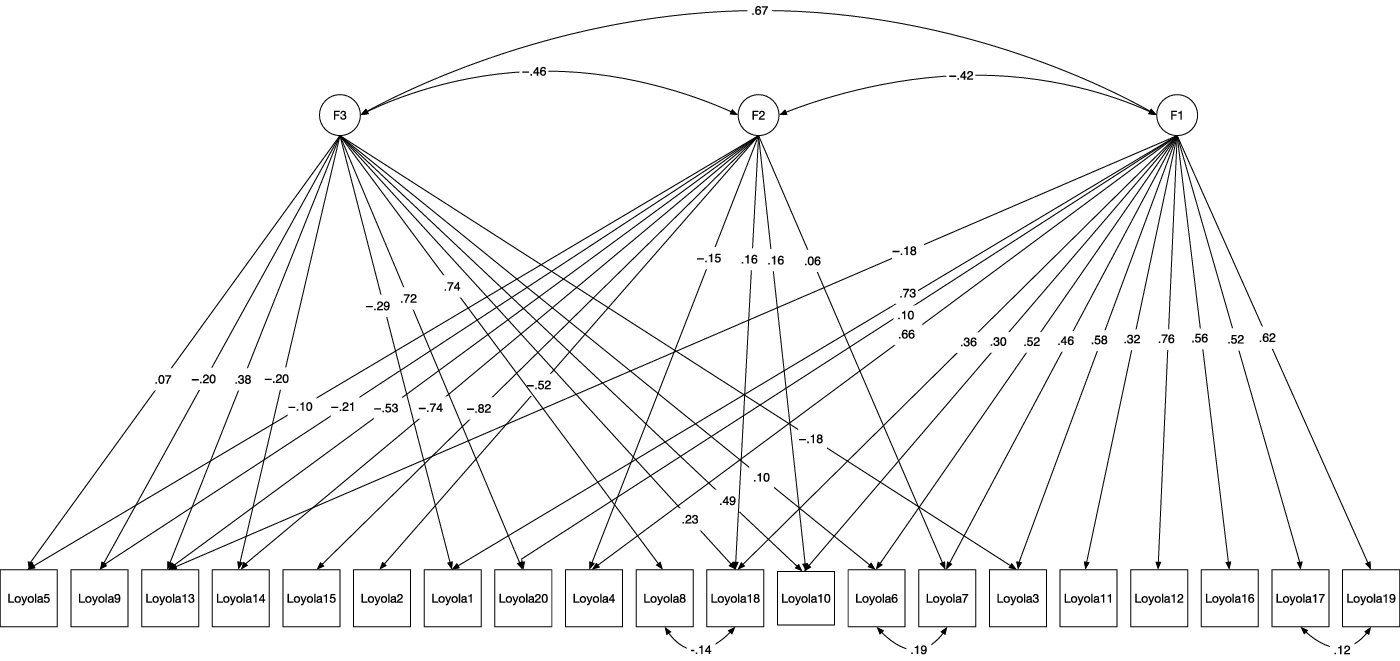
Fig. 1. Final well-fitting, item-level model of the full Loyola Generativity Scale (Study 1).
Factor 1 loaded on items related to establishing and aiding the next generation; for example, ‘I try to pass along the knowledge I have gained through my experiences’ (item 1). Factor 2 loaded on items related to maintaining society; for example, the reversed item ‘I feel as though I have done nothing of worth to contribute to others’ (item 15). Factor 3 loaded on a concern to leave a legacy; for example, ‘I feel as though my contributions will exist after I die’ (item 20). The three factors showed moderate to high correlations (.42 to .67) with one another. We next discuss these findings before testing replication of the model in Study 2.
Discussion
Study 1 yielded two important findings. First, we found clear support for a multidimensional rather than a unidimensional structure of generativity — generative concern had a three-factor structure and simpler structures fit the data poorly. Second, the item loadings in the well-fitting three-factor model suggested a clear content for each of these three factors, mapping to Erikson’s (Reference Erikson1963) concept of concern for the species as (1) Maintaining the world; (2) Establishing and aiding the next generation; and (3) Innovating to leave a positive legacy (and thus achieve symbolic immortality in the continuation of the species). Finally, strong factor correlations suggested an overarching factor of concern for the species, linking the three factors.
It was clear from the modeling that the unitary models of generativity do not reflect the three-factor structure of this scale. Single factor and single factor plus measurement factor (McAdams & de St. Aubin, Reference McAdams and de St. Aubin1992) models were not supported. This said, the three core motives identified by Erikson (Reference Erikson1963) emerged clearly, and they correlated strongly, supporting generativity as a valid domain.
The factors themselves showed excellent validity for the Erikson (Reference Erikson1963) concept of generativity as concern for the species, with the modification that three motives are distinct. The motive to establish and aid the next generation was expressed in strong loadings on items related to giving advice to others, teaching, and being involved in community groups. The factor of ‘maintaining the world’ loaded on items concerning for maintaining a functioning society; for instance, contributing to one’s neighborhood. McAdams and de St. Aubin (Reference McAdams and de St. Aubin1992), in arguing for a unitary construct of generativity, suggested these items may constitute a measurement or acquiescence factor, containing largely negatively worded items. However, two positively worded items were loaded on factor 2, suggesting more than simple acquiescence. Rather, the factor appeared to represent a substantive factor opposing ‘stagnation’ and actively maintaining the world so it is left better, not worse, than when you entered it.
Finally, the desire to make a unique and enduring contribution, and to develop a durable legacy for the future — what Kotre and Kotre (Reference Kotre and Kotre1984) termed ‘outliving the self’ by achieving symbolic immortality — emerged clearly in items such as ‘I feel that I have done nothing that will survive after I die (R). This also validated the prediction by Einolf (Reference Einolf2014) that desire to form a legacy would emerge as a separate factor in the full LGS. The factor is also consistent with the agentic construct described by McAdams and de St. Aubin (Reference McAdams and de St. Aubin1992).
Study 1 thus demonstrated that the LGS does not measure just one factor, but rather three. These mapped to Erikson’s model of concern for the species as expressed in maintaining the world, establishing and aiding the next generation, and drive for symbolic immortality via a positive legacy. These three factors were distinct, rather than reflecting a single trait, but correlated strongly, consistent with a general generativity construct. We next sought to confirm this model in an exact replication in independent data.
Study 2
Replication of both data and of phenomena, such as the structural model derived in Study 1, is now recognized as crucial for incremental knowledge (Eronen & Bringmann, Reference Eronen and Bringmann2021). Hence, in Study 2 we tested direct replication of the correlated three-factor structure found in Study 1 in an independent sample. While Study 1 subjects were drawn exclusively from Australia, in this replication we wished to test generalizability of the model to a different age and nationality profile, with subjects recruited in the UK and with a wider age range. We predicted that the three-factor structure would replicate with similarly good fit despite these differences in the sample.
Method
Participants
A total of 311 participants (169 females and 152 male) ranging in age from 18 to 68 years (M = 28.1, SD = 9.13) were recruited online using Prolific Academic, an online research platform allowing researchers to recruit participants for payment (subjects were paid £0.54). A minimum age of 18 years was specified, with no maximum.
Procedure
The study was approved by the University of Edinburgh psychology ethics panel. After subjects gave informed consent, they were presented with the 20 items of the LGS questionnaire and asked to complete each item. This took approximately 5 min, after which subjects received thanks and a payment of 54p each.
Results
To test whether the model created in Study 1 would replicate using independent data collected in Study 2, we reran the exact final model from Study 1 using the data from Study 2 (residualized for age and sex as in Study 1). This model fit the new data acceptably well (TLI = 0.946; RMSEA = 0.041), with the TLI even improving slightly versus Study 1 (TLI = 0.924). Thus, the replication provided strong support for the robustness, reliability and good fit of this three-factor model of the LGS. The parameter estimates were free to vary from those found in Study 1 but were estimated at very similar levels to those found in Study 1. The three factors were again significantly and strongly correlated with each other. As a further check for consistency across the two differing datasets, we created a supermodel including models of the Australian sample and of the UK sample, constrained to be estimated identically across the two models. This generated a supermodel with good fit (CFI = 0.926; TLI = 0.926; RMSEA = 0.026), further confirming that the three-factor solution and loadings are robust.
Discussion
Study 2 replicated the three-factor structure of generativity found in Study 1 in an exact replication with, if anything, slightly better model fit better in the replication dataset than in the discovery dataset. That the model generalizes to an alternate dataset differing in age and nationality provides strong support for the Eriksonian multifactorial structure of the LGS and supports treating the model as a robust and replicable phenomenon with initial generalizability across samples. The relatively high correlations between the factors (.59 and .77) also replicated, suggesting that a general factor of generativity raising concerns to maintain the world, establish the next generation, and leave a legacy are linked by an underlying trait, as discussed in Study 1.
There were minor differences in item loadings between Study 1 and Study 2. Item 13 (‘I feel that I have done nothing that will survive after I die’) loaded on both Leaving a legacy and Maintaining the world. This matches its face validity, and for simple unit-weighted scoring, it could be scored for both these scales. Item 5 (‘I do not volunteer to work for a charity’) loaded weakly on all factors. Item 9 (‘I believe that society cannot be responsible for providing food and shelter for all homeless people’) also failed to load strongly on any factor. This item is likely more relevant to political motives, such as economic conservatism (Lewis & Bates, Reference Lewis and Bates2018). These two items are not recommended for scoring and likely can be omitted from the scale without loss. There was room, then, for improvement of the scale, but it performed adequately to reliably identify the structure of generativity.
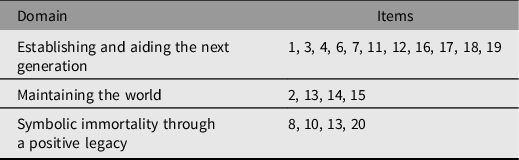
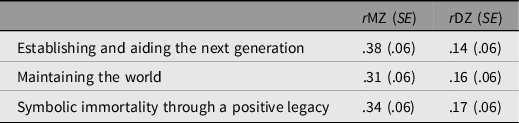
To make this model more widely accessible, Table 1 shows the items to be summed to generate unit-weighted scores for each of the three factors in the model suitable for machine or hand scoring of the scales, excluding the two items mentioned above (5,9).
Table 1. Unit weighting scoring guide for the three-factor model of the Loyola Generativity Scale
We next tested whether three content motives and a general factor are heritable, which might point to future biological, evolutionary and genetic work to understand this covariation among generative motives.
Study 3: A Genetically Informative Analysis of LGS Factor Structure
Study 3 aimed to test the heritability of generativity using the scales derived and confirmed in Studies 1 and 2. The only prior genetically informative report on generativity used a six-item measure administered to 851 pairs of US twins (Fassbender et al., Reference Fassbender, Wiebe and Bates2019), but even this short scale found evidence for three factors of being a good influence, advising others, and making a unique contribution. This study left open the question of whether familial effects on generativity reflected environment or genetic influences, or whether each factor had similar mixes of influence from genes and environment. Our main aim in this study was to use a larger sample and the full questionnaire with validated measurement model of generativity to resolve these questions regarding the heritable and shared environmental influences on generativity.
We tested univariate heritability of each scale and a joint model of the three generativity scales with a predicted common pathway structure (see below) and tested genetic and family environmental effects within this model. Before presenting these analyses, we briefly background the logic of the twin model and the prior findings in this field, touching briefly on work in the general field of the genetics of attitudinal variables.
Twin Modeling
The classical twin design allows investigation of the heritable and environmental influences on traits (Jinks & Fulker, Reference Jinks and Fulker1970; Neale & Cardon, Reference Neale and Cardon1992). These models capitalize on the fact that identical (monozygotic [MZ]) twin pairs share 100% of their genetic makeup while fraternal or dizygotic (DZ) twin pairs share on average 50% of their genetic makeup. These differences allow data from samples of MZ and DZ twins to be used to decompose individual differences in a phenotype into distinct components of additive genetic (A), shared environmental (C) and nonshared or unique environmental (E) components. Alternatively, dominance (D) can be estimated in place of C (more complex family designs allow estimating both D and C simultaneously). Genetic effects are reflected in higher twin correlations in MZ relative to DZ pairs. Shared environment or C refers to environmental factors making twins in a family more similar, irrespective of zygosity. Example influences at this level include social-economic status, neighborhood and parental education. Nonshared environment or E is a residual term and includes all factors in the environment that act to make members of twin pair differ on the phenotype, including measurement error, but also nonshared but systematic environmental effects. These three components are estimated in the ACE model under the (testable and time-tested and model-able; Loehlin et al., Reference Loehlin, Harden and Turkheimer2009) assumptions of equal environments across zygosity (Kendler et al., Reference Kendler, Neale and Kessler1993), and no assortative mating (Swagerman et al., Reference Swagerman, Van Bergen, Dolan, de Geus, Koenis, Pol and Boomsma2017). Since MZ twins share both A and C influences, the effects of E are directly assessed by the degree to which MZ twins fail to correlate perfectly, that is, E = 1- rMZ. Estimates of A and C are derivable from the 100% and 50% genetic sharing in these zygosities, which allow expression of MZ and DZ twin correlations mathematically as rMZ = A + C and rDZ = 0.5 * A + C, where rMZ is the phenotypic trait correlation for MZ pairs and rDZ the correlation in DZ pairs. These equations can be solved for A, yielding A = 2 × (rMZ – rDZ), or twice the difference in the MZ and DZ correlations. Finally, C is identified as 1 – (A + E).
Modern twin modeling allows this logic to be expressed within a much more general and flexible structural equation model (SEM) framework. The SEM framework permits a wide range of complex multivariate designs to be generated and formally tested (Eaves et al., Reference Eaves, Last, Young and Martin1978; Neale & Maes, Reference Neale and Maes1996) available in accessible packages (Bates, Maes et al., Reference Bates, Maes and Neale2019).
The univariate structural ACE model is shown in Figure 2. This model decomposes variance in a manifest trait into A, C and E variance components. This model can be extended to the multivariate case, and here we report univariate heritability of the three generativity scales, but also test the genetic and environmental structure of all three generativity facets jointly in a multivariate framework using common pathway models as shown in Figure 3.
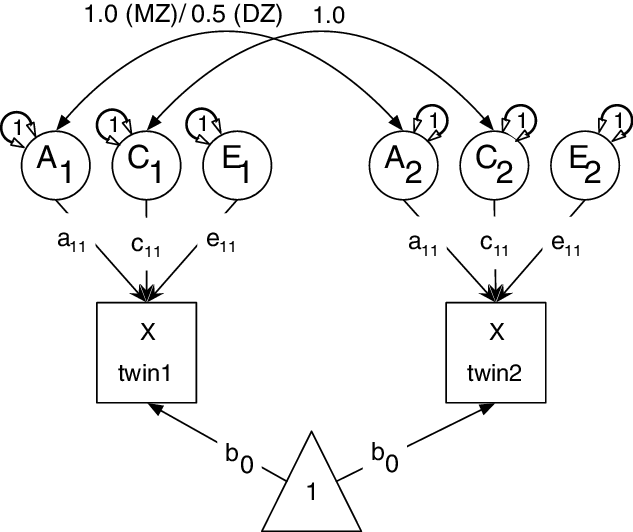
Fig. 2. Decomposing phenotypic trait variance into additive genetic (A), common environmental (C) and unique environmental (E) in the classical twin design. Figure reprinted with permission (Bates, Maes et al., Reference Bates, Maes and Neale2019).
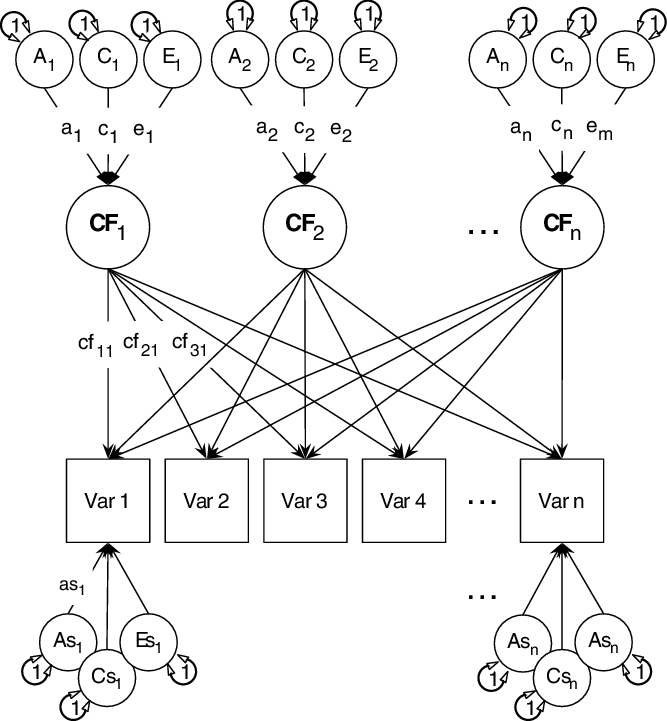
Fig. 3. The common pathway model (showing 3 common factors: CF1, CF2 and CF3). A1, C1, E1 and so on are the additive genetic (A), common environmental (C) and unique environmental (E) influences on these common factors. Finally, ‘As1’, ‘Cs1’, ‘Es1’ etc. are the specific additive genetic, common environmental and unique environmental influences on each manifest variable.
Note: ‘Var 1’, ‘Var2’, … ‘Var n’ = manifest variables. Figure reprinted with permission (Bates, Maes et al., Reference Bates, Maes and Neale2019).
The common pathway model (Kendler et al., Reference Kendler, Heath, Martin and Eaves1987; Martin & Eaves, Reference Martin and Eaves1977) allows researchers to test alternative theorized models of the data using predicted common mechanisms and mechanisms specific to measured phenotypes: additive genetic (‘as’), specific shared environment (‘cs’) and phenotype-specific environmental effects (‘es’).
The common pathway model asserts that one or more common latent factors underly the trait of interest, each of which acts as a focal point for additive genetic (A), shared environmental (C) and nonshared environmental (E) influences on the factor. In addition to providing a statistical good fit, a common factor may correspond to a psychological module or brain system through which genetic and environmental effects act. The common pathway, thus, will fit poorly if such a coherent psychological architecture or brain region does not in fact exist.
The central aim of the present project was to resolve this ambiguity of genetic or shared environmental transmission, using the full LGS scale, and the three reliable scales of generativity discovered and replicated in Studies 1 and 2, respectively. The second aim was to generate a multivariate model of the genetic and environmental architecture of generativity testing whether (1) generativity has a unitary genetic basis (i.e. all three factors of generativity reflect a single genetic influence, with differences among them being determined by environmental effects); or (2) the three factors of generativity have specific genetic influences. We predicted that the three scales would each be heritable, but, given their shared basis in concern for the future, all three would nevertheless share a common factor, and that this would show heritable influences. We were less certain about where shared environmental effects would appear whether on individual generativity measures or at the general factor.
Method
Participants
This study used data collected from 2780 participants, as described in Study 1. The zygosity of 2132 of those participants (1066 pairs of twins) was available. The total sample with available LGS scores (N = 1372) comprised 478 pairs of twins where both had the LGS and 416 pairs where one twin had completed the questionnaire. Of these twins, 413 were MZ females (167 twin pairs, and 79 single twins) with a mean age of 29.7 years (SD = 7.2), 191 MZ males (64 twin pairs and 63 single twin) with a mean age of 28.5 years (SD = 6.6), 285 DZ females (96 twin pairs and 93 single twin) with a mean age of 27.9 years (SD = 7.4), 136 DZ males (38 twin pairs and 60 single twins) with a mean age 28.7 years (SD = 7.8) and 344 were DZ opposite-sex twins (112 twin pairs, 80 single female twin and 40 single male twins) with a mean age of 28.6 years (SD = 7.6). The measurement of generativity is the same as in Study 1.
Results
All analyses were conducted using umx (Bates, Maes et al., Reference Bates, Maes and Neale2019) and OpenMx (Boker et al., Reference Boker, Neale, Maes, Wilde, Spiegel, Brick, Spies, Estabrook, Kenny, Bates, Mehta and Fox2011; Neale et al., Reference Neale, Hunter, Pritikin, Zahery, Brick, Kirkpatrick, Estabrook, Bates, Maes and Boker2016) packages in R (R Development Core Team, 2021). To minimize bias and maximize usage of data, all analyses utilized full information maximum likelihood estimation. Twin data were residualized for covariates of age and sex prior to modeling (Bouchard & Loehlin, Reference Bouchard and Loehlin2001). Model fit was assessed using the AIC (Akaike, Reference Akaike1974), which balances model complexity against explanatory power, with lower AIC preferred. To facilitate comparison of competing models, weight-based conditional probabilities are also presented (Wagenmakers & Farrell, Reference Wagenmakers and Farrell2004).
Descriptive Statistics
The correlations (and SEs) for the MZ and DZ groups are shown in Table 2 as provided by the umx function umxSummarizeTwinData. MZ correlations were consistently higher than DZ twins, supporting a genetic influence on the familial transmission of generativity. As the correlation between MZ twins is approximately twice the DZ twins, the pattern of heritability is compatible with a simple additive genetic model (i.e. an ACE model).
Table 2. The MZ and DZ correlations (and standard errors) for the three factors of generativity
Note: MZ, monozygotic; DZ, dizygotic.
To test familial clustering of generativity in a coarse-grained manner, we fitted univariate biometrical genetic models (Neale & Cardon, Reference Neale and Cardon1992) to each of the three scales in turn using the umx function umxReduce. Concern to establish the next generation showed significant genetic influence (A could not be dropped without significant loss of fit: χ2(1) = 4.330, p = .037. By contrast, shared environment effects C could be dropped with negligible change, χ²(1) = .005, p = .942, supporting heritable effects for concern to establishing the next generation (see Table 3). Similar results were obtained for ‘Maintaining the world’ and for ‘Symbolic immortality’ (see Table 3), with AE models preferred in each case.
Table 3. Univariate ACE, AC and AE models of each dimension of generativity
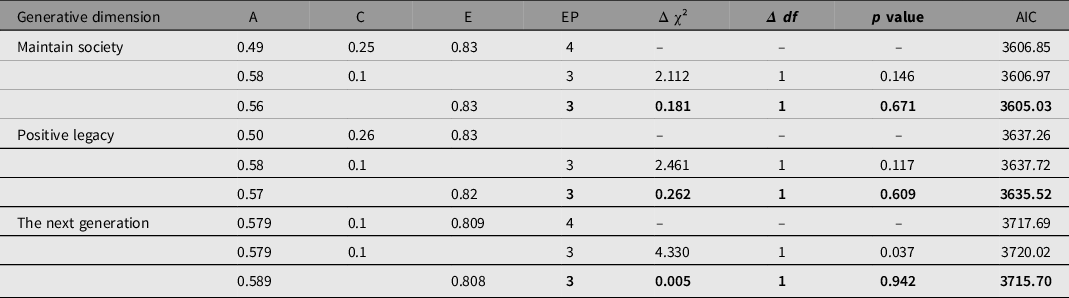
Note: Preferred model in bold type. A, additive genetic; C, common environmental; E, unique environmental; EP, estimated parameters; AIC, Akaike information criterion.
Multivariate Results
We next moved to the analyses of greatest interest: the common pathway model. A saturated three-factor Cholesky ACE model served as the baseline model. This was built using the umxACE function (Bates, Maes et al., Reference Bates, Maes and Neale2019). The predicted model for the genetic structure of generativity was a common pathway model with a heritable psychometric common factor (accounting for covariance among the scales) and three specific heritable influences, one for each of the specific generative adaptations of maintaining the world, establishing the next generation, and innovating to create a positive legacy. This was implemented using the umxCP function (Bates, Maes et al., Reference Bates, Maes and Neale2019).
The single common pathway model fits well compared to the saturated baseline model, χ²(4) = 3.111, p = .540; see Figure 4. Confidence intervals for the influence of A and C indicated that all A influences were significant while all shared environment paths were nonsignificant.
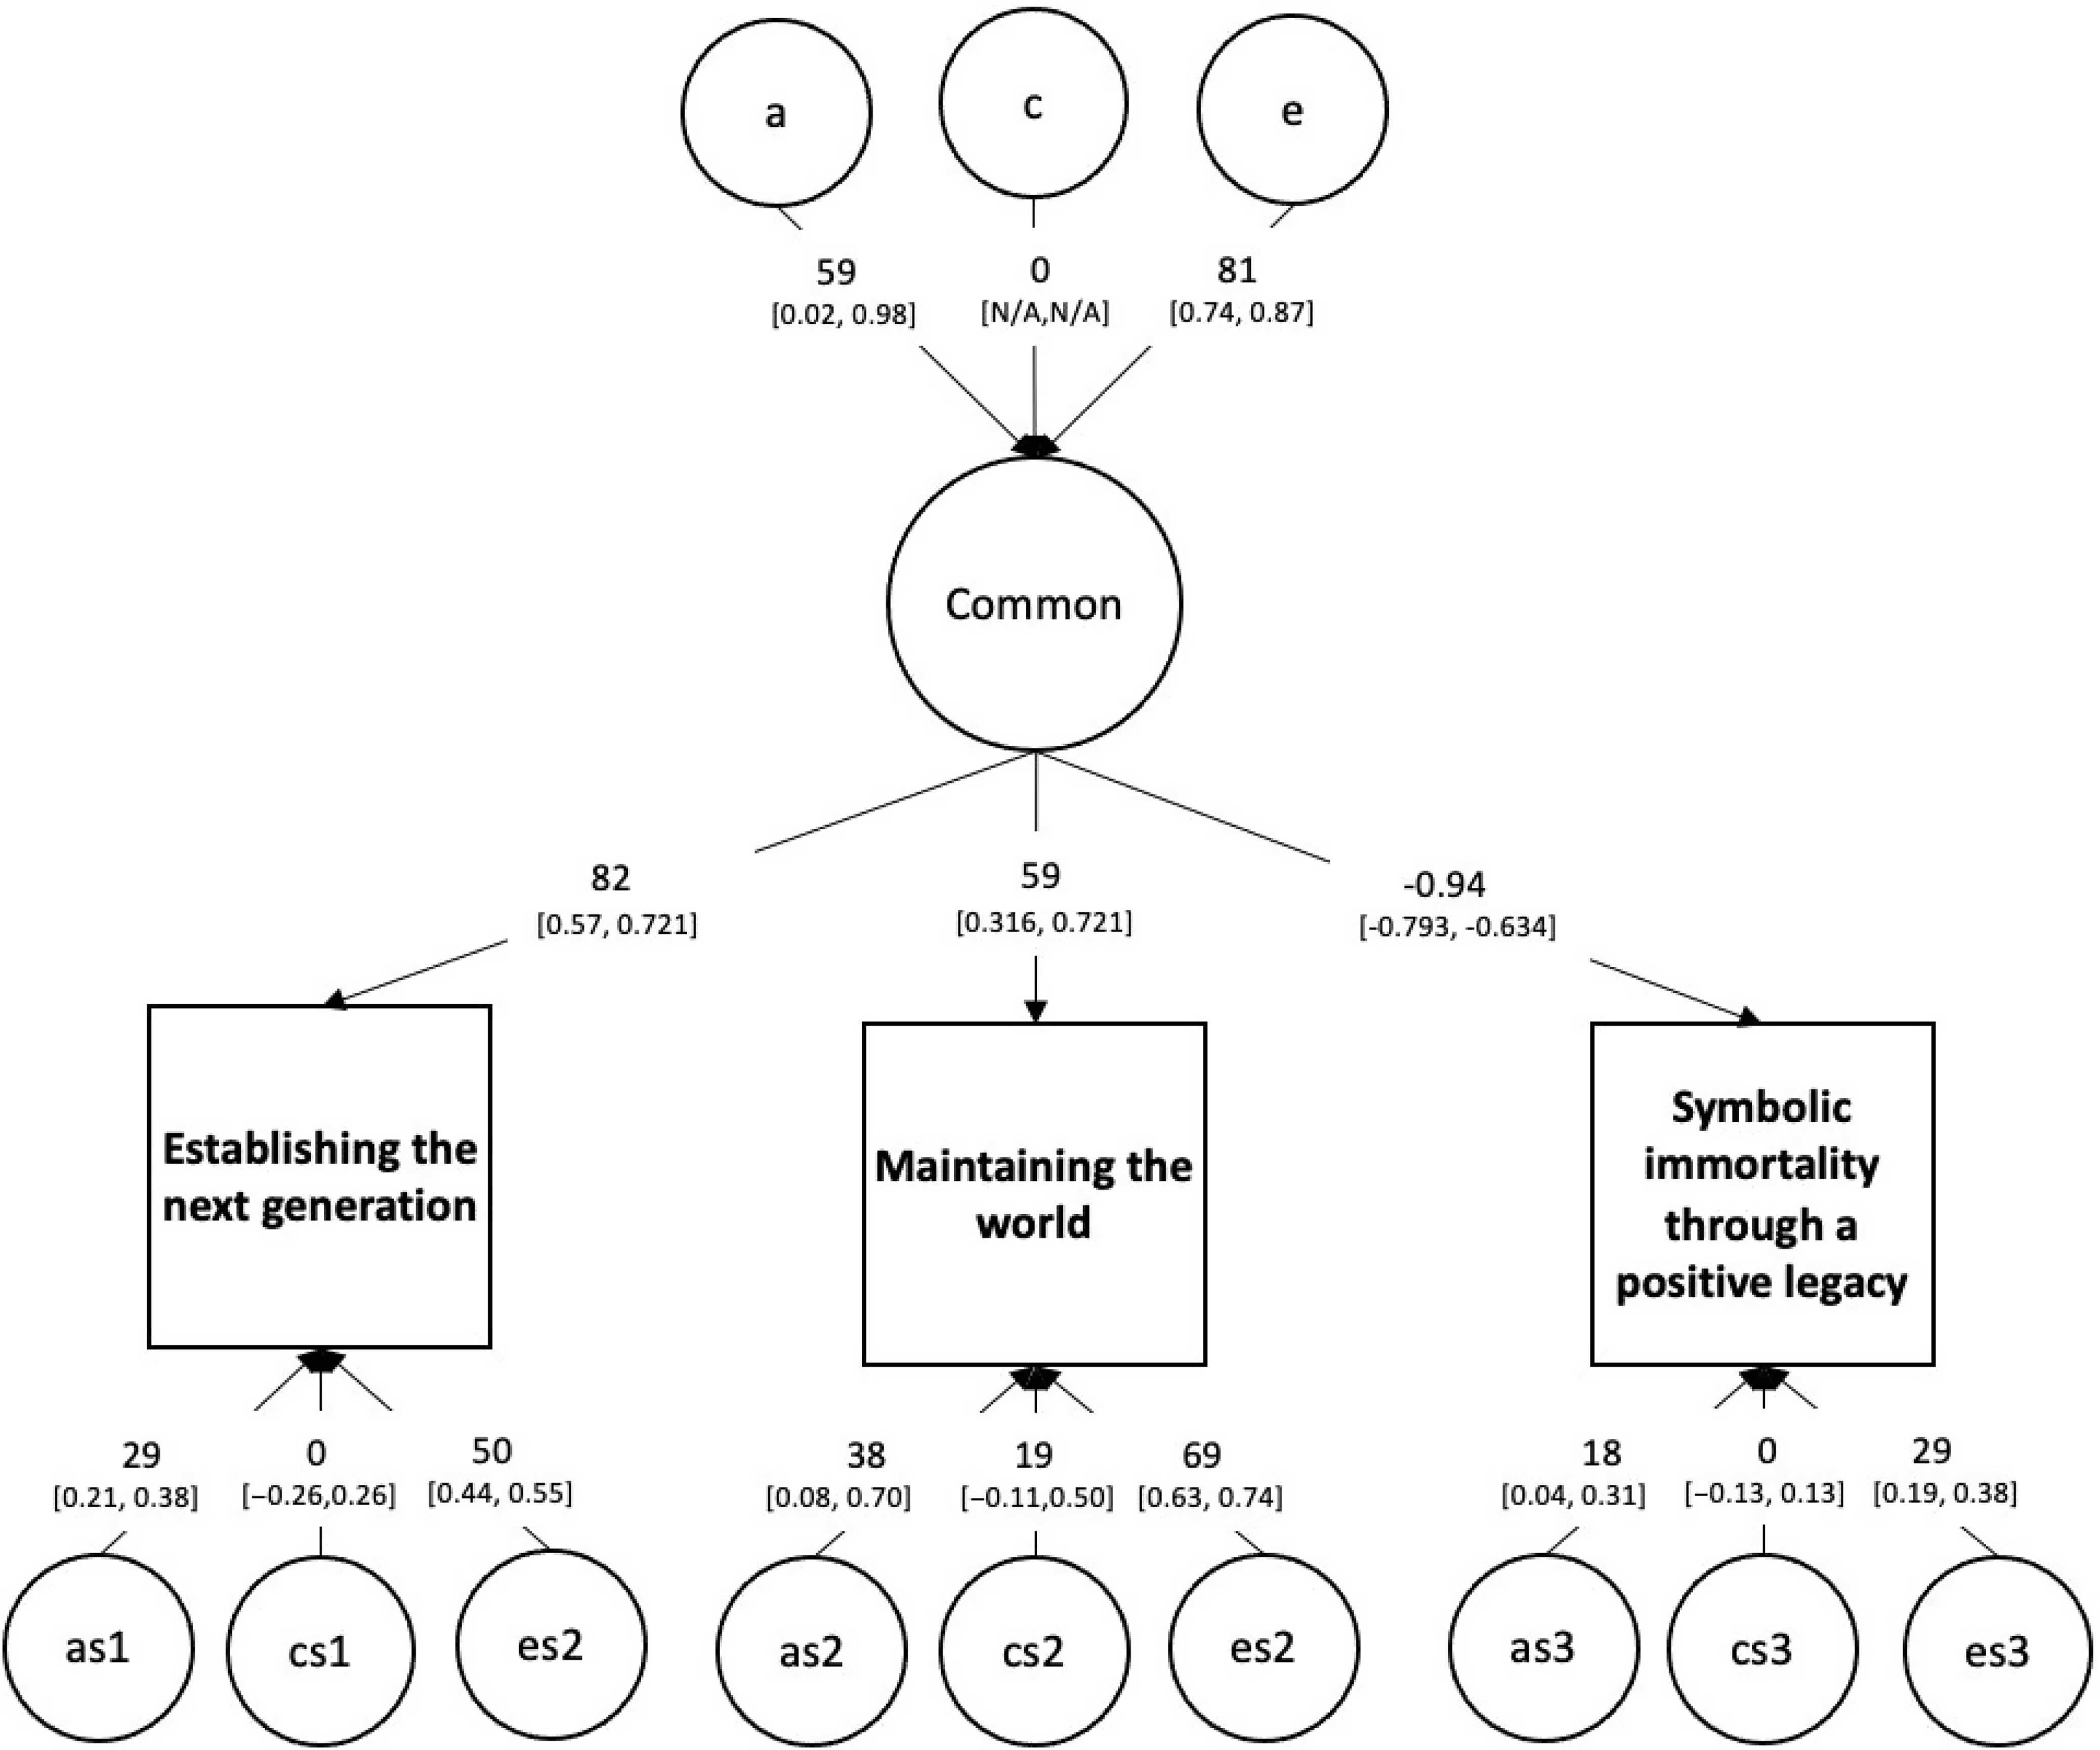
Fig. 4. The full genetic and environmental common pathway model of generativity.
Note that ‘a’, ‘c’ and ‘e’ are respectively the genetic, shared environment and unique environment influences on the common factor, while ‘as’, ‘cs’ and ‘es’ are the specific influences on each manifest variable.
To reduce this model, we tested dropping C on the common factor (‘drop common c’), and on the specific factors (‘drop specific c’). In each case, C could be dropped with negligible effect on fit (see Table 4). By contrast, the estimated effects of additive genetic influences were much higher and attempting to drop these genetic effects (‘A’) from the saturated model caused a significant reduction in fit, χ²(4) = 45.283, p < .001.
Table 4. Comparison of the different models of generativity: the baseline (saturated variance — covariance model), 1 common pathway model (CP1) and reduced versions of this model
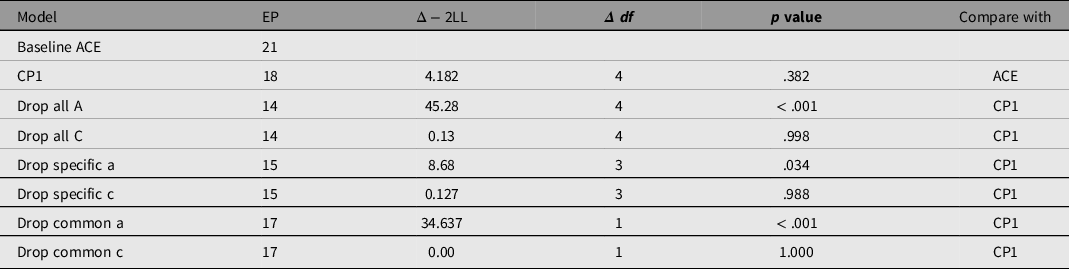
Note. CP1, saturated common pathway model with 1 common factor; EP, estimated parameters; Δ − 2LL = change in −2× log(likelihood).
Discussion
Study 3 yielded three important findings. First, the mode of transmission of generativity across generations was clarified, with significant evidence for a genetic influence, and only modest family environment effects. Second, the predicted common pathway model was validated, supporting both the general factor linking aspects of concern for the species, but also validating the importance of distinguishing between maintaining the world, establishing and aiding the next generation, and leaving a legacy. Third, clear support was found for specific genetic influences on each generativity factor. We discuss these findings in more depth below.
As the principle difference between the present study and Fassbender et al. (Reference Fassbender, Wiebe and Bates2019) was our use of the full scale, sampling the full range of manifestations of generativity as specified by McAdams and de St. Aubin (Reference McAdams and de St. Aubin1992) likely accounts for our finding of clear and unequivocal support for not only a three-factor structure, and a general factor, but also for clear and significant heritable influences on these factors. With our larger sample and use of the full LGS, we were able to clarify that this trait is transmitted genetically, but not through between-family effects (though see below for possible masked effects of parenting). Clearly, however, a large role was revealed for unique environments. Moreover, different cultures could not be explored here, but it would be counterintuitive if, for instance, cultural norms for the status attached to innovation, civic participation and duties to the next generation did not alter mean levels of expression of generativity across different epochs and nations.
Each of the three components showed distinct and moderate contributions of genes, as did unique environments, with largely nonsignificant evidence for shared environment. This is consistent with previous findings that assume the role of cultural demand in shaping generativity (Keyes & Ryff, Reference Keyes, Ryff, McAdams and de St. Aubin1998; McAdams & de St. Aubin, Reference McAdams and de St. Aubin1992), with twins in a family being exposed to differing microcultures in adulthood (Harris, Reference Harris1995), influencing attained levels of generativity. It should be noted that low levels of shared environment may be masked if relevant parenting activity is also genetically influenced (Bates, Maher et al., Reference Bates, Maher, Colodro-Conde, Medland, McAloney, Wright, Hansell, Okbay, Kendler, Martin and Gillespie2019; Bates et al., Reference Bates, Maher, Medland, McAloney, Wright, Hansell, Kendler, Martin and Gillespie2018; Kong et al., Reference Kong, Thorleifsson, Frigge, Vilhjalmsson, Young, Thorgeirsson, Benonisdottir, Oddsson, Halldorsson, Masson, Gudbjartsson, Helgason, Bjornsdottir, Thorsteinsdottir and Stefansson2018). Given the nature of generativity and its links to establishing the next generation so they can also be generative, it is reasonable to predict that generativity might well show significant nontransmitted effects, similar to educational attainment (Bates, Maher et al., Reference Bates, Maher, Colodro-Conde, Medland, McAloney, Wright, Hansell, Okbay, Kendler, Martin and Gillespie2019; Bates et al., Reference Bates, Maher, Medland, McAloney, Wright, Hansell, Kendler, Martin and Gillespie2018; Kong et al., Reference Kong, Thorleifsson, Frigge, Vilhjalmsson, Young, Thorgeirsson, Benonisdottir, Oddsson, Halldorsson, Masson, Gudbjartsson, Helgason, Bjornsdottir, Thorsteinsdottir and Stefansson2018). A large-scale PRS for generativity would be valuable, as would tests of association of generativity with existing PRSs, such as educational attainment. Future research might usefully also test for cohort effects: Is it possible that stagnation might emerge in cohorts as a society ages?
Summary
These three studies were able to demonstrate the first well-fitting model of generativity, showing that this is not a single dimension, but rather three factors organized under a general concern for the species. An immediate useful outcome of the study is the ability for research to study the three scales. This increases the value of generativity not only by deepening our understanding but increasing predictive power by unmasking the potentially distinct correlates of the three forms of generativity.
The modeling also confirmed the core insights of Erikson (Reference Erikson1963) regarding concern for the species as organized around maintaining the world, establishing and aiding its next generation, and working and innovating in ways that improve the world, thus securing a symbolic immortality in the enhanced vitality of the species, often consciously so (Carnegie, Reference Carnegie1889; Vance, Reference Vance2015). Genetic analyses presented here indicated that these are not simply different touchpoints for generative concern but that these modes of concern for the species reflect distinct underlying genetic bases underpinning each motive. It would be fascinating to explore the molecular basis of these motives in a large genome-wide association study, especially given the clear importance of high motivation to secure our survival. Likewise, research on neurotransmitter of brain regions linkages, as well as study, aimed at identifying influences, be they mentorship, experience of generativity in others, etc. that offer potential methods of intervention to motivate generativity. Research on discriminant validity of the construct would also be valuable, for instance differences in concern for the natural environment (Soutter et al., Reference Soutter, Bates and Mottus2020).
Acknowledgments
The efforts of many made this project possible. The authors thank the John Templeton Foundation (USA) whose support via grant GF13666.154364 funded this research, and Eric Turkheimer for coordinating and bringing together, both conceptually and physically, the collection of researchers funded under this grant, and facilitating open conversation at the intersection of philosophy and genetics. The authors are grateful also for the many essential contributions provided by the Genetic Epidemiology team at QIMR Berghofer Medical Research Institute and in particular Richard Parker and Nicholas G. Martin for their support and persistence in making the complex collection process feasible.


 Open access