


From the leaps being made in genetics and brain science we know that there is not a one-to-one mapping between genetic risk and behaviors of good or poor mental health. Instead, an interaction of our genes and environmental experiences, and how they impact brain circuitry, enables the flexibility and resilience of good mental health, or produces the overt signs and symptoms of mental illness. In order to quantify these interactions, we need to identify ‘endophenotype’ markers. These are biologically based markers that are intermediate between genes and overt behavior. This is the equivalent of, for example, in cardiology where tests of coronary artery patency are a link between risk factors and overt symptoms of myocardial infarction.
To define an endophenotype, several key criteria such as heritability, reliability, and clinical plausibility must be established (Gottesman & Gould, Reference Gottesman and Gould2003; Hasler et al., Reference Hasler, Drevets, Manji and Charney2004). We know that the heritability of common mental disorders is high — typically > 40% (Burmeister et al., Reference Burmeister, McInnis and Zöllner2008) — but we do not know the heritability of endophenotypes predicting these disorders. We also do not know which genetic variants contribute to risk for poor mental health versus resilience. Reliability is reflected in stability over time, and clinical plausibility is about being conceptually related to mental health and illness. Twin research is essential to establishing these criteria. Recent studies have started to recognize the need to understand neurobiological links with genetic function, and potential endophenotypes across different brain or autonomic modalities (e.g., de Zubicaray et al., Reference de Zubicaray, Chiang, McMahon, Shattuck, Toga, Martin, Wright and Thompson2008; Kremen et al., Reference Kremen, Prom-Wormley, Panizzon, Eyler, Fischl, Neale, Franz, Lyons, Pacheco, Perry, Stevens, Schmitt, Grant, Seidman, Thermenos, Tsuang, Eisen, Dale and Fennema-Notestine2010; Kochunov et al., Reference Kochunov, Glahn, Lancaster, Winkler, Karlsgodt, Olvera, Curran, Carless, Dyer, Almasy, Duggirala, Fox and Blangero2011). The ‘TWIN-E’ (the Twin study in Wellbeing using Integrative Neuroscience of Emotion) study has been designed to achieve this with 1,500 twins in the prediction of risk and resilience for emotional brain health over time. It assesses genetics, both risk and resilience factors to mental illness, together with measures of behavior, cognition, emotion, psychophysiology, autonomic activity, and brain imaging to predict the spectrum of wellbeing through to psychopathology.
Linking genetics with brain measures requires going beyond the usual approaches used in neurological and psychological research. It needs an integrative theoretical framework. Methodologically, it requires a standardized approach that enables these multiple measures to be acquired in a systematic and time-effective way in the same participants. In the TWIN-E study, we draw on the standardized methods used to establish the Brain Resource International Database (Gordon et al., Reference Gordon, Barnett, Cooper, Tran and Williams2008; Gordon & Williams, Reference Gordon, Williams, Gordon and Koslow2010 [Data available freely for research purposes via the BRAINnet Foundation, www.BRAINnet.net]).
The TWIN-E study is couched in a framework that integrates common theoretical concepts across disciplines and measures. We highlight four core brain processes that have plausibility for understanding mental health; emotional, feeling, thinking, and self-regulatory functions (Gordon & Williams, Reference Gordon, Williams, Gordon and Koslow2010; Williams et al., Reference Williams, Gatt, Hatch, Palmer, Nagy, Rennie, Cooper, Morris, Grieve, Dobson-Stone, Schofield, Clark, Gordon, Arns and Paul2008). This framework offers an integrative way to test hypotheses across areas of mental health, consistent with the broader initiatives in brain science and psychiatry (e.g., Williams et al., Reference Williams, Nagy, Docherty and Gordon2010b, Reference Williams, Tsang, Clarke and Kohnc). These include the shift to a brain-based diagnostic classification system for DSM and the NIMH strategy for identifying biological constructs that underpin classification: referred to as the Research Domain Criteria (RDoC) project (Insel et al., Reference Insel and Cuthbert2009, Reference Insel, Cuthbert, Garvey, Heinssen, Pine, Quinn, Sanislow and Wang2010). The RDoC project aims to create classifications of functional domains derived from research that spans genes, (electro)physiology, neural circuits, and behavior. The ultimate goal is to change the way clinical groups are defined; for instance, shifting from a traditional clinical symptomatology classification system to one that is based on the integration of information across these levels of measurement. Endophenotypes provide a way forward for identifying and differentiating complex phenotypic symptomatology characteristic of mental disorders. They capture the underlying neurogenetic mechanisms contributing to disease, which are unaccounted for in the initial derivations of the DSM categories. TWIN-E focuses in particular on how these functions contribute to the experience of emotional health. We focus on emotional health defined as traits of risk and resilience on a continuum. Our reasoning is that endophenotypes that predict poor emotional health are risk factors for psychopathology, given that loss of emotional regulation is a hallmark of most mental disorders. Endophenotypes predicting positive emotional wellbeing therefore define what makes us resilient.
Our aims are to:
1. Establish the heritability of candidate endophenotypes for trait markers that put us at ‘risk’ for mental illness versus factors that determine ‘resilience’, tested in the same twin sample. These include cognitive performance on emotion identification tasks, psychophysiological activity during emotion tasks, heart rate variability, and cortico-limbic brain circuitry.
2. Evaluate the clinical plausibility of these endophenotypes. We will test if these endophenotypes contribute to confirmed associations between risk–resilience markers of emotional health (e.g., emotion regulation strategies, emotional resilience, and negative biases), and life outcomes or ‘wellbeing’ (e.g., mental health status, quality and satisfaction with life, and work productivity). By testing twin pairs, we will be able to derive the additive genetic component that underlies such associations.
3. Identify the genetic and environmental variants that contribute to the expression of these endophenotypes and moderate their impact on emotional health and life outcomes. Specific candidate genes known to modulate emotional brain function will be targeted. We will focus on early life trauma, based on evidence for its role in modifying genetic effects (Gatt et al., Reference Gatt, Nemeroff, Dobson-Stone, Kuan, Paul, Bryant, Schofield, Gordon, Kemp and Williams2009, Reference Gatt, Nemeroff, Schofield, Paul, Clark, Gordon and Williams2010a), but also extend to other factors including parenting style, health practices, and positive life events.
4. Evaluate the reliability of endophenotypes, defined by their predictive utility over 12 months. Under this aim, we will operationalize what endophenotypes predict risk for poor emotional health and poor life outcomes versus those that predict increased resilience and optimal emotional health.
5. Evaluate what aspects of risk and resilience are modifiable using brain training exercises delivered over a 1-month period. We will test whether brain training is effective in modifying emotional health, and whether the endophenotypes can predict treatment response.
In this paper, we report on the first outcomes addressing Aim 1. We present preliminary heritability estimates for cortico-limbic brain circuitry and cortical connectivity from brain imaging measures acquired for the first 50% of the sample (142 twins). These measures were from structural magnetic resonance imaging (MRI) and diffusion tensor imaging (DTI), yielding data on both grey matter (volume, cortical thickness, and surface area) and white matter (DTI fractional anisotropy [FA], index of white matter connectivity). Heritability estimates give the first insights into the variation attributed to genetics versus environment in these measures in this sample. We drew on previous brain imaging evidence for a strong genetic contribution accounting for total grey matter volume (h 2: 60–82%; Baaré et al., Reference Baaré, Hulshoff Pol, Boomsma, Posthuma, de Geus, Schnack, van Haren, van Oel and Kahn2001; Geschwind et al., Reference Geschwind, Miller, DeCarli and Carmelli2002; Posthuma et al., Reference Posthuma, Geus, Baaré, Pol, Kahn and Boomsma2002; Winkler et al., Reference Winkler, Kochunov, Blangero, Almasy, Zilles, Fox, Duggirala and Glahn2010; Wright et al., Reference Wright, Sham, Murray, Weinberger and Bullmore2002), and the cortical lobes, especially frontal (56–83%; Geschwind et al., Reference Geschwind, Miller, DeCarli and Carmelli2002; Hulshoff Pol et al., Reference Hulshoff Pol, Schnack, Posthuma, Mandl, Baare ´, van Oel, van Haren, Collins, Evans, Amunts, Bürgel, Zilles, de Geus, Boomsma and Kahn2006; including orbitofrontal, 54%, Wright et al., Reference Wright, Sham, Murray, Weinberger and Bullmore2002) and occipital (69–85%; Geschwind et al., Reference Geschwind, Miller, DeCarli and Carmelli2002; Hulshoff Pol et al., Reference Hulshoff Pol, Schnack, Posthuma, Mandl, Baare ´, van Oel, van Haren, Collins, Evans, Amunts, Bürgel, Zilles, de Geus, Boomsma and Kahn2006) involved in emotion regulation and perception, respectively. Moderate genetic contributions have also been observed for the relatively smaller cortices involved in processing and experiencing emotion (e.g., temporal lobe, 59%; parietal lobe, 47%; Geschwind et al., Reference Geschwind, Miller, DeCarli and Carmelli2002). The limbic and paralimbic (including anterior cingulate) structures show a similarly moderate amount of genetic contribution (e.g., hippocampus, 40–64%; amygdala, 55–80%, posterior cingulate gyrus, 51%; Hulshoff Pol et al., Reference Hulshoff Pol, Schnack, Posthuma, Mandl, Baare ´, van Oel, van Haren, Collins, Evans, Amunts, Bürgel, Zilles, de Geus, Boomsma and Kahn2006; Kremen et al., Reference Kremen, Prom-Wormley, Panizzon, Eyler, Fischl, Neale, Franz, Lyons, Pacheco, Perry, Stevens, Schmitt, Grant, Seidman, Thermenos, Tsuang, Eisen, Dale and Fennema-Notestine2010; Sullivan et al., Reference Sullivan, Pfefferbaum, Swan and Carmelli2001; Wright et al., Reference Wright, Sham, Murray, Weinberger and Bullmore2002). Fewer studies have focused on the heritability of cortical thickness and surface area, but they suggest a strong genetic contribution for these measures; estimates for total cortical thickness range from 69% to 81%, and for total surface area, from 71% to 89% (Panizzon et al., Reference Panizzon, Fennema-Notestine, Eyler, Jernigan, Prom-Wormley, Neale, Jacobson, Lyons, Grant, Franz, Xian, Tsuang, Fischl, Seidman, Dale and Kremen2009; Winkler et al., Reference Winkler, Kochunov, Blangero, Almasy, Zilles, Fox, Duggirala and Glahn2010). While the size of the contribution is similar to that for grey matter volume, the genetic influences on cortical thickness and surface area appear to be unrelated. In contrast to these volumetric measures, DTI assesses the myelination and axonal growth of white matter that interconnects cortical regions. Of the few DTI twin studies of white matter to date, adult samples report a wide range of heritability estimates (34–66%) for the FA measure (Chiang et al., Reference Chiang, McMahon, de Zubicaray, Martin, Hickie, Toga, Wright and Thompson2011; Kochunov et al., Reference Kochunov, Glahn, Lancaster, Winkler, Smith, Thompson, Almasy, Duggirala, Fox and Blangero2010), while null results have been seen in young 9-year-old twins (Brouwer et al., Reference Brouwer, Mandl, Peper, van Baal, Kahn, Boomsma and Hulshoff Pol2010). Reflecting this background, our study considers each of these brain imaging measures of both grey and white matter; grey matter volume, cortical thickness, surface area, and DTI (FA). To our knowledge, no previous study has estimated the contributions due to genetics versus environment, or their contribution, in these four measures, in the same sample of twins.
The present results will form the basis for subsequent analyses focusing on replication, stability over time, specific genotype–environment contributions and relationships with self-report, cognitive, and physiological measures in twins. Our goal is to use these combined outcomes from this study to achieve new insights into the biological basis of what puts us at risk for poor mental health, versus what keeps us resilient, with the ultimate goal of providing an evidence base for prevention strategies. Other important aspects of the endophenotype concept include association to disease and co-segregation of the endophenotype and disease within families (Gottesman & Gould, Reference Gottesman and Gould2003). These criteria will be addressed in our collaborative studies in patients and family members with mental illness, which adopt the same standardized measures as adopted in TWIN-E. Association with disease will be assessed in our current clinical trials focusing on patients with depression (Williams et al., Reference Williams, Rush, Koslow, Wisniewski, Cooper, Nemeroff, Schatzberg and Gordon2011), anxiety disorder (Williams et al., Reference Williams, Kemp, Felmingham, Liddell, Palmer and Bryant2007), or attention deficit hyperactivity disorder (Williams et al., Reference Williams, Tsang, Clarke and Kohn2010c). Effects of co-segregation will be assessed in a separate study focusing on family members of clinical patients with depression or anxiety.
Study Organization
TWIN-E is funded by the Australian Research Council (ARC) Linkage grant LP0883621, with Brain Resource Ltd as Industry Partner. The chief investigators listed on this project are Professor Leanne M. Williams (University of Sydney), Professor Peter R. Schofield (Neuroscience Research Australia and University of New South Wales), Professor C. Richard Clark (Flinders University and Brain Health Clinics, South Australia), Associate Professor Anthony Harris (University of Sydney), and Doctor Justine M. Gatt (University of Sydney). Doctor Gatt is also the APDI (Australian Postdoctoral Industry) Research Fellow linked to this grant, and TWIN-E Project Coordinator.
The study is coordinated and managed from the Brain Dynamics Centre, University of Sydney site. Participant recruitment is performed in collaboration with the Australian Twin Registry, Melbourne, Australia. The two EEG testing sites are the Brain Dynamics Centre, University of Sydney, NSW, Australia; and the Flinders University, Adelaide, SA, Australia. MRI testing is conducted at Westmead Hospital, Sydney, Australia. DNA samples are prepared at Genetic Repositories Australia, located at Neuroscience Research Australia, Sydney, Australia.
Study Design
This is a multisite, cross-sequential, randomized-control trial of 1,500 healthy same-sex 18–65-year-old monozygotic (MZ) and dizygotic (DZ) twins, conducted in Australia. Following recruitment, the study incorporates three phases. Phase I and II are a baseline and longitudinal follow-up of the cross-sectional sample across four age decades, and constitute the ‘original’ study funded by the ARC Linkage grant. Phase III is a new ‘appended’ component involving a randomized-control trial and is currently supported in kind from our industry partner, Brain Resource Ltd.
Phase I involves three parts (Figure 1). All participants undertake Part 1 (target minimum N = 1,500 individuals or 750 twin pairs), which involves the completion of the computerized assessments WebQ and WebNeuro via the Internet at home, and the provision of a saliva sample for DNA testing. Part 2 involves a subset of twins (target minimum n = 300 individuals or 150 twin pairs; 20% of total) who reside in Sydney or Adelaide, and who will be asked to complete electrophysiological and autonomic testing at the Brain Dynamics Centre, NSW, or Flinders University, South Australia. Part 3 involves inviting those participants who complete their EEG at the Brain Dynamics Centre to also undertake structural (sMRI) and functional MRI (fMRI) testing (target minimum n = 244 individuals or 122 twin pairs; 16% of total). Phase I testing began in June, 2009, and will be completed by March, 2012.
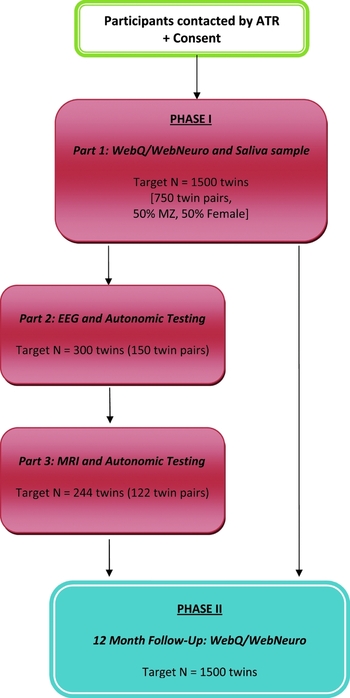
FIGURE 1 TWIN-E Study Design: Phase I (Baseline) and Phase II (12-month follow-up). Study Compliance: A reminder email is sent to participants if the assessment remains uncompleted for 2 weeks, followed by telephone reminder calls at 2-week intervals until the web assessment is complete. Reminders are terminated following the sixth contact and the participant is then considered a ‘passive non-responder’. Participant reimbursement: Participants are reimbursed with a one-page summary report of preliminary heritability outcomes for cognitive performance upon completion of Phase I, Part I; and $50 travel costs per EEG and MRI session for Phase I, Parts 2 and 3.
Phase II of the study is the longitudinal component and involves inviting all participants to again complete the WebQ and WebNeuro via the Internet 12 months after their initial tests (Figure 1). Phase II testing began in June, 2010, and is due for completion by March, 2013.
Phase III is an embedded sub-study. It is a randomized-controlled trial of web-delivered training for brain health and wellbeing (Figure 2). All twin pairs who complete Phase II are invited into Phase III. They are then randomly allocated to either a treatment or waitlist-control group to assess the effects of training on emotional health following a recommended 30-day program. The training program is called ‘MyBrainSolutions’ and is designed to target emotional functions, stress, and cognition (O'Connor et al., Reference O'Connor, Cooper, Williams, DeVarney and Gordon2010). Phase III testing began in August, 2010, and is due for completion by May, 2013.

FIGURE 2 TWIN-E Study Design: Phase III (Brain Training). Study Compliance: A reminder email is sent to treatment and control participants if they have not registered with the MyBrainSolutions online platform within 2 weeks, followed by telephone reminder calls at 2-week intervals until registration. Reminders are terminated following the third contact and the participant is then considered a ‘passive non-responder’. Once registered, treatment participants receive three automated email/SMS reminders sent on Days 25, 29, and 30 to complete the assessment on Day 30. The researchers attempt one final contact 2 weeks following Day 30, for incomplete assessments. Participant reimbursement: Participants are reimbursed with their personalized ‘brain profile’ scores and open access to an online cognitive training portal upon completion of Phase III.
Participants
Ethical Considerations
Ethics approval has been obtained from the Human Research Ethics Committees of both the University of Sydney (03-2009/11430) and Flinders University (FCREC #08/09). Each participant provides written informed consent prior to participation.
Inclusion and Exclusion Criteria
We are aiming to test 1,500 participants (750 twin pairs) across Australia for the baseline cohort, comprising 50:50 MZ to DZ pairs and 50:50 males to females. The age range of 18–65 years was selected to include the age-of-onset for most common psychiatric disorders, and to match the existing clinical and control cohorts from the Brain Resource International Database (www.brainnet.net). Children and adolescents, and adults over the age of 65, were excluded to minimize extreme effects of age (i.e., turbulent developmental changes during childhood/adolescence and typical deteriorations in health that occur during older age).
Eligible participants are same-sex, healthy, adult twin pairs, with English as primary language, and of European ancestry to avoid population stratification effects in genetic analyses. Exclusion criteria include: lifetime/current psychiatric illness (based on diagnostic self-report1); stroke or neurological disorder; genetic disorder; brain injury (causing loss of consciousness for more than 10 minutes); chronic and serious medical conditions (e.g., cancer or heart disease); blood-borne illnesses (e.g., HIV, hepatitis); drug/alcohol substance abuse; and sensory impairments to hearing, hand movement, or vision (not corrected by glasses/lenses). For those twins involved in the MRI-testing component, several other safety criteria are checked and confirmed prior to testing, including prior surgeries, body piercings, tattoos or permanent eyeliner, magnetic dentures, the presence of metal clips, implants, stents, rods or screws, or foreign metal fragments and shrapnel. In addition, participants are automatically excluded from the MRI session if they are pregnant or breast-feeding, or weigh over 150 kilograms.
Recruitment
Recruitment of twin pairs is organized via the Australian Twin Registry (ATR; full approval received 3 October, 2008). The ATR is a national volunteer register of twins interested in contributing to research studies, funded by an Australian NHMRC Enabling Grant. It currently contains around 33,000 twin pairs (equivalent to approximately 10% of all twins in Australia), with 52% MZ twin pairs and 48% DZ twin pairs.
For this study, ATR randomly selected those twin pairs that suited the criteria stipulated using an ‘approach wizard’. Sixteen criteria sets were specified to ensure an even coverage of participants, including variation on zygosity (MZ vs. DZ), sex (male:male vs. female:female) and age bands (18–30, 31–40, 41–50, and 51–65 years). Upon selection, ATR approached the twin pairs with a mailed package that included information about the study, a response form and a screening questionnaire (including questions on ethnicity, primary language, mental/physical health, and Internet access). Up to four rounds of phone follow-up were attempted to non-responders. The participant details of interested twin pairs were forwarded to the Project Coordinator via a secure FTP server on a weekly basis. Participants were then mailed further information to initiate their participation in the study, including participant information sheets and consent forms, a saliva kit and instructions to complete the web assessments over the next week. This recruitment process was initiated in April, 2009.
Measures & Procedures
The methodology used in the current study is standardized across testing sites and has been previously validated in several normal and clinical populations (Paul et al., Reference Paul, Lawrence, Williams, Clark, Cooper and Gordon2005b, Reference Paul, Gunstad, Cooper, Williams, Clark, Cohen, Lawrence and Gordon2007; Silverstein et al., Reference Silverstein, Berten, Olson, Paul, Williams, Cooper and Gordon2007; Williams et al., 2005), and is available in the Brain Resource International Database (Gordon, Reference Gordon2003; Gordon et al., Reference Gordon, Barnett, Cooper, Tran and Williams2008; Gordon & Williams, Reference Gordon, Williams, Gordon and Koslow2010).
Genetics
Genomic DNA was extracted from saliva samples collected using the Oragene DNA self-collection kit (DNA Genotek, Ottawa, Ontario, Canada) using a fully automated extraction procedure (Autopure LS, Qiagen Inc., Maryland, USA). The yield and purity of each DNA sample was assessed by UV spectrophotometry prior to genetic analyses.
Initial genetic analyses of single nucleotide polymorphism (SNP) and other genetic markers will be undertaken in candidate genes of widespread interest and which form part of the hypothesis-driven components of this project. Genes to be targeted will involve those known to modulate neurotransmitters, neuropeptides, and relevant hormones integral to emotional brain function and stress responses. These include the serotonin transporter (SLC6A3) linked promoter polymorphism (5-HTTLPR) ‘short’ versus ‘long’ allele; serotonin receptors 1A (HTR1A rs6295) C vs G alleles, 2A (HTR2A rs6313) T vs C alleles, and 3A (HTR3A rs1062613) C vs T alleles; monoamine oxidase A (MAOA promoter VNTR repeat) ‘low’ versus ‘high’ activity alleles; catechol-O-methyl transferase (COMT Val158Met rs4680) Val versus Met alleles; and brain derived neurotrophic factor (BDNF Val66Met rs6265) Val versus Met alleles (Gatt et al., Reference Gatt, Clark, Kemp, Liddell, Dobson-Stone, Kuan, Schofield and Williams2007, Reference Gatt, Kuan, Dobson-Stone, Paul, Joffe, Kemp, Gordon, Schofield and Williams2008, Reference Gatt, Nemeroff, Dobson-Stone, Kuan, Paul, Bryant, Schofield, Gordon, Kemp and Williams2009, Reference Gatt, Nemeroff, Schofield, Paul, Clark, Gordon and Williams2010a, Reference Gatt, Williams, Schofield, Dobson-Stone, Paul, Grieve, Clark, Gordon and Nemeroffb; Schofield et al., Reference Schofield, Williams, Paul, Gatt, Brown, Luty, Cooper, Grieve, Dobson-Stone, Kuan and Gordon2009; Wacker & Gatt, Reference Wacker and Gatt2010; Williams et al., Reference Williams, Gatt, Hatch, Palmer, Nagy, Rennie, Cooper, Morris, Grieve, Dobson-Stone, Schofield, Clark, Gordon, Arns and Paul2008, Reference Williams, Gatt, Schofield, Olivieri, Peduto and Gordon2009a, Reference Williams, Gatt, Grieve, Dobson-Stone, Paul, Gordon and Schofield2010a). Allele frequencies are calculated to ensure that the samples are in Hardy-Weinberg equilibrium.
The capacity to undertake additional genotyping exists, either as single or multiple SNPs using primer extension followed by mass spectrometry analysis on the Sequenom MassARRAY system (Sequenom, San Diego, CA) or by insertion/deletion electrophoretic size separation assays. A whole-genome association study, using either the Illumina or Affymetrix platforms or an examination of copy number variation, could also be undertaken in the future.
Questionnaire & Cognitive Assessments
For Phase I (baseline) and Phase II (12-month follow-up), participants were required to complete the WebQ and WebNeuro assessments upon receiving their instructions by mail from the researchers. The standardized assessment takes approximately 60 minutes to complete, and is a self-administered, web-based test battery (Silverstein et al., Reference Silverstein, Berten, Olson, Paul, Williams, Cooper and Gordon2007).
WebQ Assessments. The WebQ online assessment is a test battery of self-report questionnaires assessing the following domains (see Tables 1 & 2 for detail):
Twin status (zygosity): At Phase I, participants complete a Zygosity Questionnaire to assess zygosity in terms of MZ, DZ, or IZ (indeterminate zygosity) status (Table 1). For those pairs with indeterminate zygosity, we plan to determine zygosity via DNA testing.
Health screen: At Phase I and II, participants complete a global screen for mental and physical health status, including the Medical History Questionnaire (which includes items adapted from the Mental Status Examination; Trzepacz and Baker, Reference Trzepacz and Baker1993) and the Somatic and Psychological Health Report (SPHERE) (Hickie et al., Reference Hickie, Hadzi-Pavlovic, Scott, Davenport, Koschera and Naismith1998) (Table 1).
Emotional health status (risk and resilience): At Phase I and II, participants complete several self-report measures of emotional health spanning the domains of Feeling and Self Regulation. To assess Feelings, the Depression Anxiety and Stress (DASS-42) (Lovibond, Reference Lovibond1998; Lovibond & Lovibond, Reference Lovibond and Lovibond1995) was administered, and, at Phase II only, the Modified Differential Emotions Scale (mDES) (Fredrickson et al., Reference Fredrickson, Tugade, Waugh and Larkin2003) (Table 1). To assess Self Regulation, the Brain Resource Inventory of Social Cognitions (BRISC) (Gordon et al., Reference Gordon, Barnett, Cooper, Tran and Williams2008; Williams et al., Reference Williams, Gatt, Hatch, Palmer, Nagy, Rennie, Cooper, Morris, Grieve, Dobson-Stone, Schofield, Clark, Gordon, Arns and Paul2008), NEO Five-Factor Inventory (NEO-FFI) (McCrae & Costa, Reference McCrae and Costa2004), Emotion Regulation Questionnaire (ERQ) (Gross & John, Reference Gross and John2003), and the Internal Control Index (ICI) (Duttweiler, Reference Duttweiler1984) were administered, and, at Phase II only, the Ego-Resilience Scale (ER89) (Block & Kremen, Reference Block and Kremen1996).
Life outcome measures (wellbeing): Measures of functional life outcomes included the World Health Organization Quality of Life — brief format (WHOQoL-brev) scale (WHO, 1998; Murphy et al., Reference Murphy, Herrman, Hawthorne, Pinzone and Evert2000), the Satisfaction With Life Scale (SWLS) (Diener, 1985), and the World Health Organization Health and Work Performance Questionnaire (HPQ) (Kessler et al., Reference Kessler, Barber, Beck, Berglund, Cleary, McKenas, Pronk, Simon, Stang, Üstün and Wang2003), at Phase I and II (see Table 1).
Environmental factors: At Phase 1, participants complete several assessments of childhood and adulthood experiences including the Traumatic Life Events scale, the Early Life Stress Questionnaire (ELSQ) (Cohen et al., Reference Cohen, Paul, Stroud, Gunstad, Hitsman, McCaffery, Hitsman, Niaura, Clark, McFarlane, Bryant, Gordon and Williams2006), and the Measure of Parental Style (MOPS) (Parker et al., Reference Parker, Roussos, Hadzi-Pavlovic, Mitchell, Wilhelm, Wilhelm and Austin1997), together with other assessments of health behaviors (e.g., general lifestyle, diet, exercise, sleep). At Phase II, the health behavior questionnaires were repeated and a new measure assessing positive and negative Daily Life Events that had occurred in the year between Phase I and Phase II was also administered (see Table 2).
TABLE 1 WebQ Self-Report: Twin Status, Health Screen, Emotional Health Status and Life Outcomes

MZ = monozygous, DZ = dyzygous.
TABLE 2 WebQ Self-Report: Environmental Factors

WebNeuro Assessments. At Phase I and II, participants also complete a number of cognitive tasks that assess emotion and thinking processes via the WebNeuro platform, which is an online testing platform using a standard keyboard and mouse or laptop pad (Table 3). Standardized task instructions are presented visually on the screen. Norms, reliability and construct validity have been established (BRISC and WebNeuro Assessment Manual, 2010; Mathersul et al., Reference Mathersul, Palmer, Gur, Gur, Cooper, Gordon and Williams2009; Williams et al., Reference Williams, Mathersul, Palmer, Gur, Gur and Gordon2009b).
TABLE 3 WebNeuro Cognitive Performance: Emotion and Thinking Tasks

a Emotional stimuli include faces expressing fear, anger, sadness, disgust, happiness, and neutral expressions.
Cognitive measures for emotion: The Emotion Identification task and the Emotion Recognition task assess explicit and implicit Emotion sub-processes, respectively (BRISC and WebNeuro Assessment Manual, 2010; Mathersul et al., Reference Mathersul, Palmer, Gur, Gur, Cooper, Gordon and Williams2009; Williams, et al., 2009b).
Cognitive measures for thinking: Six sub-processes of cognitive function were assessed by at least one task: Response Speed, Impulsivity, Attention-Concentration, Information Processing Efficiency, Memory, and Executive Functioning (Mathersul et al., Reference Mathersul, Palmer, Gur, Gur, Cooper, Gordon and Williams2009; BRISC and WebNeuro Assessment Manual, 2010).
Electrophysiological Measures
During Phase I, electrophysiological testing is conducted using standardized hardware and software to acquire electroencephalogram (EEG), event-related potentials (ERPs) elicited by resting and activation tasks, with concurrent measures of autonomic function, including heart rate function, eye blinks, and skin conductance. Participants are required to complete six tasks during the electrophysiological testing, which take approximately 1 hour to complete (Table 4).
TABLE 4 Electrophysiological and Autonomic Testing: Resting and Activation Tasks

ERP = event-related potentials.
Before starting the electrophysiological tasks, participants are asked to complete some demographic questions (e.g., age, sex, education), and questions relating to how they are feeling on the day of participation relative to their usual disposition. For the test session, participants are seated in front of a computer screen, in a dimly lit sound-attenuated room. EEG and ERPs are recorded from 26 scalp electrode sites (Fz, Fp1, Fp2, F3, F4, F7, F8, Cz, C3, C4, FC3, FCz, FC4, T3, T4, T5, T6, Pz, P3, P4, CPz, CP3, CP4, Oz, O1, and O2) using a QuikCap and NuAmps system, according to the International 10-20 system (Jasper, Reference Jasper1958). Recordings are relative to the virtual ground, but referenced offline to the linked mastoids (A1 and A2). Horizontal and vertical eye movements are recorded via electrodes placed 1.5 cm lateral to the outer canthus of each eye (horizontal), 3 mm above the middle of the left eyebrow and 1.5 cm below the centre of the bottom left eyelid (vertical). Impedance is kept at no more than 5 kΩ. Continuous EEG and EOG (electro-oculographic) data is collected via the NuAmps system (Scan 4.3), with low pass attenuation of 40 dB per decade above 100 Hz, and at a sampling rate of 500 Hz. Data are corrected for eye movement offline using previously established procedures (Gratton et al., Reference Gratton, Coles and Donchin1983).
Autonomic data is recorded simultaneously and continuously with the EEG and ERP recordings. Heart rate is recorded as an electrocardiogram (ECG) through an electrode placed at the radial pulse on the left inner wrist. ECG recordings are referenced offline to recordings taken from the right clavicle and the seventh cervical vertebra. Respiration is recorded via a belt placed around the participant's chest. Respiration and ECG are recorded with low pass attenuation of 40 dB per decade above 100 Hz, and at a sampling rate of 500 Hz. Both are recorded in reference to the virtual ground. Electrodermal activity (EDA) measures skin conductance via electrodes attached to the medial phalanges of the second and third digits of the left hand with the aid of a transducer (Grass, SCA1). A constant voltage of 0.5 V excites the electrodes, and the current proportional to conductance is converted to voltage, digitized at a sampling interval of 2 ms via NuAmps. Eyeblinks are measured via electromyography (EMG), recorded from an electrode placed on the left orbis ocularis muscle near the eye, located approximately 1.5 mm laterally from the electrode placed below the eye, and 2–3 mm upwards towards the horizontal eye electrode.
Instructions are delivered to participants via the computer screen and binaurally through headphones. Participants respond to instructions via a button box, with four keys (up, down, left, and right). A mouse is used during the final task.
Brain Imaging Measures
During Phase I, all MRI testing is performed on a 3.0 Tesla GE Signa HDx scanner (GE Healthcare, Milwaukee, WI) using an eight-channel head coil. Participants are required to complete five functional scans, three structural scans, and a phase map scan, which takes approximately 75 minutes to complete (Table 5).
TABLE 5 Magnetic Resonance Imaging and Autonomic Testing: Structural and Functional Scans

DTI = diffusion tensor imaging, fMRI = functional magnetic resonance imaging, BOLD = blood-oxygen-level-dependent, EPI = echo planar imaging.
Prior to commencing the MRI session, each participant completes an MRI safety questionnaire screened for any contraindications for MRI, which is reviewed by a radiographer before entering the scanner room. The participant lies supine on the MRI table and is fitted with the head coil. The participant is provided with ear plugs with headphones to attenuate the scanner noise, goggles to view the tasks, and two button boxes to record responses during the task. Participants requiring vision corrections are provided MR-compatible lenses placed within the goggles. The functional tasks are driven by a local computer placed outside the scanner room, which also records participant behavioral responses and autonomic data in a single data file for each task. To match the start of scanning sequence to the fMRI task, each task is programmed to be triggered by a starting pulse sent from the scanner. Similar to the EEG, autonomic data (heart rate and electrodermal activity) is acquired simultaneously during the functional scans. Heart rate is measured using a peripheral pulse oximeter clipped on the big toe of the right foot of the participant. Physiological measurements of average skin conductance are acquired using an electrodermal skin conductance system. The skin conductance response (SCR) detects unambiguous changes in arousal levels, traditionally defined as > 0.05 microSiemens above baseline (Williams et al., Reference Williams, Phillips, Brammer, Skerrett, Lagopoulos, Rennie, Bahramali, Olivieri, David, Peduto and Gordon2001). SCR is measured with a pair of silver chloride electrodes with 0.05 M sodium chloride gel placed on digits II & III of the left hand (Williams et al., Reference Williams, Phillips, Brammer, Skerrett, Lagopoulos, Rennie, Bahramali, Olivieri, David, Peduto and Gordon2001).
Brain Training
Upon completion of Phase II, twin pairs are approached by the ATR to seek interest in participating in Phase III. During this phase, participants are provided the opportunity to receive their own personal scores on the WebQ/WebNeuro assessments from Phase II of the study, and to have access to a web-based brain training portal, called MyBrainSolutions (www.MyBrainSolutions.com). Scores are generated for the domains of Emotion, Thinking, Feeling and Self Regulation as portrayed by the Integrate model (O'Connor et al., Reference O'Connor, Cooper, Williams, DeVarney and Gordon2010). These four scores are then used to compute an individualized brain profile (16 potential profiles derived from the various combinations of these four scores). Notably, none of the profiles is worded negatively, which might imply some sort of deficit, but rather are worded positively, regardless of the participant's scores.
Various combinations of brain training are recommended, personalized to the individual and the brain profile, and to optimize and sustain existing skills, although participants may also select from any of the other games available. Such training regimes include activities that promote emotional function (e.g., focusing on positive facial, verbal, or nonverbal body cues), thinking skills (e.g., to boost attention, memory, and executive functioning skills), regulation of feelings (e.g., strategies to minimize stress and tune into positive feelings), and self-regulation (e.g., learn skills to enhance the ability to manage emotions and feelings, and persevering to meet long-term challenges and goals). The training games are available for download to a mobile device to promote maintenance of training. The effectiveness of the training for regulating emotional health, and its effect on life outcomes like productivity, has been established in a cohort of over 4,000 employees (e.g., O'Connor et al., Reference O'Connor, Cooper, Williams, DeVarney and Gordon2010). Convergent evidence comes from training programs focused on cognitive functions that are effective in boosting scores in as little as 17 training days, with effects maintained anywhere from 3 months to 5 years and transferrable to other skill sets and daily functioning (Jaeggi et al., Reference Jaeggi, Buschkuehl, Jonides and Perrig2008; Mahncke et al., Reference Mahncke, Connor, Appelman, Ahsanuddin, Hardy, Wood, Joyce, Boniske, Atkins and Merzenich2006; Willis et al., Reference Willis, Tennstedt, Marsiske, Ball, Elias, Koepke, Morris, Rebok, Unverzagt, Stoddard and Wright2006). This phase was designed to investigate the impact of activities developed to enhance the key information processes of emotion, thinking, feeling, and self-regulation, and subsequent effects on emotional health and outcomes over time. We will be able to identify the endophenotype measures that predict treatment response. By comparing twin pairs, we will also determine what is most heritable versus modifiable by environment in the effects of training.
When approached by the ATR, the participants are provided with three possible options: (i) to participate in the brain training phase and be randomly allocated to either a treatment or waitlist control group, (ii) to be provided access to the brain training web portal but not be randomized to a group (and therefore their data will not be used in the current study), or (iii) nonparticipation (see Figure 2). The details of interested twins are then forwarded to the project coordinator. When both twins agree to participate, one twin is randomized to the treatment group and the other to the waitlist control group. The treatment group is asked to register and play the games for 30 days. For optimal benefits, participants are encouraged to play the brain games for 30 minutes, two to three times a week, for 30 days; however, ultimately usage (frequency, duration, time of day) is determined by the participant (these factors will be considered in statistical analyses). Participants are then requested to complete a 30-minute web assessment following the 30-day period. Waitlist control twins are granted access to the brain training platform following this 30-day period and are requested to complete the 30-minute web assessment. The assessment includes a subset of web measures collected during Phase I and II; namely, all of the WebNeuro cognitive tasks plus the selected WebQ measures of WHOQoL-brev, SWLS, mDES, BRISC, ERQ, and ER-89.
Data Management
A rigorous data management procedure is adopted in this study to store and transport data, and to maintain data integrity (for quality control procedures, see Williams et al., 2011).
Genetics
Saliva samples are collated in Oragene® DNA sample collection kits (DNA Genotek Inc.) at the Brain Dynamics Centre and stored at room temperature. They are couriered every 1–2 months to Genetic Repositories Australia (GRA), an Enabling Facility supported by NHMRC Grant 401184 for DNA extraction. GRA utilizes a fully automated, large-volume nucleic acid purification system (Qiagen Autopure® LS) using Qiagen's Puregene chemistry and optimized protocols to purify high-quality, high-molecular-weight DNA. The Autopure LS purifies highly stable DNA suitable for archiving, and high-performance DNA for sensitive downstream applications, including PCR, restriction digestion, SNP analyses, and southern blotting. Extracted DNA was quantified fluorometrically using Quant-iT™ PicoGreen ® dsDNA reagent (Invitrogen Australia Pty Ltd) on an Eppendorf Mastercycler RealPlex4 (Eppendorf South Pacific Pty Ltd) and stored in 1.0 X TE buffer at either 4 °C (short term) or -80 °C (long term) until required for genotyping at completion of Phase I. Genotyping is undertaken using standardized assays, which allows custom genotyping of SNPs within candidate genes. Both genotypic and allelic data are scored and stored for analysis.
Questionnaire & Cognitive Assessments
WebQ and WebNeuro are completed at home on the Internet or on the laboratory computer at Sydney or Adelaide testing sites. The WebQ and WebNeuro are linked so that when the WebQ is finished, the WebNeuro will automatically commence. The web assessments are designed so that each self-reported item or cognitive response entered by the participant is logged and time stamped.
Electrophysiological Measures
Electrical brain and autonomic data are recorded onto the laboratory computer as participants complete each task. The computer registers each data point every 2 ms and writes these data with a time-stamped log file. Upon completion of the test session, the data is uploaded as an xml file to the Data Center database at Brain Resource.
The Scoring Server for EEG and autonomic data (in the form of ‘Neuroscan 5’ files) includes a series of artifact correction and rejection procedures. Low-frequency and high-frequency noise is removed by high-pass and low-pass filters, power line artifact by notch filters, and muscle and blink artifact by second-order blind identification and canonical correlation analysis. The Scoring Server also includes quality control software that detects five additional primary sources of artifact (using thresholds for abnormal voltage, baseline shifts, and kurtosis) for removal prior to quantifying the data. EEG, ERP, and autonomic measures are quantified by algorithms in the software that have been verified against the gold standard of manual scoring with high inter-scorer reliability (Task Force of the European Society of Cardiology, 1996).
Brain Imaging Measures
The MRI data analysis and quantification is performed using a unix-based automated analysis pipeline comprising separate sub-analysis streams for each of the functional, T1 structural, and DTI MRI scans. The fMRI data preprocessing and analysis are performed using the statistical parametric mapping (SPM5) software (www.fil.ion.ucl.ac.uk/spm) running on a MATLAB platform (MathWorks, Natick, USA). The fMRI preprocessing algorithms includes motion correction, normalization to standard MNI brain template, smoothing and high pass filtering of fMRI time series to remove respiratory and cardiac artifacts. Changes in BOLD signal for each fMRI task in the form of activation image maps and % BOLD signal values for brain regions are quantified. The T1 structural data is processed using the freesurfer analysis suite (http://surfer.nmr.mgh.harvard.edu/). This stream involves whole-brain parcellation of cortical and subcortical structures. Measures of volume, cortical thickness and surface area (only volume for the subcortical structures) for the brain regions are quantified. The DTI data is processed and analyzed using tools from the FMRIB Software Library (FSL) (Smith et al., Reference Smith, Jenkinson, Woolrich, Beckmann, Behrens, Johansen-Berg, Bannister, De Luca, Drobnjak, Flitney, Niazy, Saunders, Vickers, Zhang, De Stefano, Brady and Matthews2004; http://www.fmrib.ox.ac.uk/fsl). DTI images are preprocessed to correct for motion and eddy current distortions. Diffusion tensor models are fitted voxel-wise to quantify measures of fractional anisotropy, and mean, axial, and radial diffusivity for white matter regions and fiber tracts. All MRI data files for each participant are compressed in a single GNUzip file for backup and archiving. All quantified data is stored in both the GNUzip image or in the form of numerical value.
Analytical Approach
The aims of this study will be examined using a series of biometrical genetics and structural equation modeling (SEM) analyses comparing MZ to DZ twin pairs using the statistical software SPSS, R, and OpenMx. In this sense, we will use the phenotypic covariance between related twin pairs to provide information on the relative importance of genetics versus environment in contributing to total phenotypic variance, as well as how gene–environment interaction or correlation may moderate such relationships. Saturated and hypothesized models will be compared using differences in maximum likelihood estimates, based on the p-value of .05. Proposed endophenotype markers include each of the tested cognitive, brain, and autonomic measures, with the phenotype of interest being emotional health status, and the secondary predictive outcome being life outcomes.
The four main aims of the study will be addressed as follows:
Aim 1: We plan to first identify and confirm the heritability of each of the proposed endophenotypes. Heritability will be confirmed using univariate ACE (additive genetic, common environment, unique environment) and ADE (additive genetic, dominant genetic, unique environment) twin models with SEM on the whole sample (Evan et al., 2002). The moderating impact of sex and age differences on heritability estimates will also be considered.
Aim 2: We plan to establish the clinical plausibility of the endophenotypes confirmed in Aim 1. To do this, we first need to confirm the association between the phenotype, emotional health status, and life outcomes in a healthy cohort. This analysis will include factor analytical modeling to derive the specific measure(s) that best capture trait risk versus resilience. The contribution of each endophenotype to this phenotype–life outcome relationship will then be examined. Bivariate genetic modeling in the twins will be used to confirm these relationships (Loehlin, Reference Loehlin1996), which will provide an estimate of the relative contribution of additive genetics versus unique/shared environment in common pathways.
Aim 3: We plan to identify the specific genetic and environmental factors that moderate associations between the endophenotypes and mental health outcomes. For these analyses, a series of GxE interaction or rGE correlation models will be tested against the univariate ACE twin model (Purcell, Reference Purcell2002). In this sense, we are testing the moderating impact of specific genes or environmental variables on the ACE components. Determination of the use of GxE or rGE models will depend on the hypothesized relationship between the gene and environmental variables, with a GxE interaction conceptualized as a variation in terms of a genetic sensitivity to environments, whereas the rGE correlation is conceptualized as a variation in terms of a genetic disposition towards exposure to different environments (Purcell, Reference Purcell2002). In the first instance, the environmental variable of interest will be early life stress; however, we plan to expand this parameter to the other tested environmental factors (e.g., positive life events, differences in general lifestyle) in future analyses.
Aim 4: We plan to establish the predictive utility of each of the endophenotypes in predicting poor versus good health over the 12-month period. Characteristics of a risk versus resilience profile will be devised; that is, we will confirm the cognitive, neural, and autonomic correlates of trait risk and resilience, and how these profiles predict mental health over time, taking into account moderating impacts of genes and environment. To achieve this aim, several bivariate and multivariate genetic models (Neale and Maes, Reference Neale and Maes2004) will be tested to confirm (a) the common factor model that specifies which combination of endophenotype variables together share variance with trait risk–resilience and life outcomes, drawing from results in Aim 2, (b) the added variance that is contributed from multiple time points, and (c) the moderating influence of key genetic and environmental measures identified in Aim 3 (as well as other covariates).
Aim 5: We plan to evaluate the effects of brain training on improving emotional and life outcomes scores, and the role of endophenotypes in predicting treatment response. We will employ a repeated-measures ANOVA design to first compare those twins randomly allocated to the treatment group with their waitlist control sibling, to assess the relative efficacy of the brain-training program on improving scores over a 30-day period. By comparing twin pairs, age and sex are matched across the groups and a significant amount of variation in environmental exposure shared between the twins during the test period will be controlled. Then, focusing on the treatment group alone, we will be able to compare treatment responders to non-responders to identify key characteristics of the training module that contributed to significant effects (e.g., frequency of usage, types of training), the baseline phenotype, and endophenotype characteristics that predict treatment response, and the specific gene–environment measures that moderate these effects.
Sample Size, Power, and Effect Size
Our minimum target numbers meet requirements for sufficient power to detect significant additive genetic effects in the total sample and EEG/MRI subsets for all three study phases. Power estimates are limited to heritability values >.20 for the WebQ/WebNeuro total sample, or >.40 for the EEG and MRI subsets within the bounds of cost constraints (Visscher, Reference Visscher2004). These estimates are based on optimized proportion ratios using maximum likelihood estimates (Visscher, Reference Visscher2004). This translates to a minimum of 321 pairs for H2 > .20 at the ratio of .56 MZ twin pairs, equivalent to a minimum of 180 MZ pairs to 141 DZ pairs, which will be surpassed for the WebQ-WebNeuro sample of 750 twin pairs; and a minimum of 122 pairs for H2 > .40 at the ratio of .59 MZ twin pairs, equivalent to a minimum of 72 MZ pairs to 50 DZ pairs, which will also be met for the EEG subset (150 pairs) and the MRI subset (122 pairs). To minimize comparisons with multiple variables, the overarching representative factors will be considered in analyses where possible (e.g., one measure of memory function rather than individual performance components as portrayed by the sub-domains in Table 3). Data reduction methods such as principal components analysis will be used to confirm these hierarchical structures.
Preliminary Results
Analyses
For the purposes of the current paper, we have conducted some preliminary heritability analyses in the first 50% of participants, with 142 twins (40 MZ and 31 DZ twin pairs, 58% female, age 18–61 years, mean age 37 years) for the structural brain imaging measures to demonstrate the relative heritability of different brain regions pivotal to emotional brain function. As a broad estimate of heritability, we calculated the intra-class correlation coefficient (ICC) for the MZ and DZ twin pairs, and then calculated heritability estimates using the Holzinger's heritability equation: h 2 or A = 2(ICCMZ – ICCDZ) (Holzinger, Reference Holzinger1929; also sometimes referred to as ‘Falconer's estimate’). The estimates for common environment (C) and unique environment (E) were also calculated using derivatives of this formula: C = ICCMZ – A; E = 1 – ICCMZ. z scores and p-values were calculated for the difference in ICC between MZ and DZ twin pairs. This method was employed as a preliminary investigation of the data, but definitive structural equation modeling methods will be used on the complete sample. The limitation of this approach includes the possible computation of estimates larger than 1, or negative values, which may be a result of gene–environment interactions or differences in variance (Stromswold, Reference Stromswold2001). Therefore, in our interpretation, we consider only a range of scores and relative strength of effects (i.e., ‘strong’ heritability/environment effects for values .70; larger, ‘moderate’ effects for values between .40 and .60; and ‘small’ effects for values less than .40). Results are portrayed illustratively, but actual heritability estimates are provided in the Supplementary Tables for completeness.
The T1 structural & DTI MRI scans were analyzed using the freesurfer analysis suite and FSL software as described in the Data Quantification section above. Cortical surface reconstruction and volumetric segmentation using the T1 images were performed for each individual participant. Both the cortical surface and subcortical structures were automatically labeled using both a subject-independent probabilistic atlas (Desikan-Killiany atlas) labeled by hand and subject-specific measured values (Fischl et al. Reference Fischl, van der Kouwe, Destrieux, Halgren, Segonne, Salat, Busa, Seidman, Goldstein, Kennedy, Caviness, Makris, Rosen and Dale2004), dividing into 34 different gyral-based cortical and the main subcortical areas in each hemisphere. Grey matter volumetric, cortical thickness and surface area measures for all the cortical regions, and only volume for the subcortical regions, were extracted and analyzed. For the DTI data, the fractional anisotropy images for each participant were transformed to standard Montreal Neurological Institute (MNI) space and projected on a white matter skeleton representing the centers of all white matter tracts common to all subjects. Next, the JHU ICBM-DTI-81 WM labels atlas (Mori, Reference Mori, Oishi, Jiang, Jiang, Li, Akhter, Hua, Faria, Mahmod, Woods, Toga, Pike, Rosa Neto, Evans, Zhang, Huang, Miller, van Zijl and Mazziotta2008) was used to label sections of the WM skeleton and extract mean FA values corresponding to 46 (20 bilateral & 6 inter-hemispheric) major WM tracts across the two brain hemispheres. The technical details of both these procedures have been described in detail in a recent publication by our group (Grieve et al. Reference Grieve, Korgaonkar, Clark and Williams2011).
Results
For grey matter, results for volume, cortical thickness, and grey matter surface area are presented in Figure 3 and Supplementary Tables 1–3. For white matter, results for DTI fractional anisotrophy are presented in Figure 4 and Supplementary Table 4. For brevity, we have reported only those regions with heritability estimates larger than .40 in the supplementary tables (with the exception of grey matter volume for subcortical regions, which have been included for comparison, and because of their role in emotion processing). Figures 3 and 4 depict the regions with significant heritability effects (p < .05; top panels), and the relative additive genetic (heritability), and common and unique environmental contributions to each region (bottom panels).

FIGURE 3 Maps of genetic influences on grey matter volumetric (left), cortical thickness (middle), and surface area (right) measures. Regions of significant heritability effects with p < .05 (top panels) and the relative additive genetic (heritability), and common and unique environmental contributions to each region (bottom panels) are shown. Values of .70 or above are considered strong, .40–.60 as moderate, and values .40 or below as small. Regions with >70% effects are labeled: Ba, Banks superior temporal sulcus; cACC, caudal anterior cingulate cortex; cMFG, caudal middle frontal gyrus; Cune, cuneus; EC, entorhinal cortex; FP, frontal pole; Insu, insula; IPG, inferior parietal gyrus; IPL, inferior parietal lobule; Isth, isthmus; ITG, inferior temporal gyrus; LinG, lingual gyrus; mOFC, medial orbitofrontal cortex; MTG, middle temporal gyrus; Occ, lateral occipital; OFC, orbitofrontal cortex; Parahip, parahippocampal; ParaL, paracentral lobule; ParsOr, pars orbitalis; ParsOp, pars opercularis; ParsTr, parstriangularis; pCC, posterior cingulate cortex; Peric, pericalcarine; PostC, postcentral; Precun, precuneus; rACC, rostral anterior cingulate cortex; RMF, rostral middle frontal; SFG, superior frontal gyrus; SMG, supramarginal gyrus; SPG, superior parietal gyrus; STG, superior temporal gyrus; TP, temporal lobe.

FIGURE 4 Maps of genetic influences on white matter integrity using diffuse tensor imaging (DTI) data. Regions of significant heritability effects with p < .05 (top panels) and the relative additive genetic (heritability), and common and unique environmental contributions to each region (bottom panels) are shown. Values of .70 or above are considered strong, .40–.60 as moderate, and values .40 or below as small. Regions with > 70% effects are labeled: ALIC, anterior limb of the internal capsule; BCC, body of the corpus callosum; CC, corpus callosum; CgC, cingulum bundle at cingulate cortex; FX, fornix; ICP, inferior cerebellar peduncle; ML, medial lemniscus; PLIC, posterior limb of internal capsule; pMCP, pontine crossing tract middle cerebellar peduncle; SCC, splenium corporis callosi; SCP, superior cerebellar peduncle; Sfof, superior fronto-occipital fasciculus; ST, stria terminalis; UNC, uncinate.
Grey Matter. Each of the grey matter measures was found to contribute strongly to the variance accounted for by genetics. Total grey matter volume was found to be significantly heritable (Table S1). The medial prefrontal cortex showed strong (> .70) genetic contributions for the volumetric and surface area measures, and moderate (.40–.60) genetic contributions for cortical thickness. This region has been consistently implicated in emotional experience and its regulation. Connected paralimbic subregions to this cortex implicated in specific aspects of these functions (caudal anterior cingulate) also showed strong genetic contributions across all grey matter measures. Across all measures, moderate to strong genetic contributions were also seen for the lateral prefrontal cortex, implicated in behavioral control and regulation; the superior temporal cortex, implicated in face processing and evaluation of emotional context; and the parietal cortex (left inferior, right superior), implicated in the somatic integration aspects of emotion processing (Figure 3, Tables S1-3).
Grey Matter Volume. For grey matter volume, the estimates for heritability (A) for the left medial prefrontal cortex and anterior cingulate (left caudal and right rostral) were strong, contributing to the overall pattern described above (Figure 3). In contrast, heritability for the limbic subregions was small to moderate (Table S1). Strongest heritability for grey matter volume was in the right superior parietal cortex (Figure 3, Table S1). This region has been implicated functionally in self-regulation of emotion (Beauregard et al., Reference Beauregard, Lévesque and Bourgouin2001). Other regions with strong heritability included the subregions of the frontal lobe (left paracentral, right lateral orbitofrontal), the left superior temporal sulcus and cuneus of the occipital cortex, and subregions of the right parietal cortex (superior parietal and cuneus).
Unique environment (E) accounted for most of variance in grey matter volume in a different region of the prefrontal cortex bilaterally; the frontal pole and the left frontal parsorbitalis (Figure 3). The frontal pole has been associated in particular with cognitive and factual processing or reasoning, distinct from the medial prefrontal circuitry, which is involved in emotion-processing tasks (e.g., Hynes et al., Reference Hynes, Baird and Grafton2006). Unique environment accounted similarly for most of the variance in grey matter volume for the bilateral temporal pole, and most of the regions within the limbic/paralimbic cortex, including the bilateral entorhinal cortex and posterior cingulate, and the left rostral anterior cingulate (Figure 3). This finding complements the small-to-moderate genetic contribution for limbic structures. In contrast, common environment (C) accounted for most variance in grey matter volume for the subcortical regions, including the bilateral hippocampus, putamen and pallidum, right caudate and thalamus, left amygdala, specific aspects of the brainstem (mid posterior, central, mid anterior), and specific regions within the parietal cortex (including the left postcentral and supramarginal cortex, and the right inferior parietal region) (Figure 3).
Cortical Thickness. Results for cortical thickness suggested strong heritability for the right lateral prefrontal regions and caudal anterior cingulate, and bilateral temporal and left parietal regions (Figure 3, Table S2). Contributions to genetic variance were strongest for the right lateral areas of the occipital cortex (Figure 3, Table S2).
Unique environment demonstrated strongest contributions to subregions of the limbic/paralimbic cortex, including the bilateral entorhinal and rostral anterior cingulate, to specific right frontal regions (including the frontal pole, caudal middle frontal and medial orbitofrontal cortex), and to left temporal and bilateral banks of the superior temporal sulcus, and the left pericalcarine of the occipital cortex (Figure 3). In contrast, common environment contributed most variance to only specific bilateral regions of the frontal cortex (caudal middle frontal and superior frontal) and the left precuneus of the parietal cortex (Figure 3).
Grey Matter Surface Area. For surface area, a very similar pattern of contributions from genetics versus environment was apparent for the frontal, limbic temporal, and parietal regions, as reported for the volumetric measures (Table S3). Exceptions were stronger heritability estimates for the isthmus cingulate, precuneus of the parietal cortex, and the lingual region and pericalcarine of the occipital cortex, which had only moderate heritability for the volumetric measures. Strong heritability was also found for the right postcentral gyrus of the parietal cortex.
Like the pattern for grey matter volume and cortical thickness, unique environment accounted for most of the variance in surface area for the bilateral frontal pole, temporal pole, and subregions of the limbic/paralimbic cortex (Figure 3). Similarly, common environment contributed mostly to the same regions of the parietal cortex.
White Matter. For DTI, the FA measure of white matter, the strongest heritability was found bilaterally in the cingulum bundle adjacent to the cingulate gyrus. Strong heritability values were also found for the bilateral superior cerebellar peduncle, the left superior fronto-occipital fasiculus and uncinate fasciculus, the right medial lemniscus, inferior cerebellar peduncle and fornix (cres)/stria terminalis, and the body of corpus callosum and pontine crossing tract (Figure 4, Table S4).
In comparison to the grey matter results, the high heritability seen in grey matter measures for the medial prefrontal region was also reflected by strong heritability in the following white matter tracts connecting to the frontal cortex (Figure 4): (i) cingulum bundle (WM tract connecting fibers from the medial prefrontal/anterior cingulate cortex to the limbic hippocampus and entorhinal cortex), and (ii) uncinate fasciculus (WM tract connecting the orbitofrontal cortex to limbic hippocampus/amygdala subcortical regions). Strong heritability was also evident for tracts linked to the limbic system (the fornix/stria terminalis) and to the brainstem (superior cerebellar peduncle, inferior cerebellar peduncle, and medial lemniscus).
The greatest unique environmental contribution was estimated in the right anterior limb of the internal capsule, and the splenium of the corpus callosum, whereas common environment contributed most variance to the right posterior limb of the internal capsule (Figure 4).
Discussion
In this paper, we outline the aims and protocol for a national study of twins that integrates self-report, psychophysiological, autonomic, and brain imaging measures. Our focus is on establishing heritability across measures in the same twin sample, and using these measures to establish endophenotypes for risk for poor emotional health versus what makes us resilient. The first phase of results reported here evaluated heritability in the brain imaging data.
The study is known as the ‘TWIN-E’ project. Participants are being recruited nationally in collaboration with the Australian Twin Registry. Thus, study results should be widely generalisable. This study will identify endophenotypes for emotional health by combining measures of self-report, functional status, genetics, cognition, psychophysiology, and brain imaging. The innovation in design is the use of standardized testing protocols to achieve this breadth of measures in the one sample.
Our first analyses of heritability used the Holzinger's heritability equation. We evaluated three measures of grey matter and one of white matter. Across grey matter measures (volume, cortical thickness, and surface area), we found common patterns of heritability for medial prefrontal and limbic regions, but distinct patterns for other regions of the cortex. For these measures, contributions to genetic variance were strong for the medial prefrontal cortex, both orbital and caudal anterior cingulate components. Unique environment made a contribution to other areas of the cortex for each of the three grey matter measures, especially the frontal pole for each. These estimates were similar to or higher than previously reported heritability estimates for volume (Winkler et al., Reference Winkler, Kochunov, Blangero, Almasy, Zilles, Fox, Duggirala and Glahn2010), thickness (Kremen et al., Reference Kremen, Prom-Wormley, Panizzon, Eyler, Fischl, Neale, Franz, Lyons, Pacheco, Perry, Stevens, Schmitt, Grant, Seidman, Thermenos, Tsuang, Eisen, Dale and Fennema-Notestine2010; Lenroot et al., Reference Lenroot, Schmitt, Ordaz, Wallace, Neale, Lerch, Kendler, Evans and Giedd2009; Schmitt et al., Reference Schmitt, Lenroot, Wallace, Ordaz, Taylor, Kabani, Greenstein, Lerch, Kendler, Neale and Giedd2008; Winkler et al., Reference Winkler, Kochunov, Blangero, Almasy, Zilles, Fox, Duggirala and Glahn2010) and surface area (Winkler et al., Reference Winkler, Kochunov, Blangero, Almasy, Zilles, Fox, Duggirala and Glahn2010). These previous studies reported on their completed (and larger) samples, so the correspondence in values speaks to the generalisability of the current sample, and the capacity for replication in the new phase of TWIN-E. The medial prefrontal region has consistently been implicated in emotional functions and their regulation in non-twin studies. In this study, we plan to delineate these functional associations in the twin sample, using cross-twin, cross-trait analyses for the medial prefrontal region and emotion regulation (and other hypothesized brain regions as identified below). We will also contribute new evidence for the genetic variants that impact the medial prefrontal cortex and its function, as well as how these variants interact with environmental factors such as early life trauma.
Another region of the cortex showing a strong contribution to genetic variance was the parietal cortex. The strength of contribution differed across grey matter measures according to the specific area of the parietal cortex. Grey matter volume and surface area contributed most strongly to genetic variance in the right superior parietal region, and cortical thickness to the left inferior parietal region. These findings build on previous twin findings that report genetic contributions to these parietal areas, but suggest the contribution to heritability may be higher for each of these three measures (Kremen et al., Reference Kremen, Prom-Wormley, Panizzon, Eyler, Fischl, Neale, Franz, Lyons, Pacheco, Perry, Stevens, Schmitt, Grant, Seidman, Thermenos, Tsuang, Eisen, Dale and Fennema-Notestine2010; Lenroot et al., Reference Lenroot, Schmitt, Ordaz, Wallace, Neale, Lerch, Kendler, Evans and Giedd2009; Panizzon et al., Reference Panizzon, Fennema-Notestine, Eyler, Jernigan, Prom-Wormley, Neale, Jacobson, Lyons, Grant, Franz, Xian, Tsuang, Fischl, Seidman, Dale and Kremen2009; Schmitt et al., Reference Schmitt, Lenroot, Wallace, Ordaz, Taylor, Kabani, Greenstein, Lerch, Kendler, Neale and Giedd2008; Winkler et al., Reference Winkler, Kochunov, Blangero, Almasy, Zilles, Fox, Duggirala and Glahn2010; Wright et al., Reference Wright, Sham, Murray, Weinberger and Bullmore2002). This issue needs further investigation with other heritability analysis methods in the next phase of our study. Both regions of the parietal cortex have been implicated in somatic aspects of emotion processing in previous correlation studies, and in integrating sensory input about emotion cues.
Strong genetic contributions were also observed for the right superior temporal cortex, especially for cortical thickness, but also for grey matter volume and surface area. These contributions were consistent with those observed in previous studies (Lenroot et al., Reference Lenroot, Schmitt, Ordaz, Wallace, Neale, Lerch, Kendler, Evans and Giedd2009; Schmitt et al., Reference Schmitt, Lenroot, Wallace, Ordaz, Taylor, Kabani, Greenstein, Lerch, Kendler, Neale and Giedd2008; Winkler et al., Reference Winkler, Kochunov, Blangero, Almasy, Zilles, Fox, Duggirala and Glahn2010). Previous correlation studies have implicated the superior temporal cortex in encoding significant stimuli, including the sensory features of emotion stimuli such as facial expressions.
For limbic regions implicated in emotion processing, there was a small-to-moderate contribution to genetic variance in the subcortical regions for grey matter volume. Specifically, small heritability values (<40%) were found for the right hippocampus and thalamus, and left amygdala, hippocampus, and caudate, but moderate values (40–60%) were found for the right amygdala and left thalamus. Our estimates for heritability were lower than those previously reported for the amygdala (e.g., 55–71% for right amygdala in Hulshoff et al., 2006; Kremen et al., Reference Kremen, Prom-Wormley, Panizzon, Eyler, Fischl, Neale, Franz, Lyons, Pacheco, Perry, Stevens, Schmitt, Grant, Seidman, Thermenos, Tsuang, Eisen, Dale and Fennema-Notestine2010; and Wright et al., 2002, vs. 48% reported here) and for the hippocampus (e.g., 64–71% for right hippocampus in Kremen et al., Reference Kremen, Prom-Wormley, Panizzon, Eyler, Fischl, Neale, Franz, Lyons, Pacheco, Perry, Stevens, Schmitt, Grant, Seidman, Thermenos, Tsuang, Eisen, Dale and Fennema-Notestine2010, and Wright et al., 2002, vs. 34% reported here), but higher for others such as the thalamus (e.g., 0% in Wright et al., Reference Wright, Sham, Murray, Weinberger and Bullmore2002 vs. 58% for left thalamus reported here). Notable differences in sample characteristics are likely the reason for such discrepancies. The current study was based on 142 male and female twins, aged 18–61 years. The study by Kremen et al. was based on a much larger sample (N = 404), but within a restricted group of 51–59 year-old males; whereas Wright et al. reported on a much smaller sample (N = 40) but had a similar age/gender distribution to the current study. Our analyses in subsequent phases include confirming heritability estimates in the complete sample, and within specific age groups, which will help identify the most consistent range for heritability or environmental contribution in the limbic regions in a larger sample. In the TWIN-E study, we will also examine heritability in the functional activation and connectivity of limbic circuitry during emotional tasks, as convergent evidence for structural measures.
Together, the measures of grey matter suggest that there are common aspects to which genetic factors contribute. Overlying those common aspects, there are specific distinctive components of these measures that are heritable. Grey matter volume and surface area showed the most similar pattern of findings, consistent with the correlations that have been observed between these measures (Winkler et al., Reference Winkler, Kochunov, Blangero, Almasy, Zilles, Fox, Duggirala and Glahn2010).
For the white matter measures from DTI, our findings suggest that there is a strong contribution of heritability for a number of tracts, including several that connect to the limbic system. There is only one other study to date that has reported heritability estimates for specific tracts in adults (Kochunov et al., Reference Kochunov, Glahn, Lancaster, Winkler, Smith, Thompson, Almasy, Duggirala, Fox and Blangero2010); the others only report variability across the brain (Chiang et al., Reference Chiang, McMahon, de Zubicaray, Martin, Hickie, Toga, Wright and Thompson2011) or within children (Brouwer et al., Reference Brouwer, Mandl, Peper, van Baal, Kahn, Boomsma and Hulshoff Pol2010). The pattern of moderate heritability reported here is similar to previous estimates for the superior fronto-occipital fasciculus (frontal-parietal-occipital connections), superior longitudinal fasciculus (frontal-temporal-occipital connections), external capsule (frontal-temporal-occipital connections), and genu of the corpus callosum (cerebral hemisphere connections) (Kochunov et al., Reference Kochunov, Glahn, Lancaster, Winkler, Smith, Thompson, Almasy, Duggirala, Fox and Blangero2010). We also reported moderate-to-strong heritability for the cingulum (cingulate gyrus-hippocampal connections), whereas Kochunov et al. reported only small effects. The study of Kochunov et al. was based on a similar sample distribution to the current study (19–85 years), but in 467 participants from 49 families. We reported strong heritable effects for other regions not reported by Kochunov et al., including tracts related to the limbic system (e.g., the uncinate fasciculus and fornix/stria terminalis) and in the brainstem (e.g., superior cerebellar peduncle, inferior cerebellar peduncle, and medial lemniscus). It would be important to replicate these findings in the complete sample, including teasing out the generalizability in relation to ethnicity, age, and sex differences.
These first results highlight that there is a genetic contribution accounting for variance in both grey and white matter. Results from the later phases will further identify the specific genetic and environmental contributions to each aspect of grey matter — volume, thickness and surface area. Because cortical thickness and surface area are both functions of volume (Panizzon et al., Reference Panizzon, Fennema-Notestine, Eyler, Jernigan, Prom-Wormley, Neale, Jacobson, Lyons, Grant, Franz, Xian, Tsuang, Fischl, Seidman, Dale and Kremen2009), volumetric estimates may not, by themselves, discriminate between genetic and environmentally independent traits of surface area and the correlated traits of cortical thickness (Winkler, et al., 2010). Having all three measures in the same sample allows us to fractionate them into genetically informative units before their selection as endophenotypes (Panizzon, et al., 2009). Having white matter measures from the same twins allows further fractionation, and identification of whether specific genetic polymorphisms are linked to grey matter on the one hand, and to white matter on the other.
In the next phase of TWIN-E and in future research, limitations of these initial analyses need to be addressed. These include the use of more sophisticated heritability estimation. We note that some estimates using the Holzinger method are greater than 1.0. This could be due to the interaction of gene–environment effects or to the small sample size (Stromswold, Reference Stromswold2001). This approach is also limited because we cannot specify or compare model parameters; these include taking into account differences in variance, or the comparison of ACE to ADE (A additive genetic, D dominant genetic, and E unique environment) or AE models. For future analyses, we plan to confirm these heritability estimates in the total sample, applying the univariate twin SEM models as described above. We also plan to delineate the behavioral function of each relevant brain region using cross-twin, cross-trait analyses, thereby building on the evidence from non-twin association studies.
The results provide the first outcomes from the TWIN-E study, and indicate it is a generalizable sample that will build on previous findings. It provides the first step towards linking brain imaging data with measures of self-report, functional status, side effects, genomics, cognition, and psychophysiology, to establish endophenotypes for emotional health and risk for mental illness.
Acknowledgments
This project is supported by an Australian Research Council (ARC)-Linkage Grant (LP0883621), with Brain Resource Ltd as industry partner. The awarded study proposal was entitled ‘Gene-brain pathways in emotional brain stability and instability’ (full title), or ‘The Emotional Wellbeing Project’ (short form). JMG held an Australian Postdoctoral Linkage Fellowship (APDI) linked to this grant. The Brain Resource Ltd. (BR) was the industry partner on the ARC Linkage Grant that funded this study, but had no further role in design or implementation of the project. BR also provided in-kind support for Phase III of the study.
The chief investigators listed on this project include Professor Leanne M. Williams (University of Sydney), Professor Peter R. Schofield (Neuroscience Research Australia and University of New South Wales), Professor C. Richard Clark (Flinders University and Brain Health Clinics, South Australia), Associate Professor Anthony Harris (University of Sydney), and Dr Justine M. Gatt (University of Sydney). Dr Gatt is also the APDI (Australian Post-Doctoral Industry) Research Fellow linked to this grant, and the TWIN-E Project Coordinator. Dr Mayuresh Korgaonkar has made recent contributions to implementing the planned analyses as a collaborator. Ms Karen Oakley and Mr Kaushik Ram are two PhD students currently linked to the project. We would also like to acknowledge the assistance of the Sydney site research associates, Ms Hope Michaelson, Ms Sarsha Yap, and Ms Alicia Wilcox (past), and the Adelaide site research associates, Ms Melinda Stanners and Ms Vikki Wise.
This research was facilitated through access to the Australian Twin Registry, a national resource supported by a National Health & Medical Research Council (NHMRC) Enabling Grant (628911). DNA was prepared by Genetic Repositories Australia, supported by an NHMRC Enabling Facility (401184).
Conflicts of Interest
The Brain Resource Ltd (BR) was the industry partner on the ARC-linkage grant which funded this study, but had no further role in design or implementation of the project. JMG holds stock options in BR, has received fees from BR for consultancies unrelated to this study, and was a postdoctoral fellow on the ARC Linkage Grant which funded this project. CRC has a small shareholding (less than 5% of issued capital) in BR and some stock options in Brain Resource Ltd. LMW is a stock-holder in BR, has stock options in BR, and has received fees from BR for consultancies unrelated to this study. HM and SY are research assistants on the ARC Linkage Grant which funded this project. MK, PRS, AH, KO, KR, MS, and VS report no potential conflicts of interest.


