


The Scarr–Rowe effect is an interaction between familial socioeconomic status (SES) and the additive heritability of IQ; the nature of the interaction is such that the heritability of IQ is lower among those from lower SES households and higher among those from higher SES ones. This interaction might result from variation in the quality of childhood environments, for which household SES serves as a proxy measure, leading to variability in the extent to which individuals phenotypically realize their full genotypic potential for IQ (Bronfenbrenner & Ceci, Reference Bronfenbrenner and Ceci1994). Scarr-Salapatek (Reference Scarr-Salapatek1971) first found evidence of the effect, a finding which Rowe et al. (Reference Rowe, Jacobson and van den Oord1999) subsequently replicated, hence the finding has come to be known as the Scarr–Rowe interaction (Turkheimer et al., Reference Turkheimer, Harden, D’Onofrio, Gottesman, McCartney and Weinberg2009) or effect. In a subsequent meta-analysis, Tucker-Drobb and Bates (Reference Tucker-Drob and Bates2015) identified a difference between the US, where they found the effect to be robustly present, and certain non-US countries, where they found the effect to be absent or even reversed (lower parental SES going with higher heritability). The aggregate interaction term is of small magnitude (for the USA, ρ = .07, SE = .03, p = .003); nonetheless, individual studies have identified larger effects, most notably that of Turkheimer et al. (Reference Turkheimer, Haley, Waldron, D’Onofrio and Gottesman2003), which found that the heritability of IQ in those with the lowest SES dropped to near zero.
A recent study that used a very large sample of the US population (Figlio et al., Reference Figlio, Freese, Karbownik and Roth2017) found no evidence for the effect in a sample of twins and siblings born in the late 1990s and early 2000s (it should be noted that data on the zygosity of their twin sample were unavailable, so some caution should be exercised in interpreting some of their analyses). This result is consistent with the possibility that the Scarr–Rowe effect is diminishing in strength over time in the USA, perhaps due to improving bioecological conditions for low-SES groups in the USA (for evidence of such improvement, see Rindermann, Reference Rindermann2018).
The Scarr–Rowe effect is typically measured as a positively signed two-way interaction between IQ additive heritability (A) and SES, which is estimated net of the main effects of A, C (shared environment), E (nonshared environment), and SES. These behavior-genetic variance components and interaction terms are usually estimated using a twin-study design (e.g. Tucker-Drob & Bates, Reference Tucker-Drob and Bates2015). But sibling and adoption studies can also be used to derive such estimates (Figlio et al. Reference Figlio, Freese, Karbownik and Roth2017; Tucker-Drob & Bates, Reference Tucker-Drob and Bates2015). Recent advances in genomewide association studies (GWASs) have made it possible to estimate heritability using the combined effects of multiple variants sampled from large numbers of individuals, a subset of whom will be genetically (and phenotypically) similar with respect to these variants (and associated traits) by chance (a situation that the Genome Wide Trait Analysis method usefully exploits). Tahmasbi et al. (Reference Tahmasbi, Evans, Turkheimer and Keller2017) used this method to estimate the magnitude of the Scarr–Rowe effect in the UK BioBank sample; they found that the effect was reversed relative to what is typically found in the USA, which is consistent with the overall direction of the effect outside of the USA that Tucker-Drob and Bates (Reference Tucker-Drob and Bates2015) report. A more recent study employed polygenic scores (PGSs) in testing for the effect in a large genotyped US sample (the Wisconsin Longitudinal Study) born in the late 1930s and early 1940s (Woodley of Menie et al., Reference Woodley of Menie, Pallesen and Sarraf2018). A PGS is a normally distributed genetic index of a trait of interest, comprised of variants that are predictive of the phenotype of interest, weighted by their regression beta values. The correlation between a PGS and its associated trait yields a highly imperfect but nevertheless hypothetically quite direct estimate of the heritability of the trait, with the best PGSs currently able to account for approximately 10% of the variance in an out-of-sample measure of general intelligence or IQ (Lee et al., Reference Lee, Wedow, Okbay, Kong, Maghzian, Zacher, Nguyen-Viet, Bowers, Sidorenko, Karlsson Linnér, Fontana, Kundu, Lee, Li, Li, Royer, Timshel, Walters, Willoughby and Cesarini2018).
In the study of Woodley of Menie et al. (Reference Woodley of Menie, Pallesen and Sarraf2018), two methods were used to estimate the interaction between a cognitive PGS (designated EA3 in Lee et al., Reference Lee, Wedow, Okbay, Kong, Maghzian, Zacher, Nguyen-Viet, Bowers, Sidorenko, Karlsson Linnér, Fontana, Kundu, Lee, Li, Li, Royer, Timshel, Walters, Willoughby and Cesarini2018) and parental SES. First, the Continuous Parameter Estimation Model was used to estimate the interaction between the two directly, without estimating the main effects (β = 0.08, SE = .01, p = 4.71 × 10⁻¹⁰). Second, the effect was also detected using a conventional two-way interaction model in which the interaction between the two was estimated hierarchically, after first estimating the main effects of EA3 and (log-transformed) parental SES on IQ (β = 0.02, SE = .01, p one-tailed = .045Footnote 1 ). The positive signs on these coefficients indicate that as the level of parental SES increases, so too does the covariance between EA3 and IQ. In turn, this increase in covariance can be said to capture the increased expressivity of EA3 on IQ as a function of rising parental SES.
In the current study, we will attempt to replicate the association using a PGS for educational attainment (EA) in another large European–American sample, specifically the Health and Retirement Study (HRS).
Methods
Sample
The HRS, organized by the University of Michigan, is a longitudinal panel study surveying a large and representative sample of the US population (around 20,000 individuals) born in the decades ranging from the 1890s to the 1950s. It tracks a large variety of phenotypes and also genotypes related to health. More information on this study, in addition to guidelines on how to obtain permission to access the study data, can be found at https://hrs.isr.umich.edu/about.
Educational Attainment 3
In HRS, participants were genotyped with respect to a large variety of physiological, behavioral, and cognitive phenotypes, with the DNA having been collected between 2006 and 2012. We employed the educational attainment 3, or EA3 PGS, which derived originally from the meta-analysis of Lee et al. (Reference Lee, Wedow, Okbay, Kong, Maghzian, Zacher, Nguyen-Viet, Bowers, Sidorenko, Karlsson Linnér, Fontana, Kundu, Lee, Li, Li, Royer, Timshel, Walters, Willoughby and Cesarini2018) and was trained on an EA measure that used the 1997 ISCED UNEASCO seven-category classification scheme, converted into US years-of-schooling equivalents. The EA3 PGS is associated with the phenotype of general intelligence or ‘IQ’. Consistent with this, Lee et al. (Reference Lee, Wedow, Okbay, Kong, Maghzian, Zacher, Nguyen-Viet, Bowers, Sidorenko, Karlsson Linnér, Fontana, Kundu, Lee, Li, Li, Royer, Timshel, Walters, Willoughby and Cesarini2018) conducted several out-of-sample validations, finding in one case that EA3 accounted for nearly 10% of the variance in performance on an IQ test (the Henmon–Nelson test of cognitive ability from the Wisconsin Longitudinal Study). Ware et al. (Reference Ware, Gard, Schmitz and Faul2021) describe the additional steps that were taken in generating an HRS, sample-specific version of EA3 as follows:
The educational attainment PGSs [EA3] were created using results from a 2018 study by the Social Science Genetic Association Consortium (SSGAC) [Lee et al., Reference Lee, Wedow, Okbay, Kong, Maghzian, Zacher, Nguyen-Viet, Bowers, Sidorenko, Karlsson Linnér, Fontana, Kundu, Lee, Li, Li, Royer, Timshel, Walters, Willoughby and Cesarini2018]. The meta-analysis included 405,073 individuals in the combined discovery and replication sample and 726,808 individuals that did not contribute to the analyses of the previous study and were used as replication in this study (total of 1,131,881 individuals). Genome-wide significant SNPs were identified in 1271 loci … Approximately 10.2 million SNPs were included in the analyses, with all cohorts utilizing SNPs imputed to the 1000 genomes reference panel (1000G). The original GWAS included the HRS. To compute the PGSs for HRS respondents, the SSGAC provided SNP weights with the HRS … results removed (due to data use agreements). Study-specific GWASs controlled for the first ten principal components of the genotypic data, a third-order polynomial in age, an indicator for being female, interactions between age and female, and study-specific controls, including dummy variables for major events such as wars or policy changes that may have affected access to education in their specific sample. The European ancestry PGSs contains 1,274,056 SNPs that overlapped between the HRS genetic database and the GWAS meta-analysis… The posted PGSs have been standardized within ethnicity to a standard normal curve (mean = 0, standard deviation = 1). (p. 84)
The HRS-specific EA3 release is accompanied by participant information on 10 ancestral principal components (PCs), which can be used as an additional control for population stratification in regression analysis. To further reduce confounding for population stratification, we restricted the analysis to those participants identified as being of European ancestry, which was the sample used to train the EA3 PGS in the HRS dataset (Ware et al., Reference Ware, Gard, Schmitz and Faul2021).
IQ Measure
The HRS contains many items measuring cognitive ability, spanning a variety of domains and administered to various waves of the study. The items include measures of self-rated memory, memory compared to 2 years previously, immediate word recall, delayed word recall, knowing the date, knowing the day of the week, counting backwards from 20, counting backwards from 86, word recognition tests, dementia tests, Serial 7s (a working memory measure), and vocabulary. Scores on these measures were standardized and then concatenated across waves into a unit-weighted general intelligence or IQ composite score, which was available for a total of 17,226 participants (simply the average of all cognitive total variables). For full details of the cognitive ability measures developed for and used in the HRS, see Fisher et al. (Reference Fisher, Hassan, Faul, Rodgers and Weir2017).
Parental EA
Parental EA was selected as a proxy measure of parental SES. There are two reasons for this variable choice. First, although there are broader measures of parental SES in HRS, these were available for far fewer individuals, reducing the prospective power of our analyses. Second, it has been noted that composites of parental SES, combining measures of household income and EA, might mask the true effects of specific SES variance components on offspring cognitive characteristics in different social contexts (e.g. wealthier vs. poorer nations). Consistent with this possibility, O’Connell (Reference O’Connell2019) found that when considered separately, parental EA has a larger effect on offspring academic performance than household income, especially in wealthier Program for International Student Assessment nations, suggesting that the former may be the more important parental SES component for the purposes of detecting the Scarr–Rowe effect. In light of this result, O’Connell proposes ‘eschewing the unitary concept of SES’ (p. 41). Other studies of the Scarr–Rowe effect have also utilized parental EA in lieu of parental SES (e.g. Spengler et al., Reference Spengler, Gottschling, Hahn, Tucker-Drob, Harzer and Spinath2018).
The total sample size for the HRS across all variables is 9546. Individuals with missing values for one or more of the variables were excluded, except in the case of parental EA, where if only one parent reported a value, that value is used in lieu of an average of both parents.
Measurement Model
We employ a model that incorporates two-way interactions to estimate the Scarr–Rowe effect in HRS. These analyses were based on the one from Woodley of Menie et al. (Reference Woodley of Menie, Pallesen and Sarraf2018) in which the interaction between EA3 and parental SES was used to predict the IQ measure after hierarchically controlling for the main effects of EA3 and parental SES. In this analysis, we also included additional controls for population stratification. These were implemented by first residualizing both EA3 and parental EA for 10 PCs, each corresponding to a different biogeographic ancestry component. Thus, the main effects were estimated independently of the potential confounding effects of population stratification. In estimating the interaction terms, first EA3 was interacted with each PC, then the parental EA measure was interacted with each PC. Finally, the Scarr–Rowe effect was estimated by interacting EA3 with parental EA. These analyses were conducted on the combined sample and for each sex independently. As in Woodley of Menie et al. (Reference Woodley of Menie, Pallesen and Sarraf2018), a positively signed interaction between EA3 and parental EA as a predictor of IQ indicates the presence of the Scarr–Rowe effect, as the association between EA3 and IQ can be said to increase with rising parental EA. This can be interpreted as an increase in the expressivity of EA3 on cognitive ability with rising parental EA, which is consistent with the expectation that heritability rises with SES.
Results
Correlation Matrix
Table 1 reports the correlations for all variables employed in this analysis of the Scarr–Rowe effect for the combined-sex cohort.
Table 1. Correlation matrix for the HRS combined-sex cohort. The EA3 PGS is controlled for population stratification (N = 9546)

Note: EA3, polygenic score for educational attainment; EA, educational attainment.
p < .001 in all cases.
Two-Way Interaction Model
Two-way interaction models were run as hierarchical general linear models (type 1 sum of squares) in order to see whether the effect could be detected. The results of these analyses are presented in Table 2.
Table 2. Two-way interaction models predicting IQ, using EA3 and parental EA (controlled for 10 PCs), interactions between principal components and EA3, interactions between principal components and parental EA, and the interaction between EA3 and parental EA
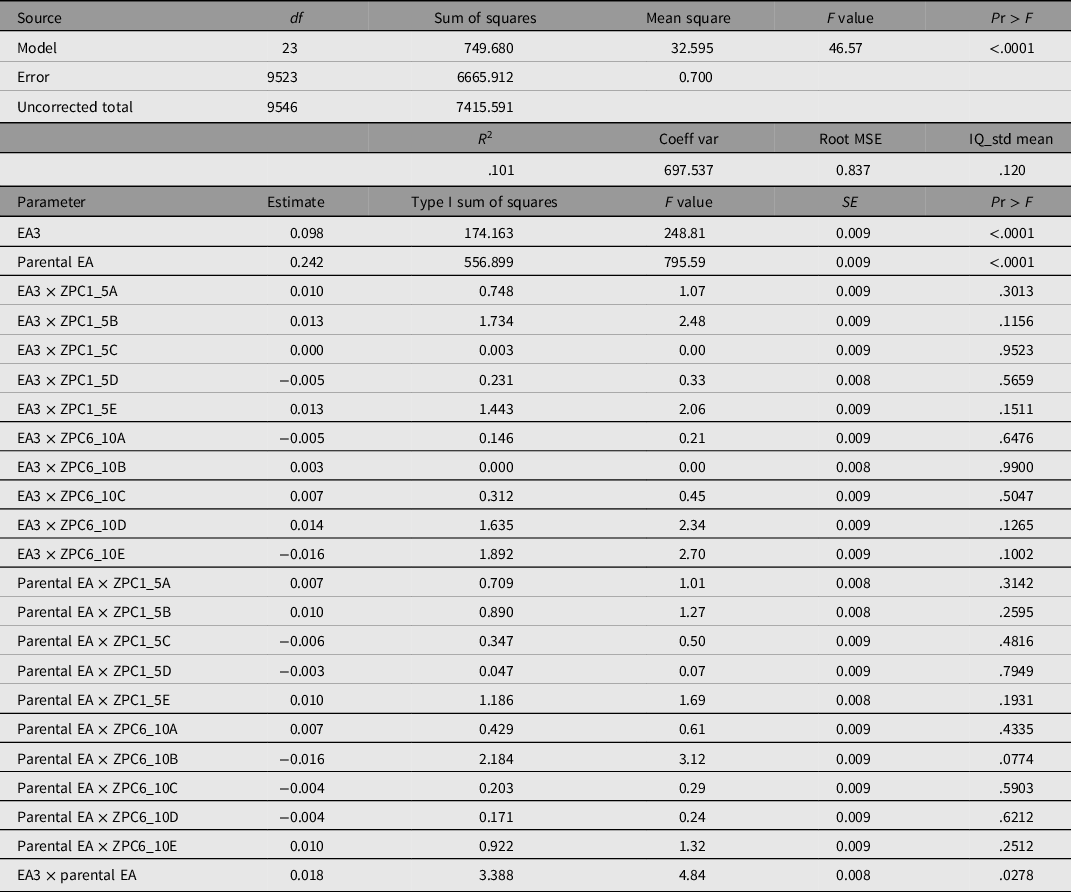
Note: EA3, polygenic score for educational attainment; EA, educational attainment; coeff var, coefficient of variation; root MSE, root-mean-square error.
Table 3 presents the correlation matrices for males and females separately.
Table 3. Correlation matrix for the HRS male (above diagonal) and female (below diagonal) participants. The EA3 scores are controlled for population stratification (N = 5384 for males and 4162 for females)

Note: EA3, polygenic score for educational attainment.
p < .001 in all cases.
The two-way interaction models broken out by sex are presented in Tables 4 and 5.
Table 4. Hierarchical general linear model examining the main effects and interactions of residualized EA3 and residualized parental EA on standardized IQ in females. The model controls for population stratification effects

Note: EA3, polygenic score for educational attainment; EA, educational attainment; coeff var, coefficient of variation; root MSE, root-mean-square error.
Table 5. Hierarchical general linear model examining the main effects and interactions of residualized EA3 and residualized parental EA on standardized IQ in males. The model controls for a population stratification effects

Note: EA3, polygenic score for educational attainment; EA, educational attainment; coeff var, coefficient of variation; root MSE, root-mean-square error.
There is no statistically significant difference in the B values for females and males (z =1.01, p = .313).
Discussion
A statistically significant Scarr–Rowe effect is present among HRS participants, controlled for population stratification, both at the level of the main effects of EA3 and parental EA on IQ and at the level of the interaction terms. The effect is furthermore statistically significant in the female sample, but not in the male sample; however, there is no statistically significant difference between the effect magnitudes of the two samples. The results of these analyses broadly replicate those found in the WLS, given that the effect is present as a two-way interaction between EA3 and parental EA (as a parental SES proxy) on IQ, net of main effects (Woodley of Menie et al., Reference Woodley of Menie, Pallesen and Sarraf2018). Moreover, the mean birth decade for these participants (the 1930s) is matched to that of the WLS participants used in the prior analysis (who were mostly born in the late 1930s). It would be interesting to see whether or not the effect is present using PGSs among younger cohorts. The findings of Figlio et al. (Reference Figlio, Freese, Karbownik and Roth2017) suggest that, at least in the USA, the effect may have decayed, perhaps reflecting greater equity in early-life environments (Rindermann, Reference Rindermann2018). Replicating the absence of the effect in younger cohorts using PGSs would increase the robustness of this conclusion.
The use of PGS and other genetic data in detecting the Scarr–Rowe effect significantly increases the scope of research into this effect, as the availability of twins for the purposes of behavior-genetic research is no longer a limiting factor, either in terms of prospective sample power or variety (i.e. many twin-free samples can now be genotyped and employed in this research).
Acknowledgment
The HRS (Health and Retirement Study) is sponsored by the National Institute on Aging (NIA U01AG009740) and is conducted by the University of Michigan.


