


Introduction
The study of change is profoundly important to psychology in general, to all clinical interventions, and thus, to cognitive behavioural research and practice. The changes studied may, for instance, be of changes in behaviour, emotion and cognition as they develop over the lifespan; change may be due to the operation of psychopathological processes or be the positive (or negative) outcome of therapy. Change may occur for good or ill as a consequence of social influences; it may signal the enhancement of or deterioration in the performance of individuals, groups and organizations; and involve changes in performance due to learning and instruction. In all research, observed changes capture the myriad outcomes of observation and experimentation across all domains of psychological investigation. In all cases the detection of change requires repeated measurement of one or more dependent variables (a minimum of two measurement points per variable) from a particular case. The cases studied are typically an individual, but may be larger entities, such as a family, a social group, a school class, a sports team, a work group, a company or an organization, or other coherent bodies (Valsiner, Reference Valsiner1986).
For the past 70+ years, the study of change in psychology has been dominated by an approach to science that the German philosopher Windelband termed ‘nomothetic’ (Lamiell, Reference Lamiell1998; Windelband, Reference Windelband1894/1998); such an approach is concerned with establishing the general laws of the science. The way that psychology has investigated change within this framework has involved the (quasi-random) allocation of participants to groups, with some treatment hypothesized to induce change applied to one or more groups while one or more separate groups do not experience the treatment and are control groups. Individuals’ data are aggregated into measures of central tendency such as means, and the question becomes ‘Are mean differences between treatment and control groups sufficient to provide evidence of a treatment effect?’. Such a comparison does not, of course, provide direct evidence of change, only of difference. For that there needs to be measurement of the participants before (time 1, t 1) and after (time 2, t 2) treatment in the treatment group and a parallel set of measurements at t 1 and t 2 for the control group. The question then becomes ‘Is the evidence of change from time 1 to time 2 in the mean scores of the treatment group sufficiently different from changes in mean scores in the control group across time to provide evidence of a treatment effect?’.
Of course, the interpretation of mean scores across time and between groups is complicated by variance at each measurement point. To detect the signal of a treatment effect from the noise of variance, researchers use statistical techniques developed by R.A. Fisher, termed the analysis of variance (ANOVA; Fisher, Reference Fisher1935) and subsequently extended by many other statisticians (Wright, Reference Wright2009). Such techniques yield a test statistic (F in the case of ANOVA) and a probability value for that statistic (p) under a null hypothesis (Ho) which is that there is no treatment effect and any observed mean differences are the result of sampling error (HoSampE). If p is small (conventionally <.05, a criterion value referred to as alpha; Hubbard, Reference Hubbard2004) then HoSampE can be rejected and the results taken as evidence of a treatment effect. Procedures combining group aggregate mean data and statistical tests that assume HoSampE are referred to as null hypothesis statistical tests (NHST), and results obtained when Ho is rejected are said to be statistically significant, often shortened just to significant. Because this categorization of results is based on a probability, it may be wrong. A Type 1 error is the rejection of Ho when it is true, or Ho may not be rejected when it is false, a Type 2 error. Statistical significance has no necessary implications for the clinical or practical significance of the findings and applies only at the aggregate not the individual level.
Psychologists began to use NHST in research in the mid-1930s and since the mid-1950s it has completely dominated research practice (Hubbard et al., Reference Hubbard, Parsa and Luthy1987). Clinical outcome research quickly followed, as documented by Bergin and Strupp (Reference Bergin and Strupp1970) and Kiesler (Reference Kiesler, Bergin and Garfield1971), and clinical researchers, including those investigating cognitive behaviour therapy (CBT), now almost universally regard the randomized control trial (RCT), invariably analysed by NHST, as the ‘gold standard’ research practice, clearly endorsed today in the chapters on clinical research methods in the authoritative handbooks edited by Barlow (Reference Barlow2014), Norcross et al. (Reference Norcross, VandenBos and Freedheim2016) and Wright and Hallquist (Reference Wright and Hallquist2020).
Despite this sustained commitment by psychology research, including clinical research, to NHST, criticisms have been persistently voiced (see Balluerka et al., Reference Balluerka, Gomez and Hidalgo2005; Nickerson, Reference Nickerson2000), many of these criticisms focusing on the misinterpretation of NHST, especially of p values and statistical significance, and the common violation of its assumptions (Cohen, Reference Cohen1990; Cohen, Reference Cohen1994; Colquhoun, Reference Colquhoun2014; Gigerenzer, Reference Gigerenzer2018; Lambdin, Reference Lambdin2012; Schneider, Reference Schneider2015). So persistent did this criticism become that both the American Psychological Association (APA) and the American Statistical Association (ASA) established expert groups to evaluate NHST. Their respective reports (ASA: Wasserstein and Lazar, Reference Wasserstein and Lazar2016; APA: Wilkinson and Task Force on Statistical Inference, Reference Wilkinson1999), while not suggesting the abandonment of NHST, made many recommendations for the improvement of research practices involving it, although there is not much evidence that these have resulted in extensive improvements in practice (Vacha-Haase et al., Reference Vacha-Haase, Nilsson, Reetz and Thompson2000).
There is an equivalent history of criticism of NHST within clinical research, articulated early by Bergin and Strupp (Reference Bergin and Strupp1972) when they noted that … statistical procedures … are held inappropriate … to research in the area of therapeutic change (p. 440). Dar et al. (Reference Dar, Serlin and Omer1994) reviewed 30 years of clinical research published in the Journal of Consulting and Clinical Psychology, research dominated by NHST, and documented persistent and extensive misinterpretation of the statistics. Fidler et al. (Reference Fidler, Cumming, Thomason, Panuzzo, Smith, Fyffe and Schmitt2005) duplicated this survey for research in the same journal from 1993 to 2001 and found that NHST-based research continued to dominate, and that misinterpretations and misapplications of statistical methods continued to be common. As, over time, it is the outcome of CBT that has become the predominant research question in clinical research, this history of misuse and misinterpretation of NHST is clearly of concern to researchers and practitioners of CBT.
A central reason why NHST-based research procedures are inappropriate to research into therapeutic change has to do with the central practice of between-subject averaging. This creates a ‘double standard’ (Valsiner, Reference Valsiner1986) where we profess to be concerned with understanding and helping the individual client, but in research, conceal individuals in group averages. Even when a statistically significant therapeutic change is detected at the level of the group means, it is impossible to know what the fate of any individual in the treatment group was, or what the response to treatment might be of any client subsequently given the treatment (Barker et al., Reference Barker, Pistrang and Elliot2016; Barlow et al., Reference Barlow, Hayes and Nelson1984; Kravitz et al., Reference Kravitz, Duan and Braslow2004; Kent and Hayward, Reference Kent and Hayward2007). This concern is not confined just to therapy-outcome research, but is a general issue across all research domains (Fisher et al., Reference Fisher, Medaglia and Jeronimus2018; Speelman and McGann, Reference Speelman and McGann2016).
This concern regarding group averaging has led to appeals that clinical research should become more idiographic (Barlow and Nock, Reference Barlow and Nock2009). The term idiographic was also coined by Windelband (Lamiell, Reference Lamiell1998; Windelband, Reference Windelband1894/1998) and since being introduced to psychology (along with nomothetic) by Gordon Allport in 1937, idiographic has come to mean the study of the individual over time (Danziger, Reference Danziger1990; Lamiell, Reference Lamiell1998), as distinct from the nomothetic investigation of general laws at the group/population level. As Barlow and Nock (Reference Barlow and Nock2009) noted, clinical science has profited extensively from the nomothetic research tradition, which has laid the foundation for evidence-based practice (Chambless and Hollon, Reference Chambless and Hollon1998, Reference Chambless, Hollon and Cooper2012; Spring, Reference Spring2007), and so they did not advocate the rejection of such research. Rather, they suggested that we might enrich these methodologies with a complementary focus on the individual (Barlow and Nock, Reference Barlow and Nock2009; p. 20).
Idiographic methods that might complement traditional NHST research include single-case research designs (Barlow et al., Reference Barlow and Nock2009; Blampied, Reference Blampied and Madden2013; Cooper et al., Reference Cooper, Heron and Heward2020) and mixed methods incorporating qualitative and quantitative research methods (Doyle et al., Reference Doyle, Brady and Bryne2009; Levitt et al., Reference Levitt, Bamberg, Creswell, Frost, Josselson and Suarez-Orozco2018; Morgan, Reference Morgan1998); however, these methods will not be considered further here. Rather, I will focus on a specific suggestion, made by Jacobson et al. (Reference Jacobson, Follette and Revenstorf1984; Jacobson and Truax, Reference Jacobson and Truax1991) for complementing the NHST-based findings of group outcome research with investigation of individuals’ reliable change (RC). The primary purpose of their writing was to introduce standard criteria for the determination of the clinical significance of change by any individual. However, having done so, they noted: It is nonsensical to speak of clinically significant treatment effects when no change has occurred (Jacobson et al., Reference Jacobson, Follette and Revenstorf1984; p. 343). Establishing RC is thus a pre-requisite for determining clinical significance; the measured change must reliably exceed that which might be due just to measurement error alone. Clinical significance remains an extremely important topic (Follette and Callaghan, Reference Follette and Callaghan2001; Ogles et al., Reference Ogles, Lunnen and Bonesteel2021), but it is RC I will focus on in this paper.
Reliable change – conceptual foundations and computational procedures
The presentation below is based on the work of Jacobson and colleagues, especially Jacobson and Truax (Reference Jacobson and Truax1991) that incorporated a formula correction supplied by Christensen and Mendoza (Reference Christensen and Mendoza1986). Their work is anchored in classical test theory (Maassen, Reference Maassen2000) and contains an explicit, but different, null hypothesis – the Ho that individual true score differences between t 1 and t 2 are zero and any observed difference is due only to measurement error (HoME). Jacobson and colleagues also made some further assumptions that underpinned their work. These include that the measure used to assess therapy effects was a valid measure of the attribute of interest, that the attribute of interest was actually targeted by the therapy being investigated, and that the measure was responsive, i.e. that it was sensitive to change. It is also assumed that the conditions under which the measurement is made are optimum for the purpose and that those who administer and score the test are highly competent to do so. These assumptions remain relevant to all subsequent applications of the idea of reliable change.
Reliable change – foundations in classical measurement theory
Classical measurement theory holds that any measurement can be separated into two components – the true score, plus an error component, so that:
 $$X = T\pm E$$
where X = the observed score, T = the true score, and E = error (Stigler, Reference Stigler1986). If change has occurred in an individual case over the measured time period in the domain captured by the dependent variable and within the limits of the sensitivity of the particular instrument, then the true score at t 1 will not be equal to the true score at t 2. However, given the variability and error intrinsic to psychological measurement it is possible that a difference between t 1 and t 2 scores may be observed in the absence of any actual change. How then can we determine how large an observed change needs to be to warrant a conclusion that change has truly occurred or decide that our observations are capturing only trivial variation? Enter the concept of RC and the reliable change index (RCI; Jacobson et al., Reference Jacobson, Follette and Revenstorf1984; Jacobson and Truax, Reference Jacobson and Truax1991).
Deriving RC/RCI depends on also knowing that the frequency distribution of error scores (i.e. where the magnitude of errors of over- and under-estimation is represented on the x-axis about a central value of zero and the frequency with which each error has occurred is plotted on the y-axis) is represented by the Gaussian distribution, once also known as the Normal Law of Error, and now known (thanks to Galton and Pearson) as the Normal distribution (Stigler, Reference Stigler1986). Importantly, errors of measurement are normally distributed even when the measures themselves are skewed and all the mathematical properties of the normal distribution apply to the error distribution (Stigler, Reference Stigler1986). The mean of the distribution (its peak) is zero, and it has a standard deviation (SD), which in the case of the error distribution of measurement errors is given a special name, the standard error of measurement (SE M), computed as:
 $$S{E_M} = {s_1}\surd 1-{r_{xx}},$$
where s 1 = the standard deviation of a control or pre-treatment group and r xx = the test–retest reliability of the measure.
The SE M is a measure of the precision of the measurement instrument and formula (2) tells us something that is intuitively reasonable, namely that variation in error of measurement is a function of two things: first, the intrinsic variability of the thing we are trying to measure, and second, the reliability of our measuring instrument. SE M increases as variability increases and reliability decreases, emphasizing the desirability of using highly reliable measures. From what we know about the normal distribution we also know that, for the error distribution, specified proportions of all the error frequencies will lie within specified values of the SE M about the mean (zero), such that, for example, 95% of all errors will lie within the range of ±1.96 SE M and only 5% lie beyond that range.
The standardized change score
Jacobson and colleagues (Jacobson et al., Reference Jacobson, Follette and Revenstorf1984; Jacobson and Truax, Reference Jacobson and Truax1991) drew on this basic knowledge in order to define RC, but to understand their definition first we have to understand the error distribution of difference scores. Recall, from above, that the basic way of identifying change (if it has occurred) is by a non-zero difference score, in this case a raw change (hence ‘C’) score, given by the subtraction of the ith case’s score at t 2 from t 1:
 $${C_i}_{\left( {raw} \right)} = {X_t}_1-{X_t}_2,$$
where C i (raw) is the raw change score for individual i, and X is their score measured at two time points, t 1 and t 2. As each individual measurement contains both a true score and an error score, any raw change score will comprise the true change score ± an error score (as per equation (1) above), and as the error score is a compound of the errors made at each measurement it will be larger than for the component individual scores. The frequency distribution of difference score errors is also a normal distribution with mean = zero but with an adjusted (larger) standard error, called S Diff; where:
 $${S_{Diff}} = \surd 2{\left( {S{E_M}} \right)^2}.$$
Because all measurement contains error we cannot know what the true absolute scores are or the true change score actually is but we can use what we know about the distribution of errors, and specifically, S Diff, to decide what a reliable change is for any particular measurement, so long as we know SE M and S Diff. The first step for Jacobson and Truax (Reference Jacobson and Truax1991) in defining RC was to standardize C i , by dividing the difference score by S Diff :
 $${C_i}_{\left( {Standardized} \right)} = {C_i}/{S_{Diff}}.$$
This converts the raw change score to standard deviation (specifically S Diff) units, just as a z-score is the difference between an individual’s score and the mean standardized by the SD.
Interpreting the standardized change score to yield reliable change
The definition of RC using C i (Standardized) draws on exactly the same logic as that used in NHST, except that HoME is used rather than HoSampE. We assume HoME to be true, and, due to measurement error alone, 95% of all standardized scores will lie within ±1S Diff. So if C i (Standardized) > 1.96 or < –1.96 (i.e. it lies at least 1.96 S Diff units either side of the mean) the probability of an error of measurement this large is p ≤ .05, because only 5% of the frequency distribution of errors lies at this extreme; an error of measurement alone sufficient to produce such a value of C i (Standardized) is regarded as unlikely (although not impossible) and HoME (the proposition that there is no true change) is rejected (but note that Type 1 and Type 2 errors can still occur). This means that the difference observed probably contains both true change plus measurement error; this is reliable change (i.e. change that we can defensibly claim to be larger than that due to measurement error alone). As Jacobson and Truax (Reference Jacobson and Truax1991) put it: RC tells us whether change reflects more than the fluctuations of an imprecise measuring instrument (p. 14). Other standard deviation units can, of course, be used as the criterion to reject Ho, so that C i (Standardized) > 1.645 or < –1.645 gives p < .1, and > 2.58 or < –2.58 gives p < .01, etc., but RC(.05) is the conventional criterion (Jacobson and Truax, Reference Jacobson and Truax1991; note the use of the subscript to specify the probability value, sometimes also given as RC(95%)). Because ±1.96 is regarded as a very stringent criterion for RC some investigators, including neuropsychologists, often use ±1.645 (Duff, Reference Duff2012).
Thus, for every individual case that we have measured across two or more times in any study we can determine for any pair of measurements if the raw change displayed is large enough to be considered reliable (given that we have the SE M of our measure). Recall, from above, however, that C i (Standardized) may be positive or negative, depending on the values of the raw scores at t 1 and t 2; specifically, if X 1 < X 2, C i (Standardized) will be negative. In computing RC it is important to retain this information, as it is critical to interpreting RC.
In almost all instances where we measure change we can determine a priori the direction of change that is expected or predicted as consistent with theory, normal, beneficial, desirable, or otherwise. For instance, if we are measuring physical growth over time we expect raw scores to increase; if we are measuring psychopathology before and after psychotherapy and our measure of psychopathology gives lower scores when levels of psychological distress are reduced we expect effective psychotherapy to be accompanied by reduced raw scores. So, the directionality of change has meaning, and RC needs to be interpreted in that light. At minimum we can classify RC into three categories: RC that is beneficial is termed Improved (RC+); RC that is non-beneficial is termed Deteriorated (RC–); and where change is insufficient to be classified as reliable, that case is termed Indeterminate (RC0; Jacobson et al., Reference Jacobson, Follette and Revenstorf1984; Wise, Reference Wise2004). Note that here the sign on the RC indicates the positive/beneficial or negative/deteriorated direction of change, not the arithmetic sign of the change score, so that an individual may show RC+ on two measures of outcome even though one measured improvement in increased scores and the other via decreasing scores. Finer graduations in outcome classification are possible such as the categories of Improved, Remitted, Recovered, each requiring a more stringent RC criterion to be met, as shown in Wise (Reference Wise2004; table 1, p. 56).
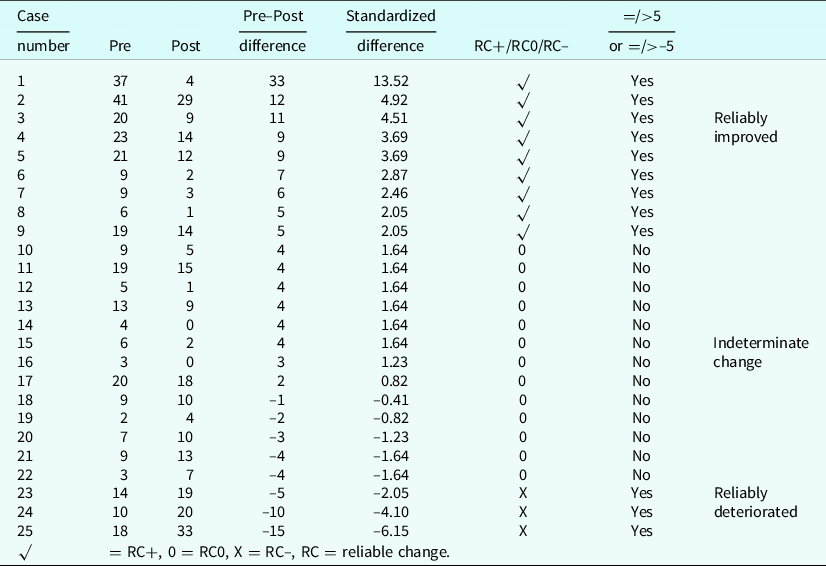
Table 1. Raw pre–post scores from 25 cases showing the raw change score, the raw difference score, the standardized difference (change) score, the classification of the change (compared against ±1.96) as reliable improvement (RC+), indeterminate change (RC0), and reliable deterioration (RC–), and the parallel classification using a reliable change index = 5
The reliable change index – an alternative classification scheme
Following Jacobson and colleagues, RC has been defined above in terms of a standardized change score that is compared against a selected criterion (e.g. ±1.96) derived from the normal curve to give a chosen probability value (p < .05 in the case of ±1.96). Because the difference score is standardized it is expressed in deviation units not in the units of the original measure, and is, therefore, measure-independent, like the effect size (ES) Cohen’s d/Hedges’ g (which is the group mean difference standardized by the pooled SD or the pre–post mean difference standardized by the average SD; Borenstein, Reference Borenstein and Cooper2012; Lakens, Reference Lakens2013), and can be used to determine RC across measures with different absolute ranges of values. As an alternative approach to determining RC it is easy to calculate an index score for the particular measure which indicates the absolute value of the difference score required for the difference to be reliable at some criterion level (e.g. p < .05).
This index is the RCI and is calculated (specifically for p < .05) as:
 $$RC{I_{(.05)}} = 1.96{S_{Diff}}.$$
This is generally rounded to the nearest whole number to reflect the units of the measure. Rounding up or down will slightly alter the area under the normal curve that gives the probability value, but given the effects on measurement resulting from forcing individuals to respond using the fixed values of the Likert scales commonly used in psychology research there is no need to be too pious about this. In practice, investigators can use either C i (Standardized) or the RCI in determining reliable change; they yield consistent classifications. Indeed, both have been given the same label RC or RCI.Footnote 1 Table 1 displays a set of raw data to demonstrate that the same outcome results from the use of either classification method. Note, though, that C i (Standardized) and RCI are conceptually different. C i (Standardized) is a score given to an individual, and the RCI is a property of the measure. Below, I will refer to the equations above as defining the conventional JT method for RC/RCI (Evans et al., Reference Evans, Marginson and Barkham1998; Maassen, Reference Maassen2000). Online calculators using the JT method are available to calculate RCI given relevant psychometric information (e.g. see https://www.psyctc.org/stats/rcsc1.htm).
Showing reliable change graphically
From the beginning (1984) Jacobson and colleagues used a particular kind of graph to illustrate change relative to the RCI and to reveal clinical significance for those cases achieving this (Evans et al., Reference Evans, Marginson and Barkham1998). In this section I present a more elaborated form of this graph (Fig. 1), now called a modified Brinley plot (Blampied, Reference Blampied2017) and a second, simpler, dot-plot graph (Fig. 2) that displays RC, using the same data as C i (Standardized). The graphs show four sets of data, which may be thought of either as the findings of an RCT comparing a control condition (Fig. 1A) with three treatment conditions (Fig. 1B, C, D), or a comparison of results achieved by four branches of a clinical service serving the same population, or possibly even four therapists/therapy teams within the same service (see below for more on how RC/RCI may be used in research and practice settings). For practitioners especially, once a graph template has been set up, data from subsequent cases can be added to track outcomes attained for cases treated over time.
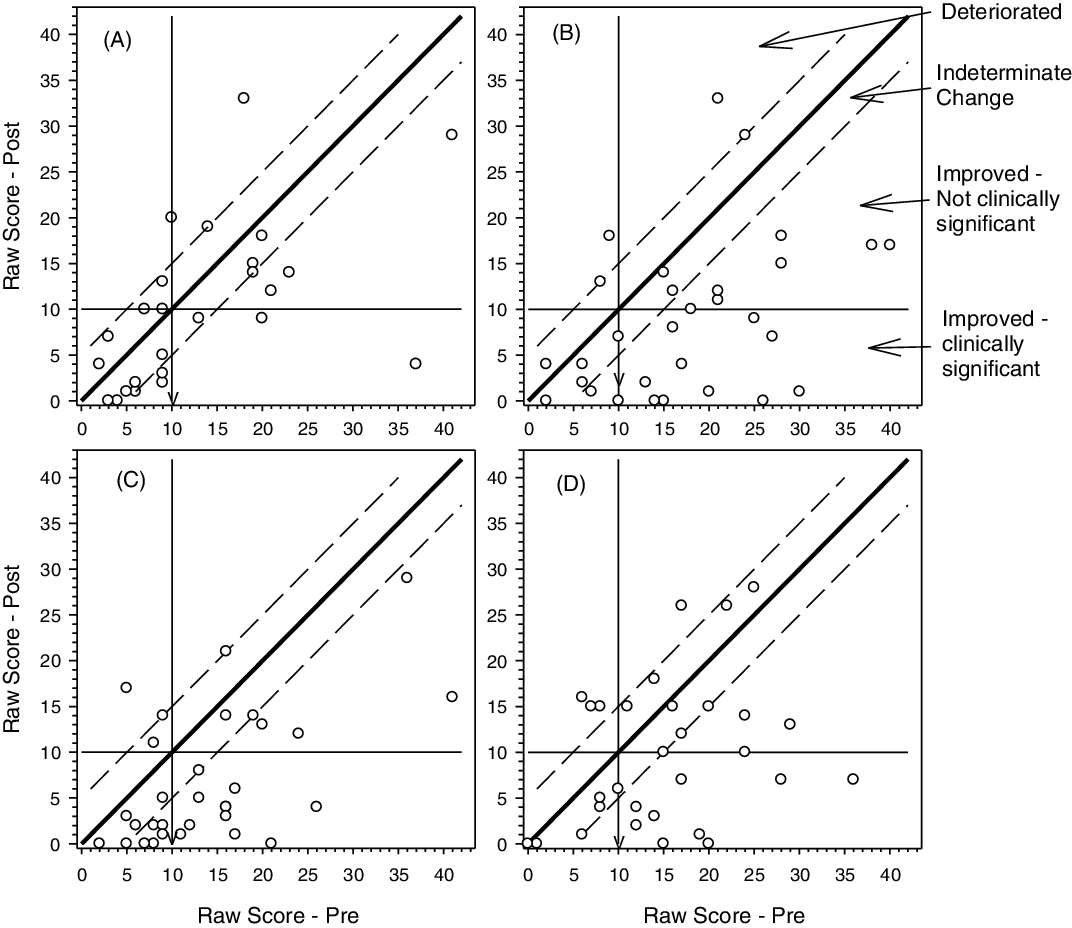
Figure 1. Modified Brinley plots of four sets of data that can be taken as coming from four arms of a randomized controlled trial or as representing four different clinical services. Each point represents the coordinate point for pre- and posttreatment raw scores. The continuous diagonal line represents the line of no change, the dashed diagonal lines represent the upper and lower boundaries of the reliable change index (set = 5) and the vertical and horizontal lines indicate a clinical cut-off score (set = 10). The arrowhead on the vertical line indicates the direction of change. The classification of cases falling in the different zones on the figure is shown to the right of panel B. Data are modified from Rucklidge et al. (Reference Rucklidge, Andridge, Gorman, Blampied, Gordon and Boggis2012) but for generality the specific scale has not been identified.
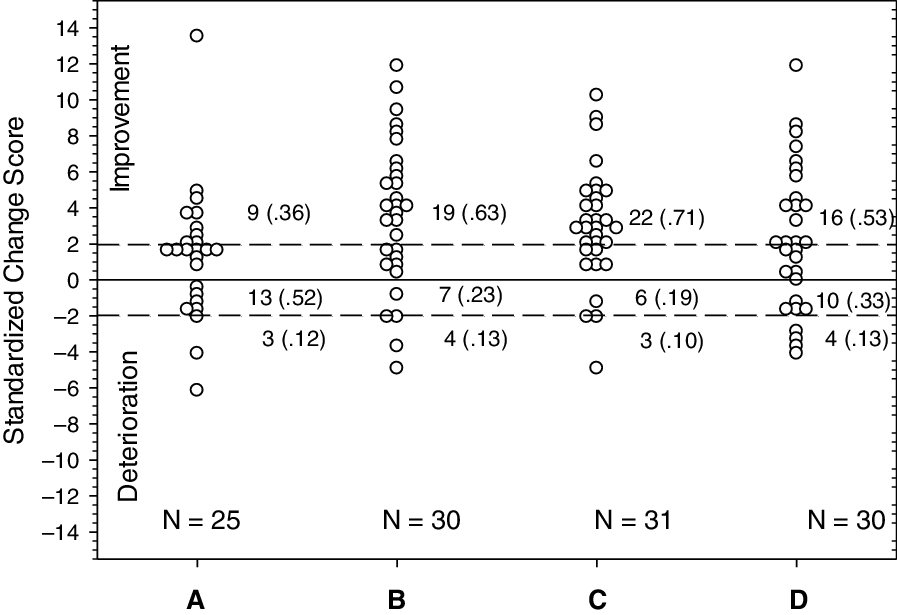
Figure 2. Dot plot scores of data from the same cases shown in Fig 1. Each data point represents the standardized change score (raw change score/standard error of the difference) of the case. Dashed lines show the boundaries for reliable positive change (improvement, +1.96) and deterioration (–1.96). The total number of cases in each set and the number (and proportion) in each category (Improved, Indeterminate, Deteriorated) is also shown.
A modified Brinley plot is a scatter plot where each individual’s pre and post (or other t 1 vs t 2 data, such as post-treatment vs follow-up) is displayed as a coordinate point. Given that the x (t 1) and y (t 2) axis scales are the same, any individual whose scores are unchanged will have their data point lying on the 45 deg diagonal line of no change. If change has occurred, the data point will be shifted away from the diagonal to an extent proportional to the change. The distribution of scores pre and post can be seen by looking at the distribution relative to each axis (e.g. you can see in Fig. 1D that there are fewer cases in this condition who have pre scores below the clinical cut-off). Lines can be drawn parallel to the central diagonal to represent ±RCI. Cases lying between those limits are showing indeterminate change (i.e. insufficient to be deemed reliably changed). Depending on the direction of clinically desirable change on the measure (which can be shown as an arrow on the graph), cases whose data lie beyond the RCI limits are either improved or deteriorated, and those within the limits are indeterminate. Where horizontal and vertical lines are added to show clinical cut-offs, those who have improved and who also fall beyond the horizontal cut-off line can be classified as clinically significantly changed. Blampied (Reference Blampied2017) has shown how other information, such as ES, means and confidence intervals, can be added to the plot to assist further interpretation (see also Black et al. Reference Black, Blampied, Arnold and Fristad2019). Graphs of this kind (Figs 1 and 2) can display large amounts of data for visual inspection, revealing trends and outcomes much more immediately than data tables, and if different symbols are used for different aspects of cases or treatments, may reveal moderator variable effects and treatment by severity interactions (Follette and Callaghan, Reference Follette and Callaghan2001; see Black et al., Reference Black, Blampied, Arnold and Fristad2019, and Rucklidge and Blampied, Reference Rucklidge and Blampied2011, for examples).
Figure 2 shows the same data using a simpler dot plot. Each dataset (from Fig. 1A–D) is plotted on the same graph with separate groups of cases spaced across the x-axis. The y-axis displays C i (Standardized). While in principle this is unbounded about zero, for any specific measure the maximum and minimum scores are given by the maximum possible difference score/S Diff, so that for a measure with maximum range of, for example, 0–50 (maximum difference score = ±50) and S Diff = 5, C i (Standardized) could range from +10 to –10. The line of no change is shown as a horizontal line at zero, with ±1.96 boundaries as dashed horizontal lines above and below the zero line. Cases with data points above the upper dashed line are improved and those below the lower line are deteriorated, with those between being classified as indeterminate. Note that for these data larger change scores indicate positive change because reduced scores indicate clinical improvement on the measure. That would reverse if increased scores indicated improvement.
Research and professional uses of RC/RCI
Much of the literature on RC/RCI has been directed at its use in research, although Jacobson and colleagues clearly considered that practitioners as well as researchers would benefit from a clear specification of reliable change and clinical significance in treatment outcome studies. Nevertheless, beyond this common interest in clinical significance and its RC pre-requisite, somewhat different uses of RC/RCI can be discerned for researchers and professional practitioners.
In the case of a research study, classifying each participant’s change as reliable is a further step that the investigator can take beyond reporting NHST statistics and effect sizes (both of which are nomothetic), providing a more complete, and some might argue, more honest, account of the findings. It also provides idiographic information in an otherwise entirely nomothetic context. Jacobson and colleagues argued that this should be routinely reported (Jacobson et al., Reference Jacobson, Follette and Revenstorf1984; p. 349) and Lambert has echoed this (Lambert and Bailey, Reference Lambert, Bailey and Cooper2012; Lambert and Ogles, Reference Lambert and Ogles2009). While such reporting adds important information about treatment outcome, Jacobson and colleagues (Jacobson et al., Reference Jacobson, Follette and Revenstorf1984; Jacobson and Truax, Reference Jacobson and Truax1991) and others since have warned that estimates of the efficacy of therapy are likely to be reduced by this practice. Jacobson and colleagues also argued that routine use of RC/RCI would motivate researchers to improve the quality of outcome measures, as, other things being equal, more reliable tests will have a smaller RCI and thus be more likely to find clinically significant change.
Furthermore, given that RC/RCI permits the classification of participants into a range of categories of response to treatment (Jacobson and Truax, Reference Jacobson and Truax1991; Wise, Reference Wise2004), this provides opportunities to explore the moderation and mediation of treatment effects and could then feed into further research on how to enhance the impact of treatment (Follette and Callaghan, Reference Follette and Callaghan2001). This might profitably be extended into further analysis of what predicts maintenance of gains at and beyond follow-up.
Jacobson and colleagues also clearly saw that the proportion of cases in the study sample deemed RC+ (RC+%) constitutes an ES (Blampied, Reference Blampied2017) which complements ES measures such as Cohen’s d (Lakens, Reference Lakens2013). Note that RC–% (the proportion who have deteriorated) may also be a useful measure; sometimes prevention of deterioration is an important therapy outcome (Aizik-Reebs et al., Reference Aizik-Reebs, Soham and Bernstein2021). The reporting of ES measures has become much more common than it was in 1984, with the standardized mean difference (Cohen’s d) being popular (Ferguson, Reference Ferguson and Kazdin2016). Abramowitz (Reference Abramowitz1998) used an adapted d where the mean difference was standardized by S Diff rather than the pooled SD to estimate the ES. This indicates if the change demonstrated by a ‘typical’ case – one whose scores were at the pre- and post-treatment means – would be considered reliably changed. Other researchers have since used this ES (e.g. Sheldrick et al., Reference Sheldrick, Kendall and Heimberg2001; Thompson et al., Reference Thompson, Destree, Albertella and Fontenelle2021) in meta-analyses. Where studies incorporated into a meta-analysis report RC/RCI classifications this information can also be used to enrich meta-analytic findings (e.g. Cuijpers et al., Reference Cuijpers, Karyotaki, Chiarova, Miguel, Noma and Furukawa2021).
The uses so far considered all apply to the analysis of data in hand after a study is completed. As Zarah and Hedge (Reference Zarah and Hedge2010) pointed out, RC/RCI also can be used prospectively in research. This could be done, for instance, in studies where some prior manipulation of one or more groups of participants is performed as part of the design (e.g. a mood manipulation) before all participants are then exposed to some primary treatment. Identifying, in advance of the application of the primary independent variable (IV), those who have demonstrated reliable change in response to the prior manipulation permits the researcher to strengthen their research in one of several ways. First, they might select for further participation in the study only those who have shown reliable change (e.g. whose mood has changed reliably in the appropriate direction), thereby strengthening the research by reducing one source of potential variance in the response to the IV. Alternatively, the researcher might classify participants into subgroups according to the RC+, RC– and RC0 classifications and examine the effect of this on the response to the primary IV (Zarah and Hedge, Reference Zarah and Hedge2010).
For practitioners, understanding RC/RCI will clearly be useful insofar as this knowledge will assist them in the evaluation of research relevant to their practice. There may, however, be some more direct utility for the practitioner in using RC/RCI in routine practice because of its specifically idiographic nature (Jacobson et al., Reference Jacobson, Follette and Revenstorf1984). It is a source of practice-based evidence (Barkham and Mellor-Clark, Reference Barkham and Mellor-Clark2003) and can contribute to measurement-based care (Scott and Lewis, Reference Scott and Lewis2015). In making decisions about the course of therapy, practitioners can use RC on relevant measures to assess change in clients and thence the clinical significance of any change, although this would be only one element in a comprehensive clinical judgement of progress and outcome (de Sousa Costa and de Paula, Reference de Sousa Costa and de Paula2015; Ojserkis et al., Reference Ojserkis, Morris and McKay2014).
Other potential uses in practice for RC/RCI include its use to defend practice innovations to service management authorities. Demonstrating that an innovation produces reliable and clinically significant change in client outcomes may help practitioners confirm that the innovation is useful and possibly obtain support and resources for maintaining and extending the innovation (e.g. Draycott et al., Reference Draycott, Kirkpatrick and Askari2012). Also, the routine use of RC/RCI assessments may also contribute to professional development (Kelley, Reference Kelley2010) and to service audit processes through the identification of services, client categories, and diagnostic/functional domains where outcomes are, or are not, being reliably achieved (e.g. Deane et al., Reference Deane, Kelly, Crowe, Coulson and Lyons2013) and thus support constructive and remedial actions.
The use of RC/RCI in the audit of outcomes achieved by clinical services can be extended to include large-scale reviews at the regional, national, and potentially, international level. For example, the RCI is used as part of the Improving Access to Psychological Therapies programme in the United Kingdom (e.g. Barkham et al., Reference Barkham, Stiles, Connell and Mellor-Clark2012; National Collaborating Centre for Mental Health, 2021). Important caveats apply to all such use of RC/RCI in audit and evaluation contexts. First, great care must be taken to ensure that the same algorithms and key psychometric coefficients are used in the RC/RCI computations (see below) to ensure that like is compared with like. Second, no decision regarding any particular therapy, therapist/therapy team, service or clinical system should be made exclusively on the basis of RC/RCI data. Such judgements should include wider considerations, including the clinical significance of the outcomes achieved (which is the primary reason for concern with RC in the first place).
Some issues and debates
Almost as soon as Jacobson and colleagues published their ideas others offered amendments, improvements, and replacements for the JT method. This identified a number of issues and engendered a variety of debates about the method, which continue to the present. In this section I will touch on several of these issues and debates that I see as particularly salient.
Calculating the SEM in the JT method
Getting the SE M for a measure is a key step. It requires two bits of data, s1 and r xx (equation (2) above). Jacobson and Truax (Reference Jacobson and Truax1991) were not very explicit or prescriptive in specifying the source of this information, but it is clear from their worked example that they envisaged it coming from an appropriate study reporting norms for the measure. This is fine in principle but not necessarily easy in practice. The SE M is not a fixed property of a scale, like the number and wording of its items; it is a contextually determined estimate of the precision of the measure in a specific instance of measurement with a specific sample. It may be challenging for a contemporary investigator to find a norm study that matches her/his investigative context. For instance, while norms may be available for a scale for Western, anglophone participants, what norms should be used for participants from other linguistic, cultural, and ethnic groups, or, what effect might the passage of time have had on adolescent norms from a study done in the pre-internet era? Careful judgement and defensible reasons are needed in the selection of data for the SE M calculation (Kendall et al., Reference Kendall, Marrs-Garcia, Nath and Sheldrick1999).
Given that norm data have been found, there is not much debate about selecting s 1 – it is the SD of an appropriate norm group on the scale (but see McAleavey, Reference McAleavey2021) – but the selection of the reliability coefficient has been more contentious. Classical test theory offers several reliability coefficients, of which internal consistency and test–retest reliability (r xx ) are the most relevant here. Jacobson and Truax (Reference Jacobson and Truax1991) recommended that r xx should be used, but many subsequent investigators of RC have used internal consistency, particularly coefficient alpha (α; also known as Cronbach’s α). Coefficient α can conveniently be estimated from a single test administration, and is widely reported in the psychometric literature. Its convenience and wide use has led to it being recommended (Lambert and Bailey, Reference Lambert, Bailey and Cooper2012) as standard practice for determining RC/RCI. Within the psychometric literature, however, coefficient alpha has been widely investigated and both critiqued and defended (Green and Yang, Reference Green and Yang2009; Raykov and Marcoulides, Reference Raykov and Marcoulides2019) and alternatives, notably coefficient omega (ω), have been recommended (Flora, Reference Flora2020). Investigators who have reason to prefer ω to α can substitute one for the other in their RC calculations, but I have not seen an example of this.
Recently, in a comprehensive critique of the classical JT method, McAleavey (Reference McAleavey2021) has argued that only test–retest reliability estimated over short inter-test intervals should be used, because it is the measure of reliability matching the pre–post repeated measures aspect of the data being analysed, and coefficient α should not be used. If implemented, this recommendation would preclude the use of RC/RCI for scales for which appropriate test–retest reliability could not be located, likely to lead to considerable restriction in the use of RC/RCI. Furthermore, test–retest reliability estimation is not a simple matter (Aldridge et al., Reference Aldridge, Dovey and Wade2017; Weir, Reference Weir2005) and even if a test–retest r xx is located in the literature, it is not always clear that it is the right version. The commonly reported Pearson’s r correlation is problematic because it is insensitive to systematic error across repeated measurements (Aldridge et al., Reference Aldridge, Dovey and Wade2017).Footnote 2 For some measures (e.g. rating scales) the preferred coefficient for estimating test–retest reliability is the intraclass correlation coefficient (ICC), not Pearson’s r (Aldridge et al., Reference Aldridge, Dovey and Wade2017; Weir, Reference Weir2005) but the calculation and interpretation of the ICC is complex. Once an appropriate ICC coefficient has been selected it can, and should, be used as r xx in the calculation of SE M (Weir, Reference Weir2005). Given competing recommendations regarding the selection of a reliability coefficient and the strong influence reliability has on SE M and the impact that in turn has on RC/RCI the field needs authoritative advice on the relative merits of the different reliability coefficients in the calculation of RC/RCI. This is a challenge that needs urgent attention by psychometricians. In the meantime, the selection and use of any particular reliability coefficient for the purposes of calculating RC/RCI needs careful specification and justification.
Accommodating practice effects
The scales commonly used to assess symptom severity in CBT, such as those used in research on the treatment of anxiety and depression, are typically assumed to be able to repeatedly measure the current psychological state of the individual without their score reflecting any substantive influence of them having previously taken the test, i.e. the scales are assumed not to exhibit practice effects. In contrast, tests of learning and of cognitive performance are known to be affected by practice effects, so that an individual’s scores will change over repeated administrations even in the absence of any true change (Duff, Reference Duff2012). This has led some, especially neuropsychologists, to suggest ways that the raw change score can be adjusted to take account of practice effects. There are a range of methods for adjusting the calculation of RC/RCI to take account of practice effects, ranging from adjusting each individual’s raw change score by a constant estimate of the practice effect derived from the mean data of some appropriate control group to more complex regression-based adjustments (Duff, Reference Duff2012). Some of these alternatives also involve changes to the calculation of SE M. Readers who may need to take account of practice effects should consult Duff (Reference Duff2012) for more detail about available methods.
Alternative methods for calculating RC/RCI
Over time, a considerable number of alternative formulas and statistical methods have been suggested as improved ways of obtaining RC/RCI (for selected summaries, see Hynton-Bayre, Reference Hynton-Bayre2010; Wise, Reference Wise2004). Earlier versions of these alternatives have been evaluated by examining their mathematical adequacy and selectively compared with one another using both synthetic and real data (see Lambert and Bailey, Reference Lambert, Bailey and Cooper2012, for a review). No alternative to the classical JT method approach has received general endorsement, and Lambert and Bailey (Reference Lambert, Bailey and Cooper2012) recommend the routine use and reporting of the JT method, in combination with other methods if the investigator desires. Others concur, often emphasizing that the JT method is relatively simple to use and produces results that are often similar to those from more complex methods (e.g. Atkins et al., Reference Atkins, Bedics, McGlinchey and Beauchaine2005; Bauer et al., Reference Bauer, Lambert and Nielsen2004; Ronk et al., Reference Ronk, Hooke and Page2016; but for reservations, see McAleavey, Reference McAleavey2021).
Recently, investigators have been reporting other, statistically advanced, ways of estimating SE M and other parameters. For example, Hays et al. (Reference Hays, Spirtzer and Reise2021) and Maydeu-Olivares (Reference Maydeu-Olivares2021) have explored the use of item response theory (IRT) to calculate RC/RCI. IRT is an alternative to classical test theory for psychometric test development. Other examples have explored ways to extend the calculation of RC/RCI across multiple time points, using moderated, non-linear factor analysis to estimate SE M (Morgan-Lopez et al., Reference Morgan-Lopez, Saavedra, Ramirez, Smith and Yaros2022). As yet, these methods are too new to have received much evaluative attention, but for investigators with large data samples and the requisite technical expertise, these may become useful techniques. They are less likely ever to be of direct use to the practitioner. In the meantime, the classical JT method continues regularly to be used in evaluations of the outcome of CBT (e.g. Anastopoulos et al., Reference Anastopoulos, Langberg, Eddy, Silva and Labban2021; Aizik-Reebs et al., Reference Aizik-Reebs, Soham and Bernstein2021; Auyeung et al., Reference Auyeung, Hawley, Grimm and Rowa2020; Mathews et al., Reference Mathews, Elizabeth, Roberts and Nixon2022; Timulack et al., Reference Timulack, Keogh, Chigwedere, Wilson, Ward, Hevey, Griffin, Jacobs, Hughes, Vaughan, Beckham and Mahon2022).
Conclusion
Thirty-eight years after it was first proposed by Jacobson and colleagues, is the concept of RC and the JT method still useful to researchers and practitioners of CBT? If one accepts that clinical significance is of great importance and that determining if individual change is reliably larger than might be due to measurement error alone is a necessary pre-requisite to determining clinical significance, then the answer is certainly yes. This is still the case even for those who adopt a different definition of clinical significance than that proposed by Jacobson et al. (Reference Jacobson, Follette and Revenstorf1984). Additionally, in a general sense, having a constant reminder of the ubiquity of measurement error is a good thing, not least because it should motivate us to improve our measures and to take care to select measures with high reliability. Also, the concept is a counterweight to the hegemony of the group statistical approach that so dominates psychology. It gives us an idiographic tool in an otherwise nomothetic tool box.
Over the years the JT method has been rigorously challenged, but it has survived, and can claim the virtue of simplicity and the recommendation of popularity relative to alternatives (Wise, Reference Wise2004) and has received authoritative endorsement and recommendation for routine use (Lambert and Bailey, Reference Lambert, Bailey and Cooper2012; but see McAleavey, Reference McAleavey2021 for reservations). Clearly, though, those using the JT method need to be aware of some of its weaknesses. If an investigator suspects their measure is influenced by practice effects, one of the methods described by Duff (Reference Duff2012) should be used instead. Care must be taken to select the proper reliability estimate for the JT formula for SE M. Unfortunately, doubts about the relative merits of internal consistency and test–retest reliability estimates remain unresolved and we lack expert guidance about this. Better ways of estimating key parameters and of incorporating multiple measures beyond just two time points may well be developed relatively soon, and would be welcome when they occur (McAleavey, Reference McAleavey2021).
Practitioners may well find RC/RCI to be useful in a variety of ways that improve clinical practice, but it goes without saying, that no decision to amend, change or terminate therapy or to classify a client in some way (e.g. as fit for work) should be made on the basis of RC/RCI alone. It is just one piece of information to feed into the matrix of clinical judgement. Also, when the context (e.g. degenerative disease, chronic severe conditions, developmental disabilities) makes the 1.96 criterion too severe and likely to find few if any clients reliably improved, then a more lenient criterion should be used.
In any use of RC/RCI in research or practice, it is essential that the method used be clearly and comprehensively described and choices among options justified. Details given should include the exact formulas used, the source of any norm data, and if local sample data are to be used instead, exactly how this is done. There has been, and I think we will have to accept that there will continue to be, a plurality of ways of estimating RC/RCI, just as there are a plurality of ways of testing for statistical significance, judging clinical significance, and estimating effect size. This has implications for the generality of any specific conclusions about reliable change that require careful consideration. Only if each method is carefully described when it is used will we be able to make ongoing judgements about the merits or otherwise of its use in specific instances and thereby improve our use of the method. With many aspects of our methodology we have to accept that there is no single mechanical ritual (Cohen, Reference Cohen1994) or statistical idol (Gigerenzer, Reference Gigerenzer2018), recourse to which will absolve us of the necessity of judgement. That is clearly true for determining reliable change.
Key practice points
-
(1) Using reliable change (RC) or the reliable change index (RCI) for a specific measure permits the practitioner to know if the degree to which any specific case has changed during treatment is greater than might have occurred just due to measurement error alone.
-
(2) This is a source of practice-based evidence and can help determine if clinically significant change has occurred for any case.
-
(3) Evidence about achievement (or otherwise) of reliable change may assist with supporting innovations in practice and with audit and professional development processes.
Data availability statement
No new data are presented in this paper.
Acknowledgements
None.
Author contributions
Neville Blampied: Conceptualization (lead), Visualization (lead), Writing – original draft (lead).
Financial support
This research received no specific grant from any funding agency, commercial or not-for-profit sectors.
Conflict of interest
The author declares none.
Ethical standards
In preparing this paper I have abided by the Code of Ethics for Psychologists Working in Aotearoa/New Zealand: https://www.psychology.org.nz/members/professional-resources/code-ethics


 Open access
Comments
No Comments have been published for this article.