


Recent media reports have focused on the large increase in prescriptions for antidepressants in the UK. Reference Batty1–Reference Easton3 The implication of some of these reports is that depression is on the rise, perhaps driven by the recent financial crisis. Reference Batty1 However, the number of antidepressants dispensed in England each year has been steadily on the rise since at least as far back as 1991, with approximately 9 million items dispensed in 1991 rising to 50 million items dispensed in 2012. 4 Selective serotonin reuptake inhibitors (SSRIs) accounted for more than 50% of the items dispensed, with citalopram accounting for more than 13 million of the dispensed items in each year between 2011 and 2012. 4 Nonetheless, the UK Psychiatric Morbidity Surveys have reported little overall change in the prevalence of common mental disorders such as depression and anxiety in England between 1993 and 2007. Reference McManus, Meltzer, Brugha, Bebbington and Jenkins5 This has led to suggestions that the rise in items of antidepressants dispensed over time is instead due to an increase in the number of people taking them long term. Reference Moore, Yuen, Dunn, Mullee, Maskell and Kendrick6 In this study we aimed to explore this further, with a particular focus on prescribing of SSRIs between 1995 and 2012. Our specific aims were: (a) to examine the rate of new SSRI prescribing over time and the sociodemographic factors associated with new prescribing; (b) to examine changes over time in the total amount of time for which the people were prescribed SSRIs; and (c) to examine the duration of individual prescribing episodes.
Method
Data source
The data for this study come from The Health Improvement Network (THIN; http://csdmruk.cegedim.com/), a large UK primary care database. THIN contains the longitudinal health records of approximately 12 million patients who are registered with a general practice (family doctor), and is broadly representative of the UK population. Reference Blak, Thompson, Dattani and Bourke7 In the UK 95% of the population is registered with a general practice and THIN contains records of all prescriptions issued there – most prescribing in the UK is carried out by a general practitioner even when the decision to start a drug is made by a hospital specialist. THIN also contains patient demographic information including Townsend score (this is a measure of deprivation based on census data for car ownership, owner-occupation, overcrowding and unemployment in a patient's postcode and is categorised into quintiles).
The scheme for THIN to obtain and provide anonymous patient data to researchers was approved by the National Health Service South-East Multicentre Research Ethics Committee (MREC) in 2002 and scientific approval for this study was obtained from CSD Medical Research's Scientific Review Committee in December 2014.
Time period and study population
We examined SSRI prescribing during the period from 1 January 1995 to 31 December 2012. Individuals were included from the latest of their date of registration, the year at which they turned 18 years of age or the dates at which their practice reached the standards for acceptable computer use and mortality recording. Reference Horsfall, Walters and Petersen8,Reference Maguire, Blak and Thompson9 Follow-up ended when an individual left the practice or died.
SSRIs
Prescriptions for SSRIs were identified by drug codes that were linked to the British National Formulary (BNF) codes in Chapter 4.3.3 (selective serotonin reuptake inhibitors). In the UK, general practitioners (family doctors) use the BNF as their guidance for prescribing (www.medicinescomplete.com/about/publications.htm).
Outcomes of interest
The rate of new SSRI prescriptions per 100 person-years at risk
Prescriptions for SSRIs were treated as being part of a single prescribing episode if they were within 365 days of each other. We considered prescribing episodes involving more than one prescription since it seems more plausible that individuals who return for a second prescription will have initiated treatment, whereas many individuals who receive only one prescription may never have initiated treatment.
We excluded prescribing episodes with a first prescription before the start of follow-up or less than 365 days after the individual registered with their practice since these individuals may have initiated an SSRI while registered with their previous practice. The potential impact of including people who received a ‘first’ SSRI prescription shortly after registration was evaluated in a supportive analysis and is described in online supplement DS1.
The amount of person-time spent on SSRI prescriptions
This was defined as the total amount of time (in years) spent by all individuals in episodes of SSRI prescribing divided by the total follow-up time. For this outcome, SSRI prescriptions were treated as being part of a single episode if they were within 91 days of each other; episodes were considered to finish on the date of the final prescription. We chose the cut-off of 91 days because, although most individuals receiving repeat prescriptions were receiving monthly prescriptions, some individuals were receiving prescriptions every 2 months; the cut-off of 91 days allowed these individuals to collect some prescriptions early or late without being considered to have discontinued. Again, we only considered prescribing episodes involving more than one prescription.
The length of prescribing episodes
Prescriptions were counted as being in the same episode if they were within 91 days, and episodes were considered to finish on the date of the final prescription. As above, we only considered episodes involving more than one prescription; hence, episodes starting and ending on the same day were excluded. Likewise, we were not able to estimate duration of episodes starting within 91 days of an individual registering at the practice, since individuals may have initiated treatment before they joined the practice. We allowed at least two years of follow-up for all episodes, and therefore excluded new episodes starting in 2011 and 2012.
Statistical analyses
The rate of new SSRI prescriptions per 100 person-years at risk was calculated as the number of individuals receiving their first SSRI prescription in a prescribing episode (see below) during a specified period divided by the total person-years at risk. Time at ‘risk’ comprised the time to an individual's first SSRI prescription, time between prescribing episodes (excluding the 365-day period after the end of a prescribing episode where any prescriptions would be counted as part of the preceding episode), time to their end of follow-up after their final prescribing episode, or all time from the start to end of follow-up if they have no SSRI prescriptions. We plotted the rate of new SSRI prescribing over time, both overall and by individual SSRIs. We then used Poisson regression to examine the relationship between SSRI initiation and gender, age and Townsend score quintile. Models were estimated separately for men and women to allow the relationships to differ by gender, and all models included a random effect to account for clustering by practice and robust variance estimates. Adjustment variables were age, Townsend quintile and year. Individuals with missing Townsend score (6.2%) were excluded from all Poisson regression analyses. Further, we estimated the proportion of the total episodes that constituted a single prescription over time and as a sensitivity analysis we included these in the overall estimates of initiation of SSRI.
The amount of person-time spent on SSRI prescriptions was estimated as the total amount of time (in years) spent by all individuals in episodes of SSRI prescribing divided by the total follow-up time and results were provided as the number of person-years on SSRIs per 100 person-years, which was then plotted over time. As an example, an individual initiating an SSRI at the start of January 2001 and receiving their final prescription at the end of June 2002 would contribute 1 year of person-time to the numerator for 2001 and 6 months of person-time to the numerator for 2002; they would contribute person-time to the denominator for every year during which they were under follow-up.
We estimated the length of prescribing episodes as median, upper and lower quartiles of SSRI prescribing episode duration. These were plotted over time (focusing on the year that the prescribing episode started), and we also examined the relationship between duration of prescribing episode and gender, age, Townsend score quintile and the number of the prescribing episode. The data were analysed using Stata version 13.1.
Results
We analysed data from 7 025 802 individuals registered at 584 general practices across the UK. The mean follow-up time was 6.3 years, while the total follow-up was 44 590 161 years. In total, 655 357 individuals initiated an SSRI during follow-up, with 78.9% initiating an SSRI prescribing episode only once, 16.4% initiating an SSRI twice, and 4.7% initiating an SSRI three or more times during follow-up.
The rate of new SSRI prescribing increased from 1.03 per 100 person-years in 1995 to 2.15 in 2001 (Fig. 1(a)). After 2001, the initiation rate remained relatively stable thereafter. During the same period there were substantial changes in the rate of new prescribing for individual SSRIs (Fig. 1(b)). In 1995, the two most frequently initiated SSRIs were fluoxetine and paroxetine, whereas by 2012 citalopram and sertraline joined fluoxetine as the most frequently initiated drugs. The rate of new prescribing of paroxetine fell sharply from 0.61 per 100 person-years in 2001 to 0.12 in 2004. Meanwhile, the rate of first citalopram prescribing increased steadily from 0.01 per 100 person-years in 1995 to 1.33 in 2010.
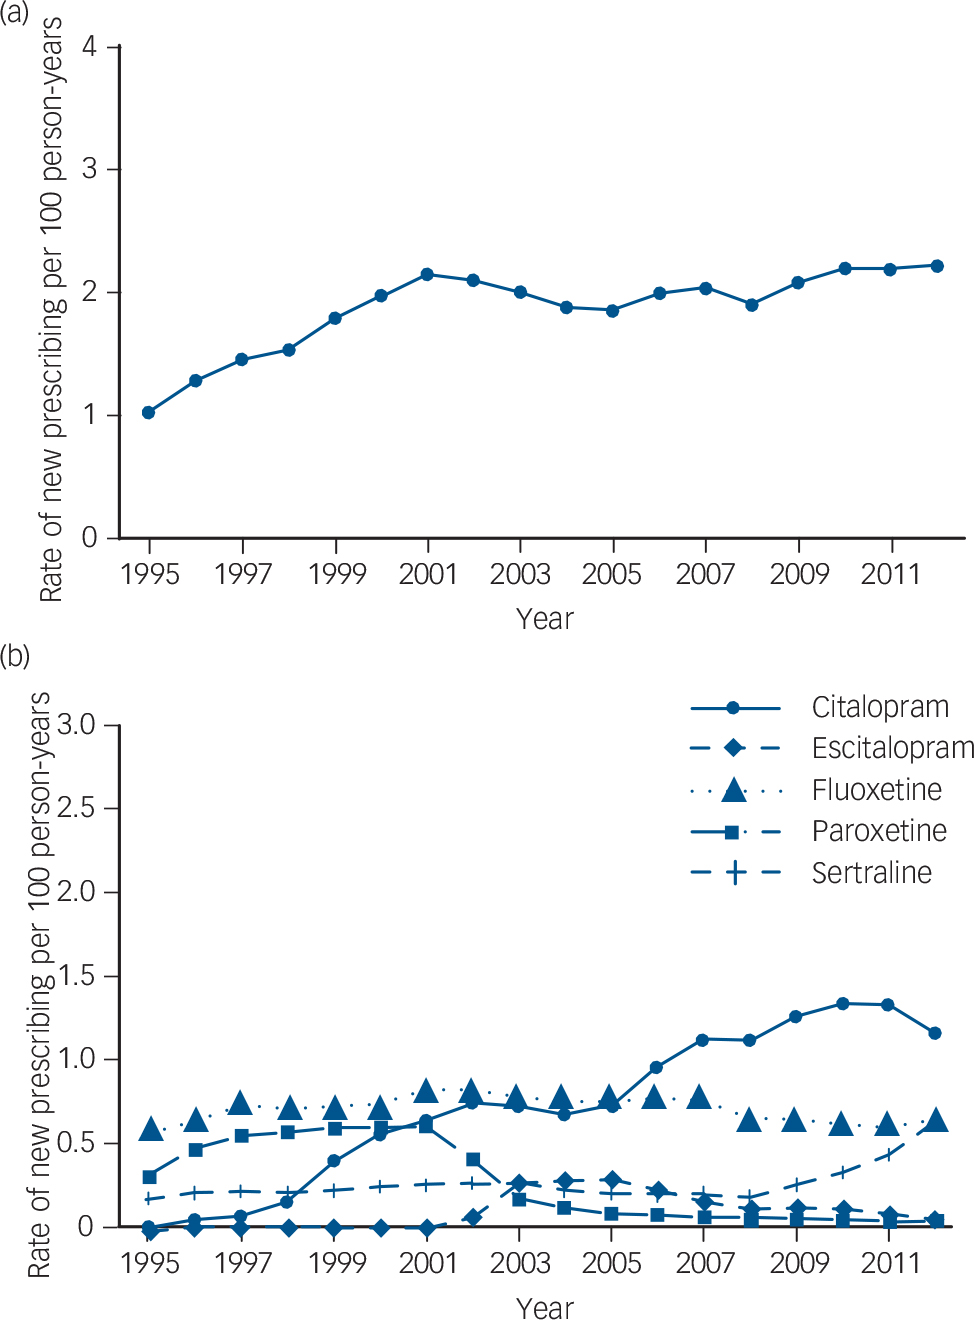
Fig. 1 (a) Overall rate of new selective serotonin reuptake inhibitor (SSRI) prescribing; (b) rate of new SSRI prescribing by drug. Fluvoxamine has been omitted because the rate of new prescribing was so low (0.01 per 100 person-years in 1995, and falling during the rest of the study period).
Sensitivity analysis investigating prescribing episodes that constituted just a single prescription resulted in a rate of new SSRI prescribing episodes of 0.54 per 100 person-years in 1995, and 0.83 per 100 person-years in 2003. In 2012 it was 0.75 per 100 person-years. The proportion of all new SSRI episodes constituting a single prescription declined from 35% in 1995 to 27% in 2005 and has since remained steady at around this level (see online Fig. DS1). Hence, including those with just a single prescription increased the overall estimates of SSRI initiation, but the time trends of new SSRI prescribing remained the same (see online Fig. DS2).
Women were more than twice as likely as men to initiate an SSRI during follow-up (adjusted rate ratio (RR) = 2.14, 95% CI 2.13–2.15). Age was also related to the rate of SSRI initiation, although this varied by gender (Tables 1 and 2). For both men and women, the rate of new prescribing was lowest in the 60–79 years age band. For men, the rate of new SSRI prescribing was highest in those aged 80 years or over (adjusted rate ratio compared with those aged 18–39 years 1.29, 95% CI 1.25–1.34). For women, the rate of new SSRI prescribing was highest in those aged 18–39 years – women in the 60–79 years age range were nearly half as likely to receive a first SSRI prescription as those in the 18–39 years age range (RR = 0.55, 95% CI 0.54–0.57), whereas women aged 80 years or over were 0.68 times as likely to initiate an SSRI (95% CI 0.66–0.70) compared with the 18–39 years reference group. Social deprivation (quintiles of the Townsend scores) was also related to the rate of new SSRI prescribing with the rates steadily increasing with increasing level of deprivation. Thus, men from the most deprived area (Townsend quintile 5) were 74% (95% CI 70–78%) more likely to initiate SSRIs than men from the least deprived areas (Townsend quintile 1, Table 1). The patterns were similar for women (Table 2).
Table 1 Initiation rates and rate ratios (RRs) for first prescription of a selective serotonin reuptake inhibitor (SSRI) by age, Townsend quintile and year, in men a
| Initiation rate per 100 person-years at risk |
RR unadjusted (95% CI) |
RR adjusted (95% CI) |
|
|---|---|---|---|
| For all men | 1.29 | ||
| Age, years | |||
| 18–39 | 1.25 | 1 | 1 |
| 40–59 | 1.43 | 1.14 (1.12–1.16) | 1.16 (1.14–1.18) |
| 60–79 | 1.06 | 0.84 (0.82–0.86) | 0.85 (0.83–0.87) |
| 80 or over | 1.63 | 1.30 (1.26–1.34) | 1.29 (1.25–1.34) |
| Townsend quintile | |||
| 1 (least deprived) | 1.05 | 1 | 1 |
| 2 | 1.16 | 1.11 (1.09–1.13) | 1.11 (1.09–1.13) |
| 3 | 1.29 | 1.26 (1.23–1.28) | 1.26 (1.23–1.28) |
| 4 | 1.49 | 1.47 (1.44–1.50) | 1.48 (1.45–1.50) |
| 5 (most deprived) | 1.75 | 1.74 (1.69–1.78) | 1.74 (1.70–1.78) |
| Year | |||
| 1995–1997 | 0.81 | 1 | 1 |
| 1998–2000 | 1.14 | 1.45 (1.38–1.52) | 1.45 (1.38–1.52) |
| 2001–2003 | 1.32 | 1.67 (1.59–1.76) | 1.67 (1.58–1.76) |
| 2004–2006 | 1.22 | 1.54 (1.46–1.62) | 1.53 (1.45–1.62) |
| 2007–2009 | 1.31 | 1.65 (1.56–1.75) | 1.65 (1.56–1.74) |
| 2010–2012 | 1.48 | 1.88 (1.78–1.99) | 1.87 (1.77–1.98) |
a. All models include a random effect for practice. Individuals with missing Townsend score (6.24%) are excluded from all analyses in this table.
Variables adjusted for: age, Townsend quintile, year.
Table 2 Initiation rates and rate ratios (RRs) for first prescription of a selective serotonin reuptake inhibitor (SSRI) by age, Townsend quintile and year, in women a
| Initiation rate per 100 person-years at risk |
RR unadjusted (95% CI) |
RR adjusted (95% CI) |
|
|---|---|---|---|
| For all women | 2.71 | ||
| Age, years | |||
| 18–39 | 3.17 | 1 | 1 |
| 40–59 | 3.00 | 0.93 (0.92–0.95) | 0.96 (0.94–0.97) |
| 60–79 | 1.76 | 0.55 (0.53–0.56) | 0.55 (0.54–0.57) |
| 80 or over | 2.20 | 0.69 (0.67–0.71) | 0.68 (0.66–0.70) |
| Townsend quintile | |||
| 1 (least deprived) | 2.26 | 1 | 1 |
| 2 | 2.46 | 1.10 (1.09–1.12) | 1.11 (1.09–1.12) |
| 3 | 2.74 | 1.26 (1.24–1.28) | 1.26 (1.24–1.27) |
| 4 | 3.13 | 1.45 (1.43–1.48) | 1.45 (1.43–1.48) |
| 5 (most deprived) | 3.53 | 1.64 (1.60–1.67) | 1.64 (1.60–1.67) |
| Year | |||
| 1995–1997 | 1.76 | 1 | 1 |
| 1998–2000 | 2.47 | 1.43 (1.37–1.49) | 1.43 (1.37–1.50) |
| 2001–2003 | 2.85 | 1.63 (1.55–1.71) | 1.64 (1.56–1.72) |
| 2004–2006 | 2.61 | 1.49 (1.41–1.56) | 1.49 (1.42–1.57) |
| 2007–2009 | 2.74 | 1.56 (1.49–1.64) | 1.58 (1.50–1.66) |
| 2010–2012 | 2.98 | 1.71 (1.62–1.80) | 1.73 (1.64–1.82) |
a. All models include a random effect for practice. Individuals with missing Townsend score (6.24%) are excluded from all analyses in this table.
Variables adjusted for: age, Townsend quintile, year.
Although the rate of new SSRI prescribing has remained relatively stable over time since 2001, the same is not true for the amount of person-time spent on SSRI prescriptions (Fig. 2(a)). This has risen sharply from 0.73 years of SSRI prescribing per 100 person-years in 1995 to 4.94 in 2012, with a rise every year. Similarly, there have been increases in the median duration of SSRI prescribing episodes over time (Fig. 2 (b)): the median duration of an episode of prescribing went from 112 days for episodes starting in 1995 to 169 days for episodes starting in 2010. Meanwhile, the 25th percentile of episode duration increased from 51 days to 70 days and the 75th percentile increased from 256 to 440 days over the same period.
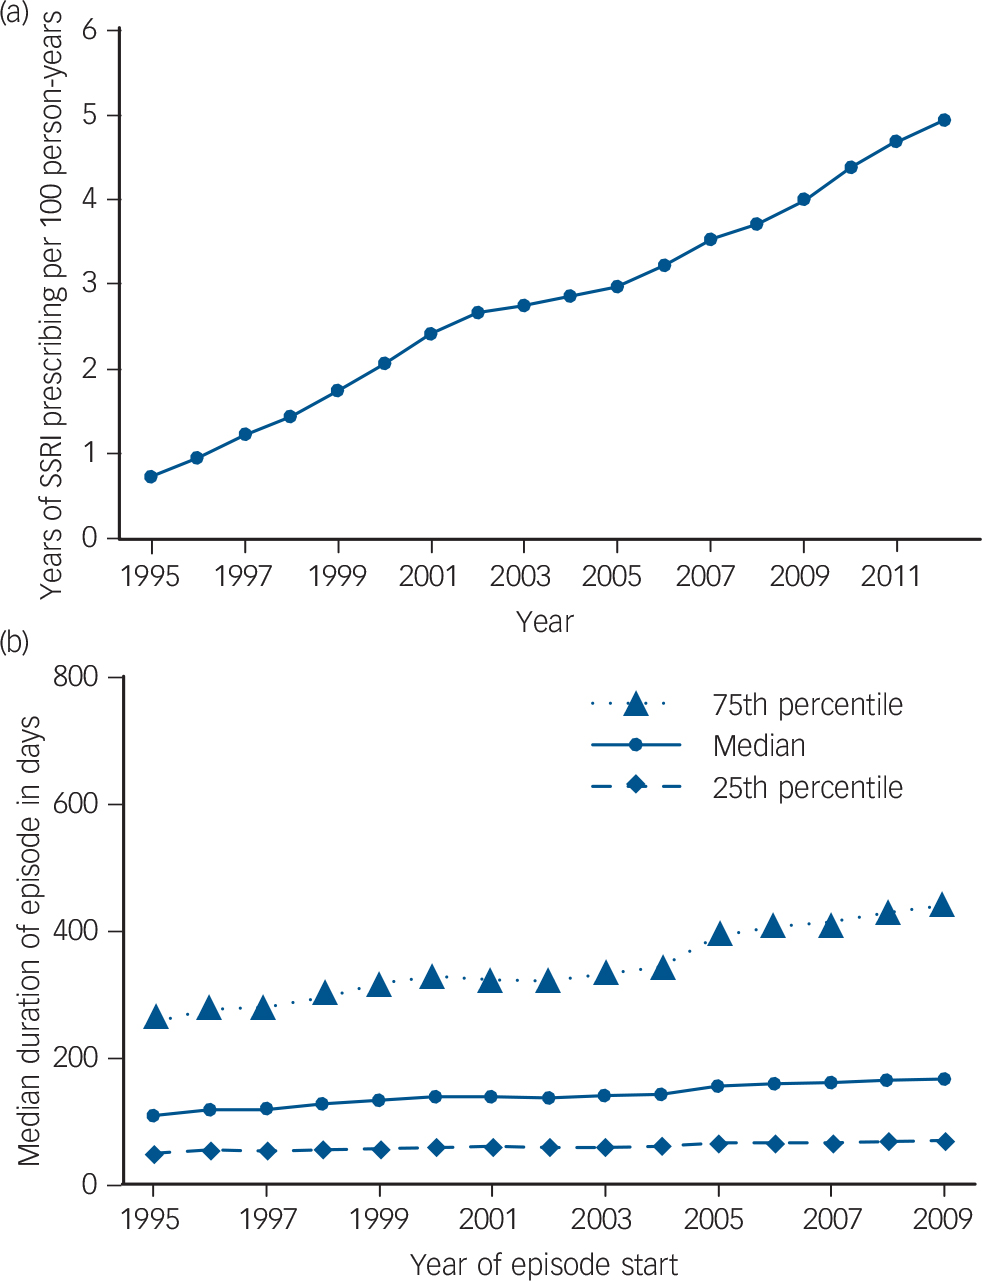
Fig. 2 (a) Total amount of time spent on selective serotonin reuptake inhibitor (SSRI) prescriptions over time; (b) duration of prescribing episodes over time.
The median duration of an SSRI prescribing episode also varied according to the individual's characteristics (Table 3). Episodes tended to be longer for women than for men – median episode length was 154 days (interquartile range (IQR) = 66–375) for women compared with 141 days (IQR = 59–358) for men. Median duration of episode also varied by age – it was longest for those in the oldest age group at 192 days (IQR = 65–562) compared with 123 days (IQR = 56–275) for those aged 18–39. Median duration of prescribing was also longer for those who had had more than one episode of SSRI prescribing: those on their third or higher episode of prescribing had a median episode length of 162 days (IQR = 72–408) compared with 136 days (IQR = 55–325) for those on their first episode.
Table 3 Median duration of prescribing episode in days by gender, age, Townsend score quintile and the number of the episode
| Median, days |
Percentile, days | ||
|---|---|---|---|
| 25th | 75th | ||
| Gender | |||
| Male | 141 | 59 | 358 |
| Female | 154 | 66 | 375 |
| Age at episode start | |||
| 18–39 | 123 | 56 | 275 |
| 40–59 | 166 | 71 | 407 |
| 60–79 | 188 | 71 | 532 |
| 80 or over | 192 | 65 | 562 |
| Townsend quintile | |||
| 1 (least deprived) | 160 | 69 | 377 |
| 2 | 158 | 68 | 385 |
| 3 | 150 | 63 | 371 |
| 4 | 143 | 60 | 362 |
| 5 (most deprived) | 139 | 58 | 363 |
| Episode number | |||
| First | 136 | 55 | 325 |
| Second | 156 | 65 | 392 |
| Third or higher | 162 | 72 | 408 |
Discussion
Main findings
Despite the reports in the media on the substantial increase in the rate of antidepressant prescribing, our results suggest there has been no similar continued increase in the rate of SSRI initiation over time. Although the rate of SSRI initiation rose between 1995 and 2001, we found that the rate of new prescribing remained relatively stable between 2001 and 2012. Over the same period of 2001 to 2012, the number of antidepressant items dispensed in England rose from 24 million to 50 million, with citalopram, fluoxetine, sertraline and paroxetine accounting for more than half of the items dispensed in 2012. 4 Other antidepressants commonly dispensed in 2012 included amitriptyline, often used for indications such as nerve pain and nocturnal enuresis (10.3 million dispensed items), venlafaxine (2.9 million dispensed items) and mirtazapine (5.3 million dispended items). 4 Our results suggest that for SSRIs the dramatic increase in dispensing does not appear to reflect a large increase in the number of people initiating SSRIs. Instead, it seems that individuals who take SSRIs are each receiving more prescriptions and for a longer period of time.
Similar increases in the number of antidepressant prescriptions have been seen in many other Organisation for Economic Co-operation and Development (OECD) countries between 2000 and 2011. 10 The OECD report suggests four possible reasons for the increase in antidepressant consumption across all countries: (a) greater intensity and duration of treatment; (b) use for a broader set of indications such as milder forms of depression and generalised anxiety disorder; (c) greater social acceptability of antidepressants and willingness to seek treatment; and (d) increased insecurity related to the recent financial crisis. For the UK at least, only the first of these explanations is consistent with the findings of the present paper; the other three explanations would all result in an increase in the rate of SSRI initiation in the relevant time period that was not seen here. However, media coverage of the OECD report focused on the other explanations, leading to claims that antidepressants are increasingly being overprescribed. Reference Martin11,Reference Boseley, Chalabi and Rice-Oxley12 This highlights the importance and need for more detailed analysis of individual-level rather than aggregated data.
Changes in patterns of prescribing for individual drugs
Although there has been little change overall in the rate of SSRI initiation since 2001, there have been considerable changes in the patterns of prescribing for individual drugs. One of the most notable changes is the decline in the rate of new prescribing of paroxetine from 2001 to 2003. A similar decline has been noted in the numbers of prescriptions for paroxetine issued by general practitioners in England; this decline has been linked to a US Food and Drug Administration regulatory communication about withdrawal symptoms associated with paroxetine, as well as three UK Panorama television programmes suggesting links between paroxetine and suicidal behaviour. Reference Martin, May and Gunnell13 However, the decline in initiation of paroxetine also coincides with when the drug ceased to be actively marketed around that time. In contrast, we found that citalopram and, more recently, sertraline have been increasingly initiated, in line with the findings by the Health and Social Care Information Centre. 4 The reasons for these changes may be related to a reduction in cost and sertraline being recommended specifically in National Institute for Health and Care Excellence (NICE) Depression guidance as suitable for elderly individuals with cardiovascular disease. 14
Single SSRI prescriptions
Our primary analyses focused on initiation of SSRIs involving treatment episodes including at least two prescriptions as it seems more plausible that individuals who return for a second prescription may be more likely to have initiated treatment than those who received just one prescription. However, it should be noted that a large number of individuals received a single SSRI prescription: since 2005 this has constituted approximately 25–27% of all new prescribing episodes.
Change in total time and duration of prescribing episodes
The total amount of person-time spent on SSRI prescriptions has been rising steadily since 1995. This mirrors the increase in issued prescriptions that has been seen in England over the same period. 4 As we have seen, this rise in the amount of person-time being spent on SSRIs does not appear to be linked to an increase in the number of people being started on SSRIs, at least from 2001 onward. Instead, this rise seems to be at least partially explained by the increase in the duration of prescribing episodes observed over this period. This finding is consistent with an earlier study by Moore et al that examined prescribing data for antidepressants up to 2005: Reference Moore, Yuen, Dunn, Mullee, Maskell and Kendrick6 the authors concluded that the rise in antidepressant prescribing was down to a small increase in the number of people on long-term treatment. The present paper demonstrates that there has been a rise in the average duration of treatment beyond 2005 up to 2012. It also highlights the fact that the increase in duration is seen not only among those on long-term treatment, but also among those in the middle and lower end of the episode duration distribution: this is shown by the increases in duration for the median and 25th percentile shown in Fig. 2(b).
Gender and Townsend score differences
The rate of SSRI initiation differed by demographic characteristics. In general, the initiation rate was higher in women than in men. This is consistent with the higher prevalence of common mental disorders that has been reported among women. Reference McManus, Meltzer, Brugha, Bebbington and Jenkins5 Also notable was the higher rate of new prescribing among men aged 80 or more; this contradicts the findings of the 2007 Psychiatric Morbidity Survey in England, which reported the lowest prevalence of depressive episodes and common mental disorders for men aged 75 or over. Similarly, the Psychiatric Morbidity Survey reports that the prevalence of common mental disorders in women is lowest among those aged 75 or over. However, we found that the SSRI initiation rate was higher among those aged 80 or over than in those aged 60 to 79 years. Since the higher rate of new prescribing does not seem to reflect a higher prevalence of depression in these older age groups, further work is needed to understand the high levels of prescribing in these groups. This may reflect increased willingness of doctors to prescribe SSRIs to older individuals or a preference for drug treatment in comparison with other treatments that is specific for this age group. It may also reflect increased prescribing for off-label indications (such as neuropathic pain or fibromyalgia) in the older population. Alternatively, it is possible that the structured measurement instrument used to detect common mental disorders in the Psychiatric Morbidity Survey (the Clinical Interview Schedule-Revised) underestimates the prevalence of mental disorders in older individuals.
The rate of SSRI initiation was also found to vary by Townsend quintile: for both men and women, those living in areas associated with the highest level of deprivation had a higher rate of new SSRI prescribing than those from the less deprived areas. This is consistent with the finding that those with the lowest household income have the highest prevalence of depressive episodes and other common mental disorders. Reference McManus, Meltzer, Brugha, Bebbington and Jenkins5
Length of prescribing also varied by demographic characteristics: it was shortest for men and for those aged 18–39 years. Furthermore, duration of prescribing was linked to how many episodes of prescribing an individual had experienced: those on their third or higher episode had a longer median duration than those on their first episode. This difference is consistent with the 2009 treatment recommendation from the NICE that antidepressants should be continued for a minimum of 6 months after remission, but that those with two or more episodes in the recent past should continue treatment for at least 2 years. 14 However, the median length of episode for those on their third or higher episode was only 162 days, indicating that most of those in this group were prescribed SSRIs for considerably less than 2 years.
Limitations
Our study has some limitations. Since we used prescription data, we do not know whether individuals were actually taking their prescribed medication. To handle this, we only considered prescribing episodes consisting of two or more prescriptions with the assumption that if these individuals came back for a repeat prescription, it is more likely that they had taken the medication from the previous prescription. Similarly, we do not know when individuals stopped taking the medicine at the end of a prescribing episode; therefore, we simply counted the date of the individual's last prescription as the end of the prescribing episode. This will consistently underestimate the duration of prescribing episodes, however, since this underestimation is consistent it should not have an impact on the relative comparisons made at different time points within our data. Likewise, it is possible that individuals may have been prescribed different dosages. In an ideal situation we would examine standardised prescribing volumes as average daily quantities (ADQs). However, primary care data often lack detailed information on dose and therefore we were unable to perform such analysis.
It is possible that SSRI prescriptions may be initiated by a psychiatrist, and so some individuals' first prescriptions may not be captured in our data. However, even in this case repeat prescriptions in the UK are generally issued by the general practitioner and so these would be represented in our data, even though we may have underestimated the length of the prescribing episode. Additionally, we are unable to tell whether individuals had a previous episode of SSRI prescribing prior to joining their current general practice. Therefore, we may have underestimated some individuals' number of episodes of SSRI prescribing.
In this study the focus was on prescribing of SSRIs, which are by far the most commonly used antidepressants. However, it is possible that the prescribing patterns differs for treatments such as amitriptyline, venlafaxine and mirtazapine and further research on the prescribing patterns of these medications is warranted.
Implications
Initiation of SSRI prescribing in general practice has remained relatively constant from 2001 to 2012, even though there has been a steady increase in the amount of person-time spent on these drugs over this period. This is partially explained by an increase in the average duration of prescribing episodes over this period. Although there has been considerable media attention on the rise in the number of antidepressant prescriptions issued, this does not seem to reflect the real picture of SSRI usage. Despite the findings of Moore et al, there remains a belief that antidepressants are being increasingly overprescribed for mild depression or other indications. Although reporting of such theories in popular media may prove useful in ensuring that general practitioners and patients carefully consider whether antidepressants are suitable, it may also result in a reluctance to use antidepressants when they are actually appropriate.
This study demonstrates that, contrary to what has been widely suggested by the media, there has been no recent increase in SSRI initiation rates. The duration of treatment has increased congruent with current guidelines; however, it still falls short of NICE recommendations. It is unclear why general practitioners registered an increased rate of prescribing in older people. It may be related to lack of access to alternative treatments for depression such as cognitive–behavioural therapy and other forms of talking therapies; further research is required to gain a better understanding of this phenomenon.


eLetters
No eLetters have been published for this article.