
Introduction
Peter Townsend, a friend to social policy but also arguably one of the greatest sociologists of recent times (Heidensohn and Wright, 2010), pointed to the fact that the elimination of poverty was one of the foundational aims of the British welfare state in the aftermath of World War II (Townsend, Reference Townsend1954). He dedicated his entire career to improve poverty measurement in order to assess whether governments were aspiring to this aim.
Among his contributions to the field, he taught us that poverty is best understood as being relative rather than absolute (Abel Smith and Townsend, Reference Abel Smith and Townsend1965) and that poverty is less about shortage of income and more about the inability of people on low incomes to actively participate in society (Townsend, Reference Townsend1979). Moreover, different to several scholars in the field, he believed that poverty could be objectively rather than normatively determined (Piachaud, Reference Piachaud1987).
Townsend transformed the conception of poverty, viewing it not simply as lack of income but as the configuration of the economic conditions that prevent people from being full members of the society (Townsend, Reference Townsend1979; for a review see Ferragina et al., Reference Ferragina, Tomlinson and Walker2013). Poverty reduces the ability of people to participate in society, effectively denying them full citizenship (Marshall, Reference Marshall1963; Lister, Reference Lister1990). Given that there are no universal principles by which to determine the minimum threshold of participation equating to full membership of society, Townsend argued that the appropriate measure would necessarily be relative to any particular cultural context (Brady, Reference Brady2003; Iceland et al., Reference Iceland, Kenworthy and Scopilliti2005; Deeming, Reference Deeming2009; Garroway and De Laiglesia, Reference Garroway and de Laiglesia2012). He suggested that in each society there should be an empirically determinable ‘breakpoint’ within the income distribution below which participation of individuals collapses, providing a scientific basis for fixing a poverty line and determining the extent of poverty (this idea was explicitly taken forward by Gordon and Pantazis, Reference Gordon and Pantazis1997: 13).
Standing on Townsend's shoulders and acknowledging the contributions of several scholars in the field (for example, the ‘breadline’ approach proposed for the first time by Mack and Lansley, Reference Mack and Lansley1985), the over-arching aim of this article is to measure levels of poverty and participation in twenty-first century Britain while taking into account its diversity and complexity. We pursue this idea by: (1) revising the conceptualisation of participation in order to take into account the transformations that have occurred in British society; (2) using a sophisticated statistical technique, Structural Equation Modelling (SEM), to accommodate the multidimensionality of poverty and participation and to test for an income-related ‘breakpoint’ in participation; and (3) taking account of the multicultural nature of British society by exploiting the booster samples available in the Understanding Society study (2011, 2013).
Participation and poverty: Townsend and beyond
Townsend's conceptualisation of poverty as a relative deficit in participation related to limited income remains exceedingly influential. Its logic underpins most of the semi-official indicators of poverty employed in the UK: firstly, the ‘consensual’ or perceived deprivation approach set up in relation to the minimum standard of living that the majority of people believe to be essential in Britain across time (Mack and Lansley, Reference Mack and Lansley1985; Gordon and Pantazis, Reference Gordon and Pantazis1997; Gordon et al., Reference Gordon, Adelman, Ashworth, Bradshaw, Levitas, Middleton, Pantazis, Patsios, Payne, Townsend and Williams2000; Pantazis et al., Reference Pantazis, Gordon and Levitas2006; Lansley and Mack, Reference Lansley and Mack2015; on the difficulties to set up minimum income standards, see also Deeming, Reference Deeming2005, Reference Deeming2009, Reference Deeming2010); and, secondly, the measures of being ‘at risk of poverty’ used by Eurostat (Marlier et al., Reference Marlier, Atkinson, Cantillon and Nolan2007). However, his finding of a ‘breakpoint’ in participation related to income has rarely been replicated, while his work has been criticised on theoretical and empirical grounds (Desai and Shah, Reference Desai and Shah1988; Gordon and Townsend, Reference Gordon and Townsend1990; Gordon and Pantazis, Reference Gordon and Pantazis1997).
Many would follow Piachaud (Reference Piachaud1987) in arguing that income is distributed as a continuum from ‘great wealth to chronic poverty’ and that the idea of a ‘breakpoint’ is therefore implausible. Likewise, few would question Veit-Wilson's (Reference Veit-Wilson1987) assessment that Townsend's indicators reflected differences in individual taste rather than measures of either need or social participation. Furthermore, subsequent attempts to identify a clear ‘breakpoint’ have left most observers sceptical (Callan and Nolan, Reference Callan and Nolan1991). Townsend added responses about whether or not people possessed items or engaged in particular activities, thereby cumulating measurement error, and plotted the mode of his cumulative deprivation score against log-income, without controlling for other socio-demographic factors (Piachaud, Reference Piachaud1981; Mansfield, Reference Mansfield1986). Furthermore, the analytic techniques available to Townsend prevented him from retaining the multidimensionality of poverty and participation that he theorised.
Yet Townsend's idea that poverty is a real social phenomenon reflecting more the consequences of a lack of income than the lack of income per se has received powerful theoretical support from scholars (Ringen, Reference Ringen1988) and extensive testimony from people experiencing poverty in the UK (Mack and Lansley, Reference Mack and Lansley1985; Gordon and Pantazis, Reference Gordon and Pantazis1997; Gordon et al., Reference Gordon, Adelman, Ashworth, Bradshaw, Levitas, Middleton, Pantazis, Patsios, Payne, Townsend and Williams2000; Pantazis et al., Reference Pantazis, Gordon and Levitas2006; Lansley and Mack, Reference Lansley and Mack2015) and across the globe (Townsend, Reference Townsend, Gordon and Pantazis1997; Walker, Reference Walker2014). Furthermore, as demonstrated by the ‘reflexive sociology’ literature, in the thirty-seven years since Townsend's work, participation and consumption have become ever-more crucial mechanisms through which people establish and communicate their identity and position in society, increasing the premium attached to resources needed to participate (Giddens, Reference Giddens1991; Lash and Urry, Reference Lash and Urry1994; Featherstone, Reference Featherstone2007). But equally, British society has become more complex with ethnic diversity, multi-culturalism and life-style choices raising the possibility that a single concept of participation as conceived by Townsend might no longer apply (Festenstein, Reference Festenstein2005; Tomlinson, Reference Tomlinson2003). We argue that, despite these conflicting perspectives and the complexities of modern societies, it is possible to test the existence of an income-related ‘breakpoint’ in participation by using modern statistical techniques unavailable to Townsend.
Our theoretical framework starts from Townsend's multidimensional conception of poverty and its manifestation as lack of participation. According to Townsend: humans are social animals entangled in a web of relationships, which exert complex and changing pressures, as much in their consumption of goods and services as in any other aspect of their behaviour (Townsend, Reference Townsend2010: 93–4).
Hence, we consider the work of scholars (Putnam, Reference Putnam1993, Reference Putnam2000; Rose, Reference Rose2000) who since Townsend's original research have emphasised the importance of social participation and trust to a person's membership in the society (for a critical review in the British context see Ferragina and Arrigoni, forthcoming). Likewise, the concept of social exclusion has been added to the lexicon of poverty related terms, describing the process by which people, especially those on low incomes, can become socially and politically detached from mainstream society and its associated resources and opportunities (Room, Reference Room1995; Cantillon, Reference Cantillon1997; Hills et al., Reference Hills, Le Grand and Piachaud2002; Roosa et al., Reference Roosa, Deng, Nair and Lockhart Burrell2005; Levitas, Reference Levitas, Pantazis, Gordon and Levitas2006; Taket, Reference Taket, Crisp, Nevill, Lamaro, Graham and Barter-Godfrey2009). However, these notions are contested in the literature because they might be a way of looking at participation, which is biased towards the upper class (Orton, Reference Orton2006).
In addition, we acknowledge recent political aspirations to promote social cohesion through increased participation: this was a flagship goal of the former Coalition Government in the UK with the ‘Big Society’ as it was previously for the New Labour governments with ‘the Third Way’ (Giddens, Reference Giddens1998; Blair, Reference Blair2000; Montgomerie, Reference Montgomerie2011; Ferragina and Arrigoni, forthcoming). Finally, given that it has been suggested that multiculturalism and ethnic diversity are a challenge to social cohesion, it is necessary to take explicit account of ethnicity in our analyses (Cheong et al., Reference Cheong, Edwards, Goulbourne and Solomos2007). We therefore broaden Townsend's original concept of participation to embrace lack of deprivation, social participation and trust to capture whether individuals who are materially deprived are simultaneously socially isolated.
Data and methods
Data
Data are drawn from Understanding Society (USoc), a panel survey that is representative of households and individuals in the United Kingdom. The sample comprises approximately 40,000 households, meaning that the robustness of statistical estimates is generally high and that reliable information can be garnered for comparatively small subgroups in the population. Different suites of questions are asked in different waves and while most information derives from Wave 1 (conducted in 2009–10), that on social participation comes from Wave 3 (2011–12). While there are advantages in using purpose designed poverty surveys such as that conducted by Townsend (Reference Townsend1979) and the suite of subsequent ‘Breadline Britain’ studies that sought to improve on Townsend's original methodology (Mack and Lansley, Reference Mack and Lansley1985; Lansley and Mack, Reference Lansley and Mack2015; for a review see Fahmy, Reference Fahmy2014), it is possible to exploit the large sample size of USoc to disentangle poverty and participation levels among different ethnic groups.
Method
Poverty studies have often been characterised by the use of relatively sophisticated statistical methods; for example, discriminant analysis (Mack and Lansley, Reference Mack and Lansley1985). We pursue this tradition using SEM, a family of techniques to measure latent (i.e. unobserved or underlying) concepts (Buckner, Reference Buckner1988; Muthén, Reference Muthén1989), to test whether the lack of deprivation, social participation and trust do indeed combine into a single, albeit complex, concept of ‘participation’.Footnote 1 SEM allows us to create measures of these underlying concepts that can be used within a regression framework to control for specific covariates. The effect of income on participation can then be evaluated and possibility of a ‘breakpoint’ explored.
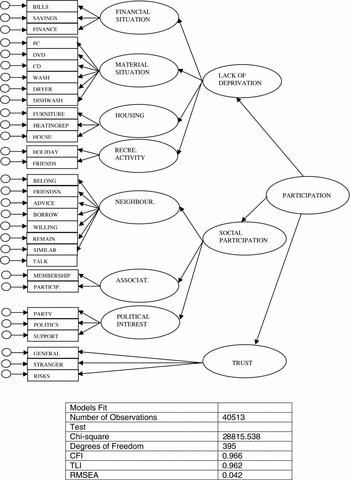
SEM treats phenomena as underlying concepts that are measured indirectly by means of related variables that are directly observed (Muthén, Reference Muthén1989). The variant of SEM employed here is Confirmatory Factor Analysis (CFA). We model participation as a composite of three dimensions (Figure 1): lack of deprivation, social participation and trust. This in turn comprises sub-dimensions measured by directly observed variables. The model is derived theoretically and then empirically tested against survey data. For example, Figure 1 shows that we have defined the concept ‘trust’ that we do not directly observe (and is therefore represented by an oval) but is indirectly measured by the observed variables related to trust in general, trusting strangers and willingness to take risks (which are represented by rectangles). It is also the case that latent concepts can be nested within other latent concepts. Thus in our model, ‘social participation’ is a combination of neighbouring, association and political participation. The overall measure of participation therefore combines several sub-dimensions.

Following SEM conventions, the single headed arrows represent coefficients or loadings in the model that reflect the relationships between the latent variables and their observed manifestations. The numbers shown are standardised coefficients that indicate the relative strength of the associations; larger numbers indicate stronger associations (the coefficients and measurement errors are reported in Table 1). They indicate, for example, that a person's participation score is mainly determined by social participation (0.96) and lack of deprivation (0.54) with trust playing a lesser though still considerable role (0.38). The coefficients are estimated using maximum likelihood and a variety of fit statistics are provided in order to assess the validity of the models constructed (Tables 1 and 2) (Jöreskog and Goldberg, Reference Jöreskog and Goldberger1975; Muthén, Reference Muthén1989; Brown, Reference Brown2006). The fundamental fit statistics reported by MPlus (the software employed) are TLI, CFI and RMSEA. Figures greater than 0.9 for TLI and CFI and RMSEA less than 0.05 are good fit statistics.
Table 1. Items and dimensions loadings SEM model of participation

Table 2. Correlation matrix latent variables

The composite participation scores of each individual are then used in regression analyses to consider whether a ‘breakpoint’ exists in the income distribution (controlling for other relevant predictors) below which participation should – according to Townsend's hypothesis – decline disproportionally. We repeat similar analyses for each dimension of participation and for different ethnic groups.
The dependent variables
The first dimension of participation, lack of deprivation, captures four components identified by Townsend (Reference Townsend1979, Reference Townsend1987): financial situation, material circumstances, housing and living conditions and recreation. Financial situation measures the extent to which people feel in control of their financial circumstances: Are they able to pay their bills? Can they save? And do they feel that they are comfortably well-off rather than life being financially difficult? Housing and living conditions records whether a person can afford to keep their home up to standard, to replace furniture that wears out, and to pay for repairs to their house or apartment and to keep it warm. Recreation registers whether a person can afford to go on holiday and has the money to invite family or friends home for dinner or a drink. The final component, material circumstances, establishes whether respondents possess the durable goods that are useful for day-to-day living but which not everybody has – these include a washing machine, dryer, dishwasher, personal computer, DVD player and CD player. Therefore, three of the four components directly capture respondent's perceptions of resource constraints; the last simply records whether a person has a possession.
The second dimension relates to social participation, which in turn comprises three components: neighbouring, associationism and political involvement (Townsend, Reference Townsend1979; Parker, Reference Parker1983). The founding fathers of sociology (Durkheim, Reference Durkheim1893; Tönnies, Reference Tönnies1955) reflected on how social participation was being affected by modernisation and postulated that modernity could result in a reduction of bonding ties and to rising alienation and anomie in society. This theoretical analysis has received empirical support in the last twenty years (Putnam, Reference Putnam1993; Fukuyama, Reference Fukuyama1995) with the development of social capital theory (Ferragina, Reference Ferragina2010, Reference Ferragina2012).
The three components selected to measure social participation reflect these empirical and theoretical advances (Paxton, Reference Paxton1999; Hall, Reference Hall1999; Van Oorschot and Arts, Reference Van Oorschot and Arts2005). On the one hand, neighbouring and associationism measure informal and formal participation. Neighbouring is a proxy to include in the measurement Tönnies’ Gemeinschaft and Durkheim's idea of Mechanic solidarity, while associationism tries to capture Tönnies’ Gesellschaft and Durkheim's idea of organic solidarity. These two sub-dimensions of social participation measure individual interactions within the micro-sphere. On the other hand, participation in politics captures the link between individuals and the macro-social sphere. High scores in this dimension suggest a strong overall participation to societal issues (Gorz, Reference Gorz and Van Parijs1992; Parry et al., Reference Parry, Moyser and Day1992).
Neighbouring is measured with an eight-item version of Buckner's Neighbourhood Cohesion Instrument (Reference Buckner1988). Sample items include: feelings of belonging to the neighbourhood; a willingness to ask for advice from someone in the neighbourhood; and the preparedness to work with others to improve the neighbourhood. The other items are shown in Figure 1. Associationism is defined as the involvement of people in formal associations, a measure of the official engagement in social activities. Simple membership is distinguished from active participation in associations (Ferragina, Reference Ferragina2013). Political interest is a traditional variable used to measure social engagement (Van Oorschot and Arts, Reference Van Oorschot and Arts2005). It is captured using three variables: level of support for a particular political party, level of interest in politics and closeness to one party rather than others (Parry et al., Reference Parry, Moyser and Day1992).
The third dimension of participation included in the analysis is trust, which is a composite of three indicators relating to whether respondents feel that most people can be trusted, the extent to which respondents are prepared to trust strangers, and their willingness to take risks with them. Trust captures the relation between citizens and the general structure of society. The rationale underlying this component is that modern society functions best when it is underpinned by a conducive environment in which citizens have a high level of confidence in each other (Barber, Reference Barber1983; Putnam, Reference Putnam2000). Trust among the British population has fallen over time (Hall, Reference Hall1999) and is usually reported to be lower among those on lowest incomes (Li et al., Reference Li, Pickles and Savage2005).
The explanatory variables
The (independent) socio-demographic variables included in the regression models help to draw a map of individual factors affecting participation (i.e. Guest and Wierzbicki, Reference Guest and Wierzbicki1999; Li et al., Reference Li, Pickles and Savage2005; Van Oorschot and Art, Reference Van Oorschot and Arts2005). Net income is equivalised according to household size and measured by using vigintiles. The top vigintile is the omitted variable. Gender is considered using the dummy variable male (with female as omitted variable). Age is a categorical variable including four groups: (1) people below age twenty-three; (2) people aged between twenty-four and fifty; (3) people aged between fifty and sixty-five; and (4) people above the age of sixty-five (the reference category). Employment status is a categorical variable that distinguishes between self-employed, unemployed, retired, people performing family tasks and informal work, students, people with disability or sick and other residual groups. The omitted variable is full time employed.
Education attainment has six categories: (1) lower education; (2) GCSE and equivalents; (3) A-level and equivalents; (4) nursing and teaching qualifications; (5) first degree level; and (6) postgraduate education (the omitted variable). Social class has eight categoriesFootnote 2 : (1) larger employers and higher management (the omitted variable); (2) higher professional; (3) lower management and professional; (4) intermediate occupations; (5) small employers and own account; (6) lower supervisory and technical; (7) semi-routine occupations; and (8) routine occupations.
The model includes also eight different household types. Couples without children is the reference variable, while the other family configurations are: single pensioner, couple pensioner, single person (no pensioner), lone parent, couples with children, other family types with children and other family types without children.
The size of Understanding Society enables us to differentiate between the largest ethnic groups. The reference category is ‘white’ respondents, which includes ‘white British’, ‘Irish’, ‘others with a white background’ and the eighteen respondents that self-identified themselves as ‘Gypsy or Irish travellers’.Footnote 3 The other major minority groups are Indian, Pakistani, Bangladeshi, Black Caribbean, Black African and persons declaring mixed ethnicity.Footnote 4 Each group is over represented with a sample boost that allows us to perform robust analysis (around 1,000 individuals for each groupFootnote 5 ). Scholars are divided among those that argue the growing presence of ethnic minorities in British society reduces participation and social cohesion and those that proposed mixed consequences with formal participation declining and informal care, for example, increasing (Knapp and Smith, Reference Knapp and Smith1995; Heath and Demireva, Reference Heath and Demireva2014). Finally, we control for all English regions, notably Greater London (the omitted variable), North East, North West, Yorkshire, East Midlands, West Midlands, East, South East, South West, plus Wales, Scotland and Northern Ireland.
Results
(1) Participation as a multi-dimensional concept
Data support the contention that dimensions of lack of deprivation, social participation and trust form a single trait, which captures the degree of a person's participation in society.Footnote 6 This is indicated by the model fit statistics: the comparative fit index (CFI) and the Tucker–Lewis index (TLI) are both well above the minimum threshold of 0.9, while the Root Mean Square Error Approximation (RMSEA) shows that the model has low error approximation (Figure 1). All dimensions and sub-dimensions selected to measure participation co-vary such that a high score on one is likely to be associated with a high score on another (Tables 1 and 2), and load significantly on the comprehensive dimension of participation which reflects lack of deprivation, high social participation and high levels of trust (Figure 1).
Lack of deprivation is strongly shaped by respondents’ financial situation, housing and living conditions and whether or not they can afford to take a holiday and entertain their friends. Lack of deprivation is less strongly characterised by possession of consumer durables – an observation that is probably an artefact of measurement since respondents were not asked whether they chose not to have items for reasons of cost. Similarly, we do not know when persons acquired their possessions – it could have been before they fell on hard times – or their condition (Table 1).
Social participation reflects associationism, political interest and neighbouring in that order. Our formal measure of social participation is weighted three times more than our measure of informal participation and 50 per cent more than a high interest in politics (Table 1). The measurement reflects the idea that formal social participation is the main component of social participation (Putnam, Reference Putnam2000). This prioritisation is open to the criticism that survey data tend to overestimate participation by the wealthiest and underestimate that of poorer people (Orton, Reference Orton2006) and we will reflect upon the implications of this when discussing participation by ethnic minority respondents. Finally, the third dimension of participation, trust, is most strongly characterised by respondents’ willingness to trust strangers, but also accounts for generic responses to trust other people.
(2) Townsend's ‘breakpoint’
In Figure 2a, the sample of respondents is divided on the basis of their net income into twenty equally sized groups called vigintiles. Participation in each income vigintile is comparedFootnote 7 with that in the top vigintile, the 5 per cent of people with the highest incomes. As a consequence, all the participation scores in the graph are negative, less than in the highest vigintile of income. The broken line reveals that participation declines steadily with falling income until about the fifth or sixth vigintile as Townsend would have predicted, but, then, instead of diminishing dramatically, it rises slightly in lower vigintiles and increases markedly in the lowest. The soup spoon shape of the graph reveals that participation in the lowest vigintile is very similar to that in seventh vigintile.

Figure 2. Effect of income on participation, lack of deprivation, social participation and trust (twentieths)
The socio-demographic characteristics of people on the lowest incomes are markedly different from those at the top. For this reason, the grey bars take account of variations in gender, age group, employment status, educational attainment, social class, household composition, ethnicity and region of residence. Considering the individual characteristics, the soup spoon effect is much reduced, suggesting the existence of a minimum level of participation, a floor rather than a ‘breakpoint’, below which participation does not fall. Rather than participation collapsing as Townsend anticipated, people necessarily have to maintain some basic level of consumption and engagement in society.
The unexpectedly high level of participation in the lowest vigintile remains after the introduction of controls and many studies have pointed to possible under-reporting of income in surveys, especially at the bottom of the income distribution (Brewer et al., Reference Brewer, O'Dea, Paull and Sibieta2009). Certainly, the lowest vigintile is very heterogeneous in composition, including the highest proportion of students (and young people) across all vigintiles, over 6 per cent of the self-employed (a proportion only exceeded among the richest 15% of the population), and the highest proportion of unemployed in the overall sample. The proportion of people receiving welfare benefits (the main income support and replacement benefits including JSA Income Support, disability benefits, tax credits and Housing Benefit) is correspondingly lower than might have been anticipated, lower than the following twelve vigintiles.
The downward pointing bars in Figure 2a differentiate between individuals receiving benefits and those who are not. They show that participation is generally much lower for benefit recipientsFootnote 8 than for other people on similar incomes and varies little except that participation is again unusually high in the lowest vigintile. There is slightly more variation among people who are on benefits, echoing the initial soup spoon, but nevertheless reinforcing the impression of a floor (at least for vigintiles 6, 5, 4 and 3). Figures 2b and 2c reveal a similar pattern for two of the component dimensions, lack of deprivation and social participation. It is important to recognise that incomes vary markedly across the range of the participation floor (Table 2A). Therefore, it is not that participation remains constant because incomes do not vary; rather rises or falls in income do not translate into measurable differences in participation.
Participation and its three dimensions are all strongly related to net equivalised income. That this is so is perhaps not surprising in a society with a strong individualistic tradition and an increasingly strong emphasis on consumption and consumerism as bases for social identity (Giddens, Reference Giddens1991; Slater, Reference Slater1997; Featherstone, Reference Featherstone2007). Certainly, many other studies tell a similar story (i.e. Menchik and Weisbrod, Reference Menchik and Weisbrod1987; Auslander and Litwin, Reference Auslander and Litwin1988; Brewer et al., Reference Brewer, O'Dea, Paull and Sibieta2009). As with the overall measure of participation, scores of social participation and trust recover slightly in the lowest vigintiles. While this might relate to income measurement (Brewer et al., Reference Brewer, O'Dea, Paull and Sibieta2009), this finding is consistent with the dense neighbouring networks found in some low income communities that are in turn associated with high levels of trust (Li et al., Reference Li, Pickles and Savage2005). The patterning of the coefficients suggests that the floor occur at a similar level in all three dimensions (Figures 2b–d); however, the relationship between income and trust is less linear than that for social participation and deprivation.
To summarise, the analysis indicates that participation as measured in this study is strongly associated with income as Townsend argued. However, there is a strong suggestion that there is a minimum level of participation, a floor rather than a ‘breakpoint’, which is characteristic of people on low incomes. The floor would seem to apply to the 30 per cent of the population and is lower for people reliant on the main income support and income replacement benefits.
(3) Mapping the determinants of participation
Participation is also closely associated with factors other than income. Women are more likely to score lower than men on the overall participation index due both to their lower social participation and because they are less trusting (Web appendix: Table 1A) (cf. Brehm and Rahm, Reference Brehm and Rahm1997). Participation is greatest among older people, those aged over fifty approaching the end of their working lives, and those over retirement age, especially if they have actually retired (Figure 3a). This pattern is reflected both in the lack of deprivation scores and in terms of social participation, and, since the analysis controls for other factors, appertains even when differences in income and education are taken into account. This phenomenon is probably linked to the accumulation of assets and friendships over the life-course (McDonald and Mair, Reference McDonald and Mair2010; Hills et al., Reference Hills, Bastagli, Cowell, Glennerster, Karagiannaki and McKnight2013), and increased participation in formal and informal associations made possible in later life by lower demands for childrearing and career building (Lader et al., Reference Lader, Short and Gershuny2005). Interestingly, people are equally trusting irrespective of age.

Figure 3. Effect of covariates other than income on participation (T-standardised)
The fact of being unemployed is associated with additional shortfalls in participation, notably deprivation and limited social participation (cf. Van Oorschot and Arts, Reference Van Oorschot and Arts2005). Similarly, people who are not employed because of disability or long-term health problems are also likely to have lower participation scores than their income alone would predict: they score high on deprivation, low on social participation and, unlike unemployed persons, low on levels of trust (Figure 3b). Consistent with other studies (Brewer, Reference Brewer, O'Dea, Paull and Sibieta2009), the self-employed and (especially) students also have higher overall levels of participation (Figure 3b).
Participation varies also with people's education (Figure 3c). Participation is highest among graduates and lowest among those without qualifications, with persons having A-levels or sub-degree level professional qualifications falling between graduates and people with GSCE's or their equivalent. This pattern is replicated for each dimension of participation such that one might speculate that there are three distinct modes of living demarcated first by possession of any qualifications and secondly by whether or not persons have a degree (Web appendix: Table 1A). Trust and social participation are in fact both more strongly related to educational attainment than they are to level of household income (Web appendix: Table 1A).
Class is still relevant to explain the variation of participation within British society, even if less important than income and education (Wright, Reference Wright1996). Persons engaged in ‘higher professional’ and ‘lower management and professional activities’ have the highest participation scores, followed by people in ‘intermediate occupations’, ‘small employers’ and people engaged in technical activities. Persons employed in routine and semi-routine occupations display the lowest levels of participation (Figure 3d).
Overall, participation is highest for pensioner couples, lowest for lone parents, single person households and couples with children, and somewhat less than average for single pensioners and other families with and without children (Figure 3e). This pattern is strongly driven by scores on deprivation but is echoed in social participation. A rather different profile is apparent with respect to trust, which is high among pensioner couples but also among single pensioners and single non-pensioners.
Finally, participation also varies by country and geographic region. In overall terms, participation is highest in Northern Ireland and the South East and lowest in Wales, the North East, Midlands and Greater London (Figure 3f). Once controls are introduced covering other socio-economic factors, Northern Ireland retains pole position (a result that echoes the findings of Ferragina (Reference Ferragina2012) using the European Value Survey and the Eurobarometer) followed by Scotland and the North West. The highest score in social participation in Northern Ireland is mainly determined by a higher interest in politics, suggested by Wright (Reference Wright1988) to be a possible lasting legacy of the Troubles.
(4) Participation among ethnic groups
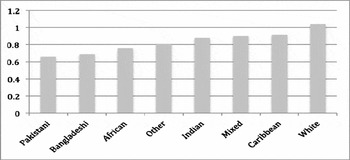
Including a measure of self-identified ethnicity in the regressions reveals differences in overall participation between ethnic groups (after considering the other socioeconomic factors). Overall participation is greatest among white respondents followed by people with a mixed background, and then respectively by those of Bangladeshi, Pakistani, Indian, Black African and Black Caribbean origin and finally by persons included as ‘Others’ (Figure 3g).
There are, however, differences between ethnic groups with respect to the three components of participation (Web appendix: Table 1A). Deprivation is statistically higher among all minority groups (with the exception of Indian respondents) than the white majority; it is particularly high among Africans, respondents of Black Caribbean descent and the heterogeneous grouping comprising other minority groups. Social participation is highest among white respondents, followed by people with a mixed ethnic background, and Bangladeshi, Pakistani, Africans and Indian respondents.Footnote 9 The lowest level of social participation can be found among Caribbean and the heterogeneous grouping comprising other minority ethnic groups. Trust is also generally lower among respondents from minority ethnic groups than among white respondents. However, after taking account of all other factors, the differences are quite small (Hooghe et al., Reference Hooghe, Reeskens, Stolle and Trappers2009) (Web appendix: Table 1A).
The literature on poverty and participation of ethnic minorities in Britain points in at least two directions to explain the lower level of participation of respondents from ethnic minorities if compared with white respondents. First, the way participation is measured might reflect the privileged forms of expression pursued by the white community and underestimate other forms of participation more prevalent among ethnic minorities. Participation is certainly value-based, categories of participation are socially constructed and might reflect the dominant vision of the majority (Cheong et al., Reference Cheong, Edwards, Goulbourne and Solomos2007; Orton, Reference Orton2006). Other research (Knapp and Smith, Reference Knapp and Smith1995) indicates that people from minority ethnic groups are generally less likely to volunteer than the white respondents but are more likely to participate as volunteers in community care work. This is true not only for minority respondents but also for people with lower income or educational attainments, and for women – all respondents that experience structural disadvantage in society.
Second, our measurement could reflect the ‘exclusivity’ of certain networks from which ethnic minorities might be excluded because of spatial segregation and other barriers to access. These barriers extend well beyond the socio-economic factors considered in our regression analysis and therefore might explain the additional negative effect on participation for being part of an ethnic minority. For example, white people, regardless of deprivation, tend to live in areas of low ethnic minority population (Dorsett, Reference Dorsett1998); these areas are apt to be more affluent and offer greater possibilities for participation than deprived areas in which people from minority ethnic backgrounds might live. Hudson and Netto (Reference Hudson and Netto2013) suggest additional barriers to the participation of minority ethnic groups including lower self-confidence, poor language skills, lack of leadership role models and limited organisational and institutional understanding of the differences of ethnic minorities, prejudice, stereotypes and, in the workplace, the under-recognition of their skills and experience. Taken together, these barriers may well constitute an ‘ethnic penalty’Footnote 10 additional to the adverse socio-economic conditions considered in our regression analysis. This ‘ethnic penalty’ varies markedly across different ethnic groups, being highest for respondents either designating themselves as ‘Black’ (African or Caribbean) or being assigned to the ‘other’ category and least for those of Bangladeshi and Pakistani backgrounds, the two groups with the lowest incomes (Figure 4; see Platt, Reference Platt2007; Palmer and Kenway, Reference Palmer and Kenway2007; Barnard and Turner, Reference Barnard and Turner2011, for additional empirical evidence). Heath and Demireva (Reference Heath and Demireva2014) link the lower participation of black groups to higher discrimination and a tendency among some, to reject British identity and the forms of participation identified with it.

In addition to our general regression model predicting participation and its sub-dimensions, the size of the sample means that it is possible to run separate analyses of the factors associated with participation for each of the larger ethnic groups. Doing so confirms that participation is related to income among all groups, although the floor effect is evident only for white respondents, those of mixed origin and those assigned to the other category (Web appendix: Table 3A). The experience of the white community, not surprisingly on account of its size, directly reflects the national figures: participation falls with income until around the sixth vigintile. For the other groups, though participation generally falls with income, the relationship is somewhat erratic, no doubt reflecting vigintile income estimates based on comparatively small samples (although group-specific vigintiles were constructed to minimise variation in sample size). However, when all minority ethnic groups are combined in order to boost our sample size,Footnote 11 a participation floor is apparent again (especially using a moving average to smooth vigintile variability). This floor extends to the ninth rather than the sixth vigintile as in the case of white respondents, but the absolute income at which the floor ends is almost exactly the same. More specifically, the level below which participation reaches a floor is £870 per month (measured as equivalised household income) for the combined ethnic minority group, £887 for white respondents and £851 for the overall sample. When benefits are considered the participation floor is reached at £789 for the combined ethnic minority group respondents, at £763 for the white respondents and at £741 for the overall sample (Table 2a).
One might argue that these findings seem to identify, taking into account the multi-ethnic nature of British society and our relative measure of participation, a point in the income distribution below which participation consistently reaches a floor. This point in the income distribution is consistently lower for respondents who receive benefits.
To summarise, participation for people self-identified as part of minority groups tend to have a lower participation than white respondents, even when accounting for their lower socio-economic status. Furthermore, participation also falls with income for ethnic minorities but the relationship has a less linear pattern than for white people, and it is sometimes more irregular in its decline. However, despite this fact, the floor (and the absolute income level below which participation reaches the floor) detected for the overall population is replicated when combining all respondents from ethnic groups.
Conclusion
We used Understanding Society data and SEM, to expand Peter Townsend's seminal work taking into account the intrinsic multi-dimensional nature of participation, its main socio-economic determinants and the growing ethnic diversity of British society. Townsend argued that the consequence of poverty was to prevent people from fully engaging in society and that participation fell as income declined until a point when financial constraints were so severe that participation collapsed. Our findings show that participation generally declines with income but then, rather than collapsing as suggested by Townsend, participation reaches a floor below which it ceases to reduce.
We do not see our work as constituting a formal test and therefore refutation of Townsend's hypothesis but rather as a development of his thinking. The existence of a floor is consistent with other evidence of little change in measured deprivation in the lowest third of the income distribution (Brewer et al., Reference Brewer, O'Dea, Paull and Sibieta2009). However, it extends the range of participation for which this appears to be true and opens discussion as to why this should be so and with what effects. In terms of material deprivation, given evidence that people on low incomes are forced to choose between ‘essentials’, additional income may be spent filling gaps in possessions not included in the selective lists used in surveys or on increasing their quality. With regard to social participation, people are bound by social obligations and expectations that they continue to try to fulfil, although not always successfully or without cost in terms of effort and self-esteem (Walker, Reference Walker2014).
It is important to add that education is also a powerful factor alongside income in demarcating levels of participation, especially social participation (cf. Huang et al., 2009), and that the floor to participation seems also apparent when combining all ethnic minoritiesFootnote 12 into one group (in order to boost sample size). Furthermore, participation tends to be lower among respondents from major minority ethnic groups even when socio-economic factors are taken into account. We suggest two explanations for this finding; namely that our measures of participation, like those of others, privileges forms of participation favoured by the majority white population and that people belonging to minority ethnic groups may face a structural ‘ethnic penalty’ inhibiting access to privileged forms of participation.
It is too early though in the life of the Understanding Society study to arrive at definitive statements about the relation between income and participation. The income variable currently available, net household income, does not fully equate to the measure used in Britain's official income distribution statistics previously based on the British Household Panel Survey (Levy and Jenkins, Reference Levy and Jenkins2012), and additional diagnostic fieldwork is needed to determine the characteristics and circumstances of people with incomes in the lowest vigintile. Furthermore, literature over the past four decades demonstrates that simple cross-sectional counts of poverty can be misleading; poverty is more of a process than a state, with rapid and sometimes large fluctuations in incomes and needs adding an often unpredictable dynamic that causes most spells of poverty to be brief but others to be long (Jenkins, Reference Jenkins2011).
Taking into account these limitations, it is still evident that most people's ability to sustain their lifestyle and to participate socially comes under threat at around the 13th vigintile creating a participation floor that seems to demarcate a major divide in British society. The floor begins around the point in the income distribution when the benefit system starts to contribute substantially to people's incomes but is not entirely rigid or uniform. For example, it is lower for recipients of social security benefits mainly on account of the greater material deprivation that they experience. For those on the floor, participation is severely constrained with people negotiating a zero-sum world in which spending on one area means reduction in another. Whereas for those above the floor, additional income translates into more evident consumption, greater social participation and trust; for those on the floor it means a slight easing of pressure, but no major change in lifestyle sufficient to be identified in survey evidence.
If the existence of this floor is confirmed, the implications for policy and our understanding of society are profound. Much policy, notably the new Universal Credit that was the flagship policy of the past Coalition Government, seeks to maximise work incentives premised on the notion that additional income brings rewards for individuals in terms of higher living standards, and benefits society through greater consumption and a shared work ethic. Similarly, as emphasised by Lansley and Mack (Reference Lansley and Mack2015), New Labour during the period 1997–2010 (despite trying to tackle child poverty) intervened mainly through more generous and wide-ranging tax-credits rather than fighting poverty and inequality at source (Ferragina and Arrigoni, forthcoming).
The floor implies that even if the incomes of the poorest third of the population do increase, they do not translate into measurably higher living standards in terms of participation. It should be stressed that this is not just a restatement of the poverty trap, the phenomenon of higher gross incomes not being translated into commensurate increases in net incomes due to the combined effects of taxation and the withdrawal of means-tested benefits. The effect of the floor is additional to the poverty trap such that measurable benefits of greater income, achieved through work or otherwise, that are enjoyed by most people in British society and which fuel capitalist consumption and production, simply do not materialise for those on the lowest incomes.
It follows that people on either side of the participation floor experience very different incentive structures. Hence, the rhetoric used to cajole people to move out of benefit, namely ‘you'd be better off’, has no purchase on the lives of the people targeted. Moreover, the commonly heard language of ‘us’ and ‘them’ that is echoed in political discourse (Baumberg et al., Reference Baumberg, Bell and Gaffney2012; Ferragina and Arrigoni, forthcoming; Hutton, Reference Hutton2010; Lister, Reference Lister2004) may reflect different social realities created by the participation floor. The ‘them’ – be they the ‘haves’ or the ‘have nots’ – are each thought by the other to be different, uncomprehending, irrational or perverse in their behaviour. This gulf in understanding may reflect different experiences tantamount to people living and participating in different worlds – indeed divided worlds.
Acknowledgments
This work was supported by the Joseph Rowntree Foundation (for the project ‘Poverty Participation and Choice: The Legacy of Peter Townsend’) and by a public grant overseen by the French National Research Agency (ANR) as part of the “Investissements d'Avenir” program LIEPP (reference: ANR-11-LABX-0091, ANR-11-IDEX-0005-02).
Supplementary material
To view supplementary material for this article, please visit http://dx.doi.org/10.1017/S1474746416000440.