


Introduction
Perennial cropping systems are increasingly studied for their capacity to balance provisioning services—such as biofuel, forage and food products—with regulating and supporting services—such as carbon sequestration and enhanced nutrient cycling (Werling et al., Reference Werling, Dickson, Isaacs, Gaines, Gratton, Gross, Liere, Malmstrom, Meehan, Ruan, Robertson, Robertson, Schmidt, Schrotenboer, Teal, Wilson and Landis2014; Crews and Rumsey, Reference Crews and Rumsey2017). Currently, less than 20% of global cropland is occupied by perennial crops (Cox et al., Reference Cox, Glover, Van Tassel, Cox and DeHaan2006). The annual crops that dominate cropland are only grown for a portion of the year, exposing soils to potential erosion from water and wind. In contrast, perennial crops provide year-round soil cover and can have greater net primary productivity than annuals (Jarchow and Liebman, Reference Jarchow and Liebman2013) as they capture more photosynthetic radiation over the course of a year (Crews and DeHaan, Reference Crews and DeHaan2015). This greater net primary productivity of perennial systems is used to support belowground structures, which can result in enhanced carbon sequestration (Lal, Reference Lal2004; Crews and Rumsey, Reference Crews and Rumsey2017), microbial community diversity (Culman et al., Reference Culman, DuPont, Glover, Buckley, Fick, Ferris and Crews2010) and nutrient cycling (Crews, Reference Crews2005). Even in small, targeted areas, native perennial cropping systems can provide multiple economic and ecosystem benefits when strategically integrated into croplands dominated by summer annual crops (Schulte et al., Reference Schulte, Niemi, Helmers, Liebman, Arbuckle, James, Kolka, O'Neal, Tomer, Tyndall, Asbjornsen, Drobney, Neal, Van Ryswyk and Witte2017).
Soil carbon sequestration is an opportunity for agriculture to mitigate climate change and promote soil fertility, further supporting food production and environmental quality (Lal, Reference Lal2004; Powlson et al., Reference Powlson, Gregory, Whalley, Quinton, Hopkins, Whitmore, Hirsch and Goulding2011). Increased carbon storage of perennial cropping systems may be maximized by increasing species and functional group diversity (Fornara and Tilman, Reference Fornara and Tilman2008). For example, adding C4 grasses and legumes increased carbon sequestration by 193 and 522% compared to monocultures of native perennial plants in a 12-year study in Minnesota, USA (Fornara and Tilman, Reference Fornara and Tilman2008). Additionally, grasslands with a greater number of species from diverse functional groups may have greater net primary productivity (Loreau et al., Reference Loreau, Naeem, Inchausti, Bengtsson, Grime, Hector, Hooper, Huston, Raffaelli, Shmid, Tilman and Wardle2001), which can potentially result in carbon sequestration. While the relationship between diversity and productivity has been studied in native perennial systems, limited research has been conducted on carbon dynamics in agricultural land converted from annual crops to perennial polycultures. Managed perennial cropping systems can function differently than natural systems in response to plant diversity. For example, while greater species richness can lead to greater aboveground biomass in unmanaged systems (Loreau et al., Reference Loreau, Naeem, Inchausti, Bengtsson, Grime, Hector, Hooper, Huston, Raffaelli, Shmid, Tilman and Wardle2001), less diverse systems in an agronomically managed context, particularly switchgrass (Panicum virgatum L.) monocultures, have been shown to yield similar or more aboveground biomass than higher diversity plantings (Zilverberg et al., Reference Zilverberg, Johnson, Owens, Boe, Schumacher, Reitsma, Hong, Novotny, Volke and Werner2014; Jungers et al., Reference Jungers, Clark, Betts, Mangan, Sheaffer and Wyse2015a). These findings are particularly relevant for the multifunctionality of managed lands because increased aboveground biomass is not just an indicator of greater provisioning services such as harvestable material—it can also imply greater regulating and supporting services such as carbon storage (Ferchaud et al., Reference Ferchaud, Vitte and Mary2016).
Soil microbial parameters are useful for integrating plant diversity/productivity with soil carbon storage potential for several reasons. Soil microbial biomass C (MBC) and microbial activity are often more responsive to agricultural management activities compared to slow-changing, recalcitrant C pools and can therefore be used as early indicators of soil organic matter change (Joergensen et al., Reference Joergensen, Anderson and Wolters1995; Mohammadi et al., Reference Mohammadi, Heidari, Khalesro and Sohrabi2011). Various extracellular enzymes can be measured in soils to estimate specific soil microbial nutrient acquisition and decomposition activity. For example, soils with high levels of chitinase are expected to contain microbes active in N acquisition (Steinauer et al., Reference Steinauer, Tilman, Wragg, Cesarz, Cowles, Pritsch, Reich, Weisser and Eisenhauer2015). In addition to being sensitive to management on a short-term basis, microbial biomass and extracellular enzyme activities (EEA) are sensitive to changes in plant diversity and have been used to understand how plant species richness alters belowground activity. For example, in native prairies, plant diversity was positively correlated with cellobiohydrolase and 1,4-N-acetylglucosaminidase (Chung et al., Reference Chung, Zak, Reich and Ellsworth2007). Similarly, increasing plant diversity in perennial systems increases soil microbial biomass (Wardle et al., Reference Wardle, Bonner and Nicholson1997; Thakur et al., Reference Thakur, Milcu, Manning, Niklaus, Roscher, Power, Reich, Scheu, Tilman, Ai, Guo, Ji, Pierce, Ramirez, Richter, Steinauer, Strecker, Vogel and Eisenhauer2015; Chen et al., Reference Chen, Chen, Chen and Huang2019). Recent efforts to understand the mechanisms of soil carbon accumulation suggest that microbial biomass and extracellular enzyme pools are not only more responsive to short-term management, but may even be important drivers of increased soil organic carbon storage (Dwivedi et al., Reference Dwivedi, Tang, Bouskill, Georgiou, Chacon and Riley2019; Robertson et al., Reference Robertson, Paustian, Ogle, Wallenstein, Lugato and Cotrufo2019). For example, microbially-derived compounds assist in the association of organic matter to soil mineral particles to form a relatively persistent organic matter pool (Cotrufo et al., Reference Cotrufo, Ranalli, Haddix, Six and Lugato2019). Taken together, a broader analysis of species composition effects on microbial biomass and activity across different environments may provide greater insight regarding whether species composition leads to greater carbon storage in perennial agricultural systems.
Nitrogen (N) fertilization of perennial grassland bioenergy crops can increase productivity (Jungers et al., Reference Jungers, Sheaffer and Lamb2015b) and affect soil microbial biomass and EEA (Li et al., Reference Li, Jian, de Koff, Lane, Wang, Mayes and Hui2018; Yuan et al., Reference Yuan, Duan, Li, Jian, Gamage, Dzantor, Hui and Fay2020). In a meta-analysis of various terrestrial ecosystems, Jian et al. (Reference Jian, Li, Chen, Wang, Mayes, Dzantor, Hui and Luo2016) showed that N fertilization increased hydrolase activities which were positively associated with soil organic carbon. However, N fertilization at rates exceeding N removal with crop harvest has been linked to declines in soil C within annual crop rotations (Khan et al., Reference Khan, Mulvaney, Ellsworth and Boast2007). N fertilization can also reduce plant diversity in prairie plant communities (Isbell et al., Reference Isbell, Reich, Tilman, Hobbie, Polasky and Binder2013), thus imparting an indirect effect on soil microbes and carbon dynamics (Revillini et al., Reference Revillini, Wilson, Miller, Lancione and Johnson2019). Quantifying the effects of N fertilization on soil microbial biomass and EAA across different plant species mixtures and locations varying in edaphic and climatic conditions can result in more accurate expectations of soil carbon dynamics across space.
Plant productivity, soil microbial biomass and activity, and soil carbon are important characteristics in perennial agricultural systems and may be influenced by plant species diversity and N fertilization. Our objective was to determine the effects of plant species diversity and composition (i.e., the number of species and functional groups of sown species in mixtures) and N fertilization on soil MBC, EEA, soil C change, and aboveground biomass productivity 11–12 years after the establishment of native prairie plant mixtures managed for bioenergy feedstock production. We hypothesized that increased plant species diversity and N fertilization would increase biomass yield and soil organic C by modulating soil physical and microbial parameters.
Materials and methods
Site description and experimental design
Data were collected from an existing perennial bioenergy cropping study established in 2006 and 2007 at Roseau, Becker, Lamberton and Waseca, Minnesota (Table 1). Details on field preparation, species selection and seeding rates for mixtures, and seedling establishment are described by Mangan et al. (Reference Mangan, Sheaffer, Wyse, Ehlke and Reich2011). Treatments were arranged in a randomized complete block design with split plots and three replications per location. Main plots were fertilized with either 0 or 67 kg N ha−1 yr−1 by manually broadcasting ammonium nitrate each spring starting in 2008. Species mixture treatments were applied as sub plots and included switchgrass monoculture (SG), four-species grass mixture (GM), an eight-species legume/grass mixture (LG) and a 24-species legume/grass/forb mixture (HD). A list of individual species in each mixture is in Table S1. After sowing seeds for each species in the mixture treatments in June of 2006 for Becker, Lamberton and Waseca and 2007 for Roseau, the plant communities were not altered except for localized termination of perennial weeds [e.g., Cirsium arvense (L.) Scop]. All standing biomass was removed annually after senescence.
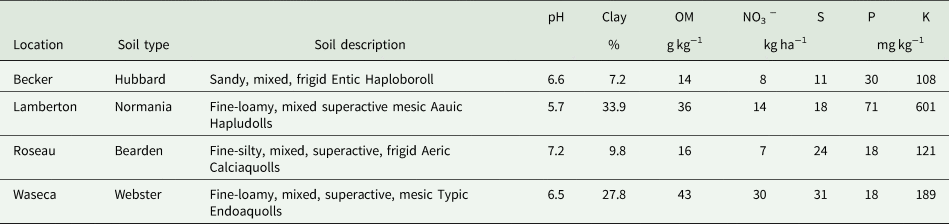
Table 1. Soil characteristics from 0 to 30.5 cm of the research locations prior to sowing perennial crop treatments in 2006 (Becker, Lamberton, Waseca) or 2007 (Roseau); summarized from Mangan et al. (Reference Mangan, Sheaffer, Wyse, Ehlke and Reich2011).
Plant diversity and aboveground biomass
Plant community composition was assessed annually from establishment to 2013 and in 2017 by recording the species identity and relative abundance as the percent ground cover occupied by each species in each plot. Species diversity was quantified using the Shannon diversity index (H`), where pi is the proportion of species i based on percent cover. Aboveground biomass was measured by harvesting biomass to a height of 5 cm from two randomly placed 0.25-m2 quadrats in each plot in October (following a killing frost of −2°C) in 2017. Biomass was dried at 60°C until constant moisture before weighing. Details on biomass harvest procedures can be found in Jungers et al. (Reference Jungers, Clark, Betts, Mangan, Sheaffer and Wyse2015a).
Soil collection and total soil carbon analysis
Data from soil sampling events during an initial baseline sampling in 2006–2007, a sampling from 2013 and a sampling in 2017 were used for this analysis. Baseline soil was collected at all sites in 2006 (southern sites including Becker, Lamberton and Waseca) and 2007 (Roseau) from 0 to 30 cm before initial site preparation or seeding (Mangan et al., Reference Mangan, Sheaffer, Wyse, Ehlke and Reich2011).
Soil was collected in 2013 using a hydraulic soil probe (Giddings Machine Company, Inc., Colorado, USA) at all sites except Roseau (Jungers et al., Reference Jungers, Clark, Betts, Mangan, Sheaffer and Wyse2015a). Two 2.5-cm diameter cores were excavated from each plot, partitioned into 0–15, 15–30 and 30–60 cm depth intervals, and homogenized by depth interval in the field. Soil was dried at 60°C until constant weight prior to total C analysis.
Soil was collected in October 2017 using a hydraulic soil probe to a depth of 60 cm. Two cores from each plot, partitioned into 0–15, 15–30 and 30–60 cm depth intervals, were homogenized by depth interval in the field. A subsample of each depth was immediately frozen for extracellular enzyme analysis, and a subsample was kept at 4°C until microbial biomass could be determined. A subsample was also dried at 60°C until constant weight prior to total C analysis. Carbonates were measured with a 1 M HCl acid test. Total soil carbon C was determined using combustion analysis. Samples from 2017 were analyzed on an Elementar pyrocube (Elementar Americas, Inc., Ronkonkoma, NY, USA), with previous samples analyzed in a similar manner (Mangan et al., Reference Mangan, Sheaffer, Wyse, Ehlke and Reich2011; Jungers et al., Reference Jungers, Eckberg, Betts, Mangan, Wyse and Sheaffer2017).
Microbial biomass carbon
MBC was determined by direct chloroform extraction using 0.5 M K2SO4 (Gregorich et al., Reference Gregorich, Wen, Voroney and Kachanoski1990; McDaniel and Grandy, Reference McDaniel and Grandy2016). For each soil sample, pairs of 10 ± 0.05 g sieved (4 mm) subsamples were weighed into 70 ml acid-washed test tubes. Gravimetric soil moisture was determined on a third 10 g sieved sample. In one sample from each pair, 1.0 ml chloroform was added, followed by the addition of 40 ml 0.5 M K2SO4 to both samples of each pair. All samples were then shaken at 250 rpm on an oscillating shaker for 4 h. After sediment settled, the supernatant was poured through rinsed #42 filters into acid-washed specimen cups, then transferred into labeled, unused scintillation vials. Extracts were immediately frozen until later analyzed on a TOC analyzer (TOC-V-CPN; Shimadzu Scientific Instruments Inc., Columbia, MD, USA) that determines the carbon concentration (ppm) of each extract. Microbial C was then calculated by subtracting baseline values from values for fumigated samples and taking the soil mass into account. Microbial C is then reported as mg C kg soil−1 (dry mass equivalent). Vials containing extracts from the Becker location were broken, and the entire site was extracted again from frozen soil. Although determining soil microbial biomass from frozen soil is not recommended, it has been shown that there is no difference in microbial biomass determined on frozen vs fresh soil in conditions similar to ours (Winter et al., Reference Winter, Zhang, Tenuta and Voroney1994).
Extracellular enzyme activity
Soil for analysis of EEA was kept frozen until the day of the assay. To determine EEA, the protocol outlined by German et al. (Reference German, Weintraub, Grandy, Lauber, Rinkes and Allison2011) was followed. In short, 0.5 ± 0.01 g soil was added to 50 ml of 50 mM pH 6.0 tris buffer. The soil slurry was sonicated and shaken vigorously immediately before 200 μl of slurry was added to 96-well plates in eight replicate wells. The activities of β-glucosidase (BG), N-acetyl-glucosaminidase (NAG), cellobiohydrolase (CBH) and acid phosphatase (PHOS) were determined by adding 50 μl of 4-methylumbelliferone linked enzyme substrates at saturating concentrations based on pre-optimization testing before the actual assay was performed (German et al., Reference German, Weintraub, Grandy, Lauber, Rinkes and Allison2011). Controls and standards included tris buffer alone (blank), substrate or soil slurry with tris buffer (negative controls), 4-methylumbelliferone with soil slurry (quench standards) and 4-methylumbelliferone with buffer (reference standards). After an hour of incubation at room temperature, 10 μl of NaOH solution was added to each well. Fluorescence was measured 1 min after NaOH addition on a microplate reading fluorometer with excitation filters at 365 and 450 nm. EEA was calculated as nmol substrate cleaved (as determined by converting fluorescence units using a reference standard curve) per gram of soil (oven dry equivalent) per hour.
Statistical analysis
Data were analyzed using linear mixed-effects models. Species mixture and N treatments were considered fixed categorical effects, and because of the split-plot design, N fertilization was also considered a random effect nested within block to account for pseudo-replication. Data from each location were analyzed separately because of differences in establishment year, soil types and weather. Statistical tests that included location as a fixed effect—along with all possible interactions between location and species mixture and N treatments—were conducted ad hoc to quantitatively compare treatment effects across space. F-tests were used to determine the statistical significance of fixed effects and their interactions using α = 0.05. Post-hoc mean comparisons were tested based on Tukey-adjusted P values to identify significant differences between levels of fixed effects. Pearson's correlation coefficients were calculated to determine relationships between plant community metrics (aboveground biomass and H`) and final total soil C, and EEA. For correlation coefficients between any plant community variable and soil variable > 0.5, a linear mixed-effects model was conducted to determine the direction and magnitude of the relationship. Statistical analysis was conducted in R using the nlme package (R Development Core Team, 2018; Pinheiro et al., Reference Pinheiro, Bates, DebRoy and Sarkar2019).
Results
Effects of planted species richness and N fertilization on plant species diversity and aboveground biomass
The Shannon diversity index (H`) varied by species mixture treatments only at the Waseca and Roseau locations. At Waseca, the SG treatment was more diverse (mean = 1.23, s.e. = 0.57) than the GM treatment (mean = 0.06, s.e. = 0.15), while all other treatments had similar H` (Table 2). At Roseau, H` of the HD treatment (mean = 0.65, s.e. = 0.12) was similar to the GM (mean = 0.76, s.e. = 0.10) but lower than the GL (mean = 1.30, s.e. = 0.14) and SG treatments (mean = 1.28, s.e. = 0.15). The three most abundant species based on percent cover for each treatment combination are presented in Supplemental Table S2.
Table 2. ANOVA significance results (P-values) by site for aboveground biomass (AB), microbial biomass carbon (MBC), final soil pH, phosphorus (P) and potassium (K) at 0–15 cm, final (2017) total soil carbon at four depths (0–15, 15–30, 30–60, 60–90 cm), change in total soil carbon from 2013 to 2017 at four depths (0–15, 15–30, 30–60, 60–90 cm) and the activity of β-glucosidase (BG), cellobiohydrolase (CBH), N-acetylglucosaminidase (NAG), phosphatase (PHOS)
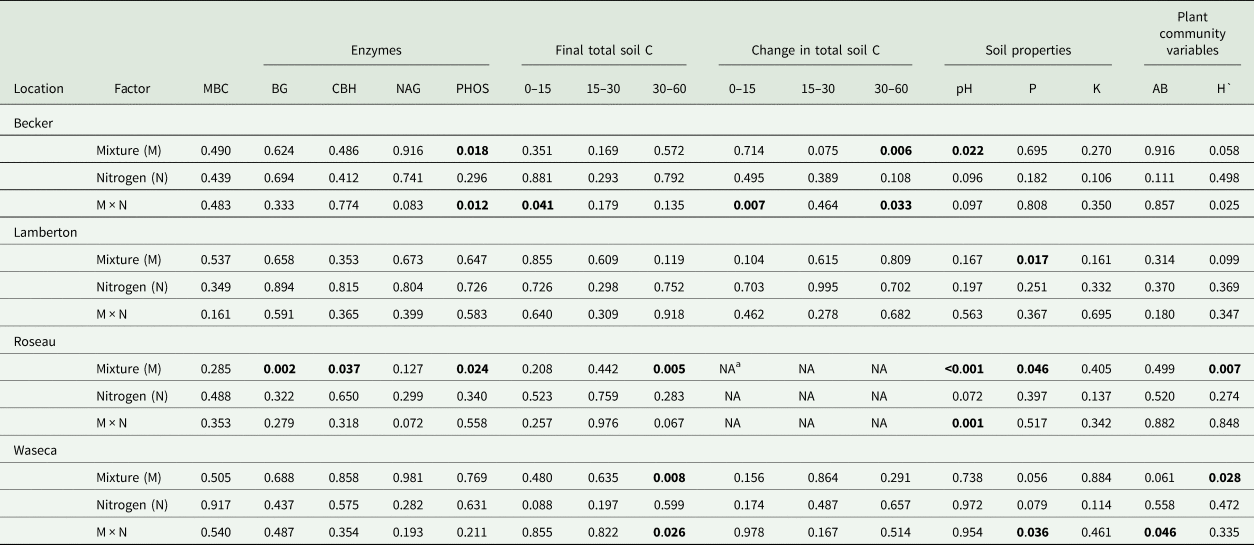
a No soil collected at Roseau in 2013, therefore change in soil C not reported. P-values in bold text are significant 0.05.
At Waseca, biomass yield was affected by the interaction between species mixture and N fertilizer treatments (Table 2). A means comparison test of all combinations of species mixture and N fertilizer treatments showed that the unfertilized HD treatment yielded significantly more biomass (mean = 972.1 g m−2, s.e. = 143.7) compared to the unfertilized GM treatment (mean = 237.1 g m−2, s.e. = 83.9). Aboveground biomass yield was not affected by species mixture or N fertilization treatments at Becker, Lamberton or Roseau where yields averaged 561.0 (s.e. = 39.9), 479.2 (s.e. = 50.2) and 530.4 (s.e. = 72.8) g m−2, respectively.
Effects of planted species richness and N fertilization on MBC and EEA
Species mixture and N fertilization treatments did not affect soil MBC at any location (Table 2) and averaged 993.7 (s.e. = 642.3), 318.5 (s.e. = 20.8), 1078.7 (s.e. = 285.2) and 113.1 (s.e. = 19.5) mg C kg soil−1 at Becker, Lamberton, Roseau and Waseca, respectively. At Roseau, species mixture treatments had a significant effect on BG, CBH and PHOS enzyme activity levels (nmol g soil−1 h−1). The HD treatment had higher rates of BG than all other species mixture treatments, and higher CBH and PHOS activities compared to the GM treatment (Table 3). Nitrogen fertilization did not affect any enzyme activities (Table 2). Soil enzyme activities were not affected by either treatment at Lamberton or Waseca.
Table 3. Mean and standard error of the mean (s.e.) of β-glucosidase (BG), cellobiohydrolase (CBH) and phosphatase (PHOS) soil enzyme activity (nmol g soil−1 h−1 at the 0–15 cm soil depth interval in the switchgrass (SG), four-species grass mixture (GM), eight-species legume–grass mixture (LG) and high diversity (HD) species mixture treatments at Roseau, MN
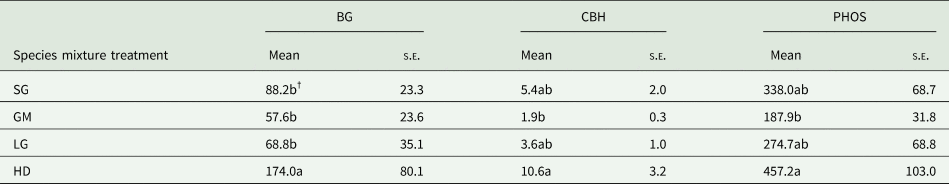
NAG activities were unresponsive to treatment and not included in this table (see Table 2).
†Means followed by the same letter within a column are not significantly different.
Species mixture treatments and the interaction between species mixture and N fertilization affected PHOS at Becker (Table 2), where only fertilized species mixture treatments affected PHOS levels. Fertilized SG had higher PHOS (mean = 230.0; s.e. = 28.0) than the fertilized HD (mean = 67.5; s.e. = 18.7) and fertilized LG treatments (mean = 103.0; s.e. = 12.9). Average PHOS activity of the unfertilized treatments at Becker was 113 nmol g soil−1 h−1 (s.e. = 33.1). There were no treatment effects on NAG activity.
Effects of planted species richness and N fertilization on total soil C
At Becker there was a significant species mixture by N fertilization interaction for total C at 0–15 cm (Table 2); however, a means comparison test did not show significant differences. At Roseau and Waseca, species mixture effects were significant at the 30–60 cm depth. At Roseau, total soil C was greater in the GM and LG treatments compared to SG, and all three were similar to the HD treatment (Fig. 1). At Waseca, there was a significant interaction between species mixture and N fertilization treatments where the fertilized GM treatment had greater total soil C compared to the fertilized LG treatment but no other treatments were significantly different (Table 2; Fig. 2).
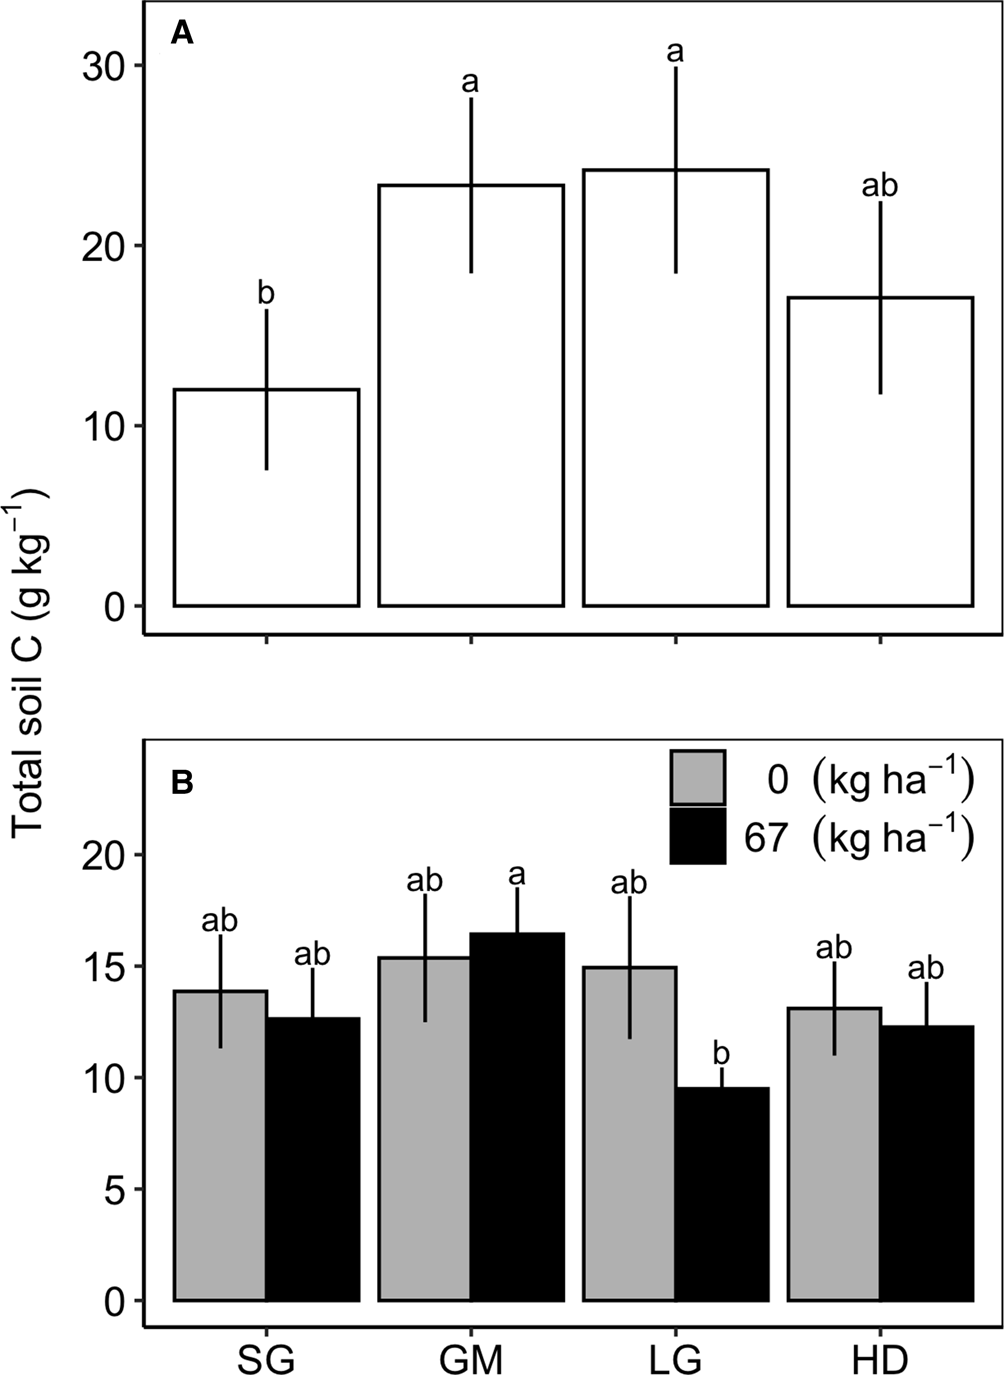
Fig. 1. Total soil carbon (C) in the 30–60 cm in the switchgrass (SG), four-species grass mixture (GM), eight-species legume–grass mixture (LG) and the 12-species high-diversity mixture (HD) at Roseau (A) and Waseca (B), MN. Mixture means are averaged over N fertilizer rates (0 or 67 kg N ha−1) at Roseau and the mixture by N fertilizer rate interaction is shown for Waseca.
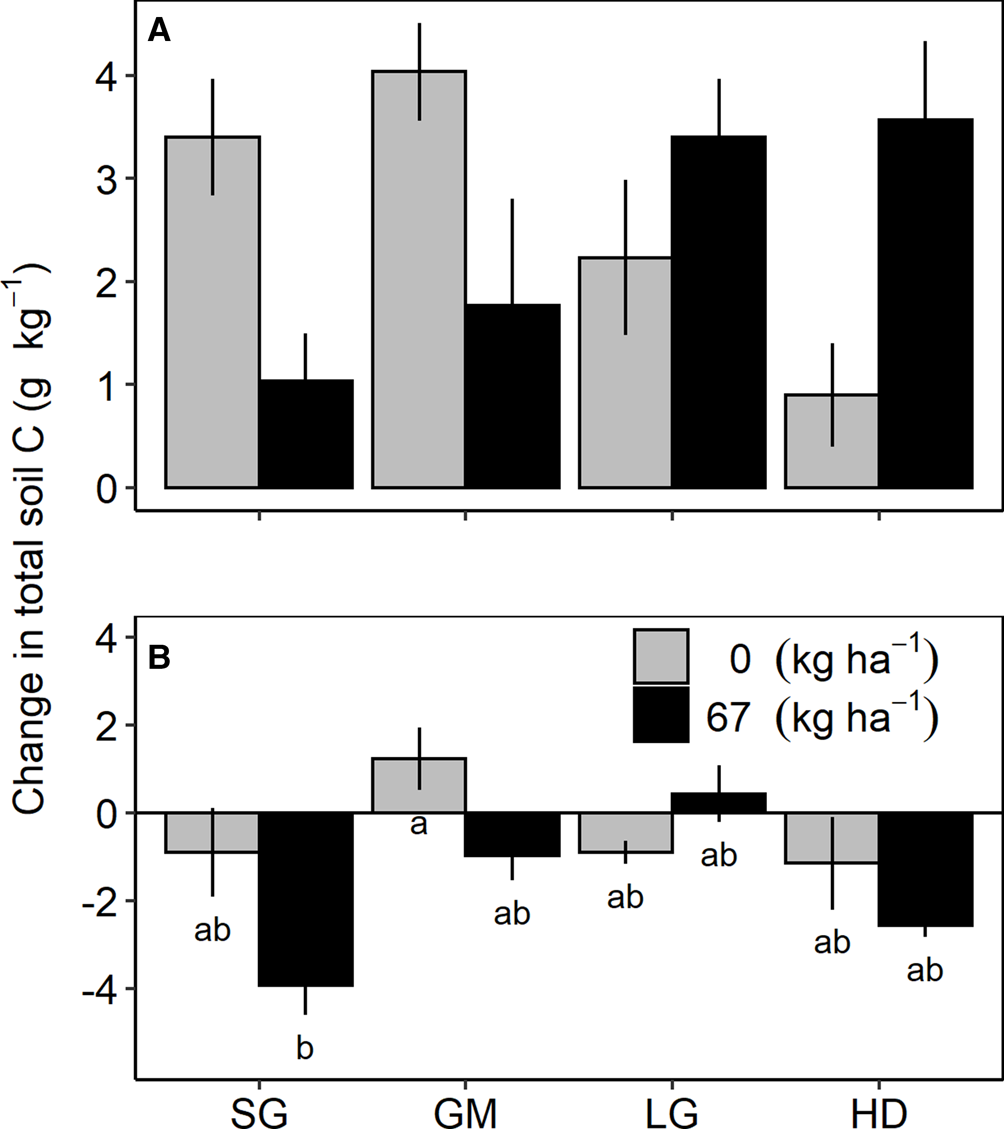
Fig. 2. Change in total soil carbon (C) from 2013 to 2017 in the 0–15 cm (A) and 30–60 cm (B) soil profiles in the fertilized (67 kg N ha−1) and unfertilized (0 kg N ha−1) switchgrass (SG), four-species grass mixture (GM), eight-species legume–grass mixture (LG) and the 12-species high-diversity mixture (HD) at Becker, Minnesota.
Treatment effects on the change in total soil C from the last soil sampling event (2013) to the end of the study (2017) only occurred at Becker (Table 2). At the 0–15 cm depth interval, there was an interaction between species mixture and N fertilization treatments; however, mean comparison tests did not indicate significant differences between any species mixture/N fertilizer treatment combinations (Fig. 2A). At the 30–60 cm depth, a species mixture by N fertilization interaction occurred due to a reduction in total soil C in the fertilized SG, which was different from the positive accrual of total soil C in the unfertilized GM (Fig. 2B).
Effects of planted species richness and N fertilization on soil chemical properties
There were significant effects of species mixture and the species mixture by N fertilizer interaction on soil pH at Becker and Roseau, but the treatment effects were inconsistent over the two locations (species mixture × site F-value = 2.176, P = 0.037; Table 2; Fig. 3). At Becker, the LG treatment had a lower pH than the HD treatment, while the GM and LG treatments had a higher pH than the SG and HD treatments. At Roseau, the SG and HD treatments had a lower pH than the GM and LG treatments. The interaction between species mixture and N fertilizer at Roseau resulted in a significant difference between the fertilized SG (mean = 6.4, s.e. = 0.23) and unfertilized LG (mean = 7.4, s.e. = 0.15).
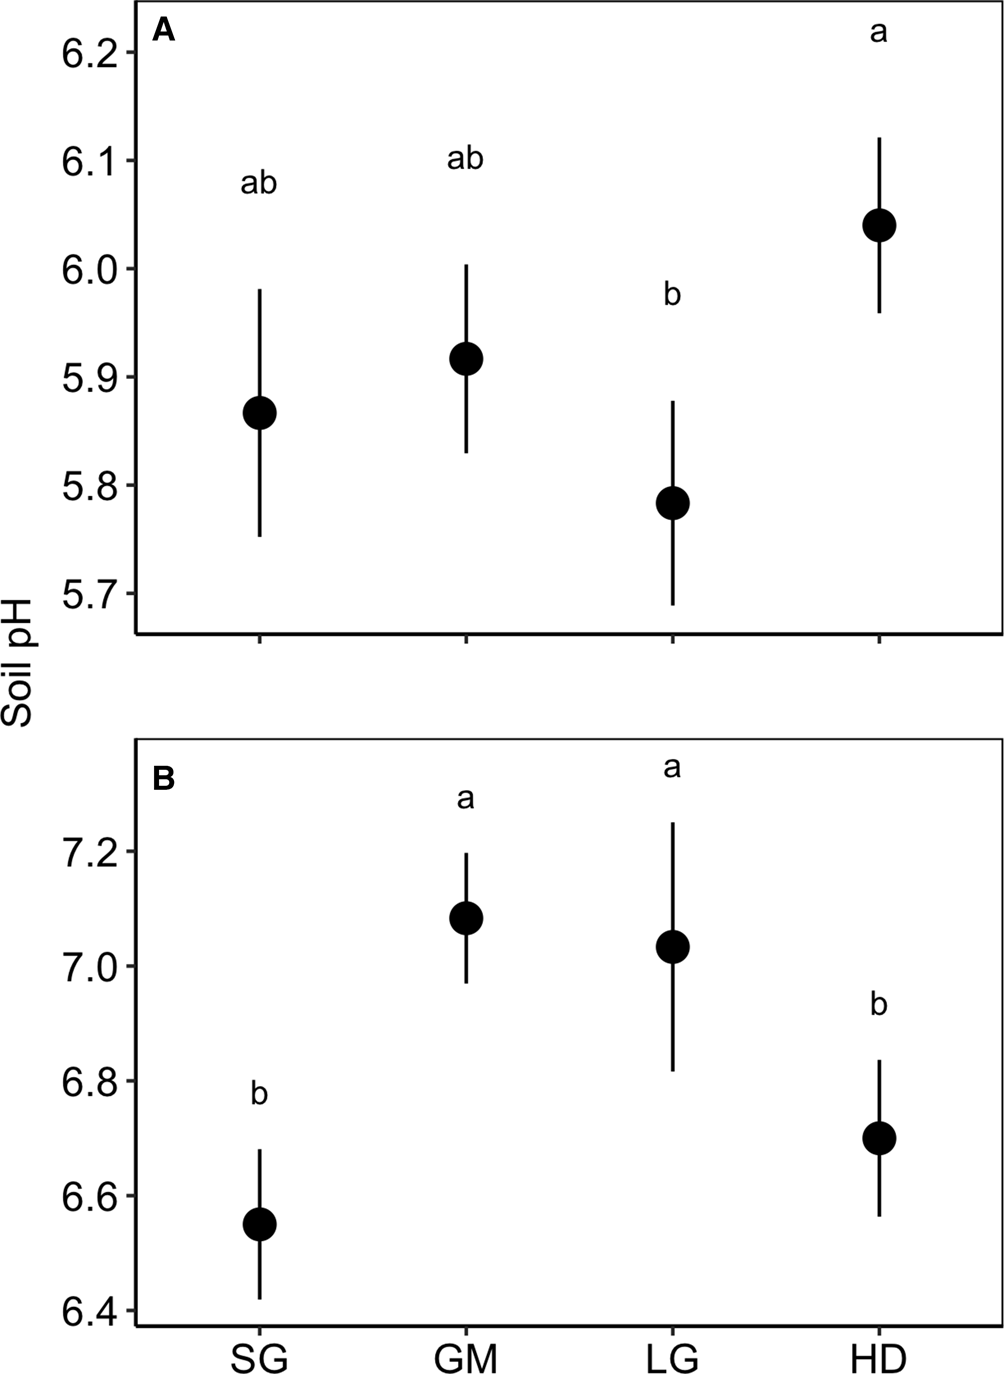
Fig. 3. Soil pH in the top 0–15 cm in the switchgrass (SG), four-species grass mixture (GM), eight-species legume–grass mixture (LG) and the 12-species high-diversity mixture (HD) at Becker (A) and Roseau (B), Minnesota. Means are averaged over nitrogen fertilizer rates.
Species mixture treatment had a significant effect on soil P at Lamberton and Roseau and interacted with N fertilization at Waseca (Table 2). At Lamberton, soil P was lowest in the HD treatment (mean = 28.0 ppm, s.e. = 3.0) compared to the GM (mean = 35.2 ppm, s.e. = 5.3) and SG (mean = 36.8 ppm, s.e. = 5.0). At Roseau, soil P was lowest in the SG (mean = 2.0 ppm, s.e. = 0.2), compared to the LG and HD (same mean = 2.17 ppm, s.e. = 0.2), with the highest soil P in the GM (mean = 2.67 ppm, s.e. = 0.3). At Waseca, unfertilized SG had the highest soil P (mean = 13.3 ppm, s.e. = 1.3) compared to the unfertilized LG (mean = 5.7 ppm, s.e. = 0.9). There were no treatment effects on soil K.
Correlation analysis of response variables
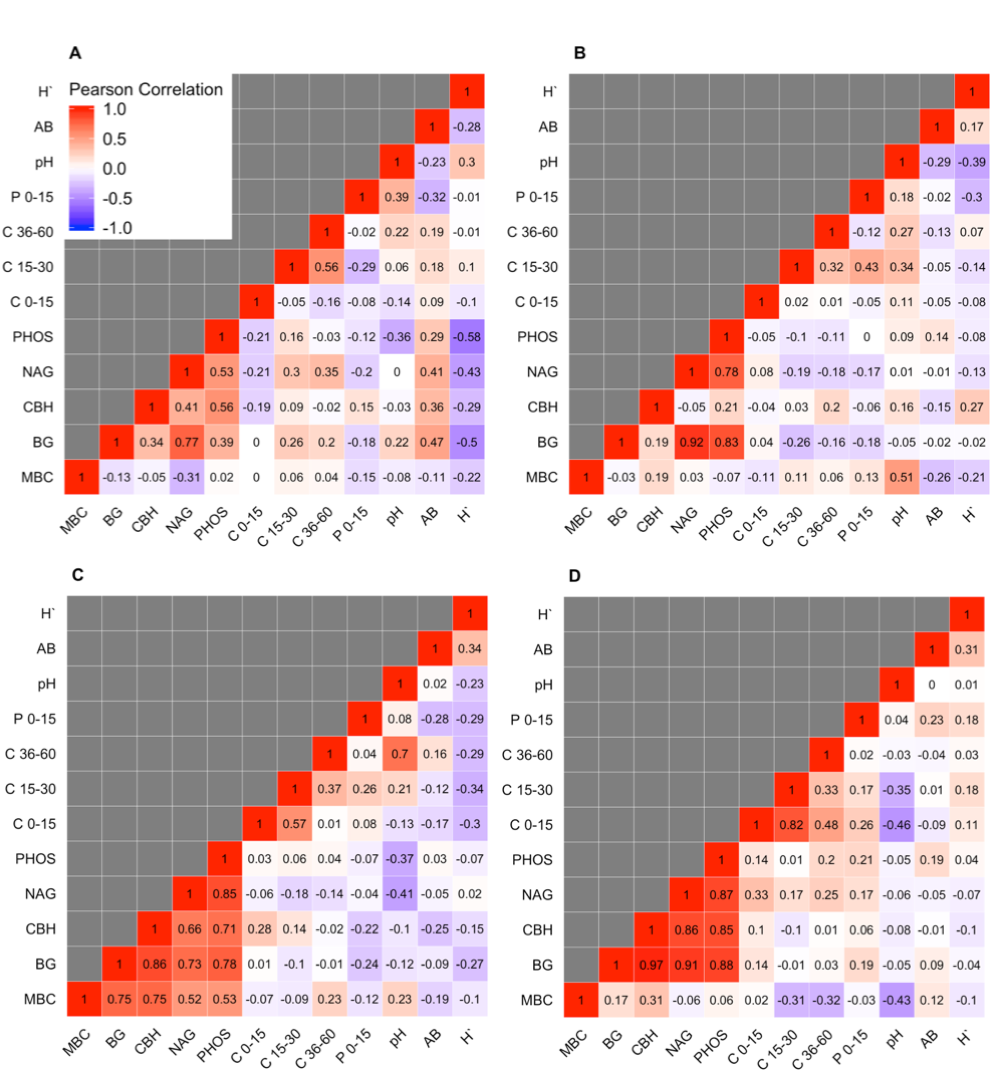
Aboveground biomass was not correlated with any soil variable based on Pearson's correlation coefficients >0.5 or <−0.5 (Fig. 4). At Becker only, H` was negatively associated with BG (Pearson's correlation = −0.50) and PHOS (Pearson's correlation = −0.58) enzyme activities.
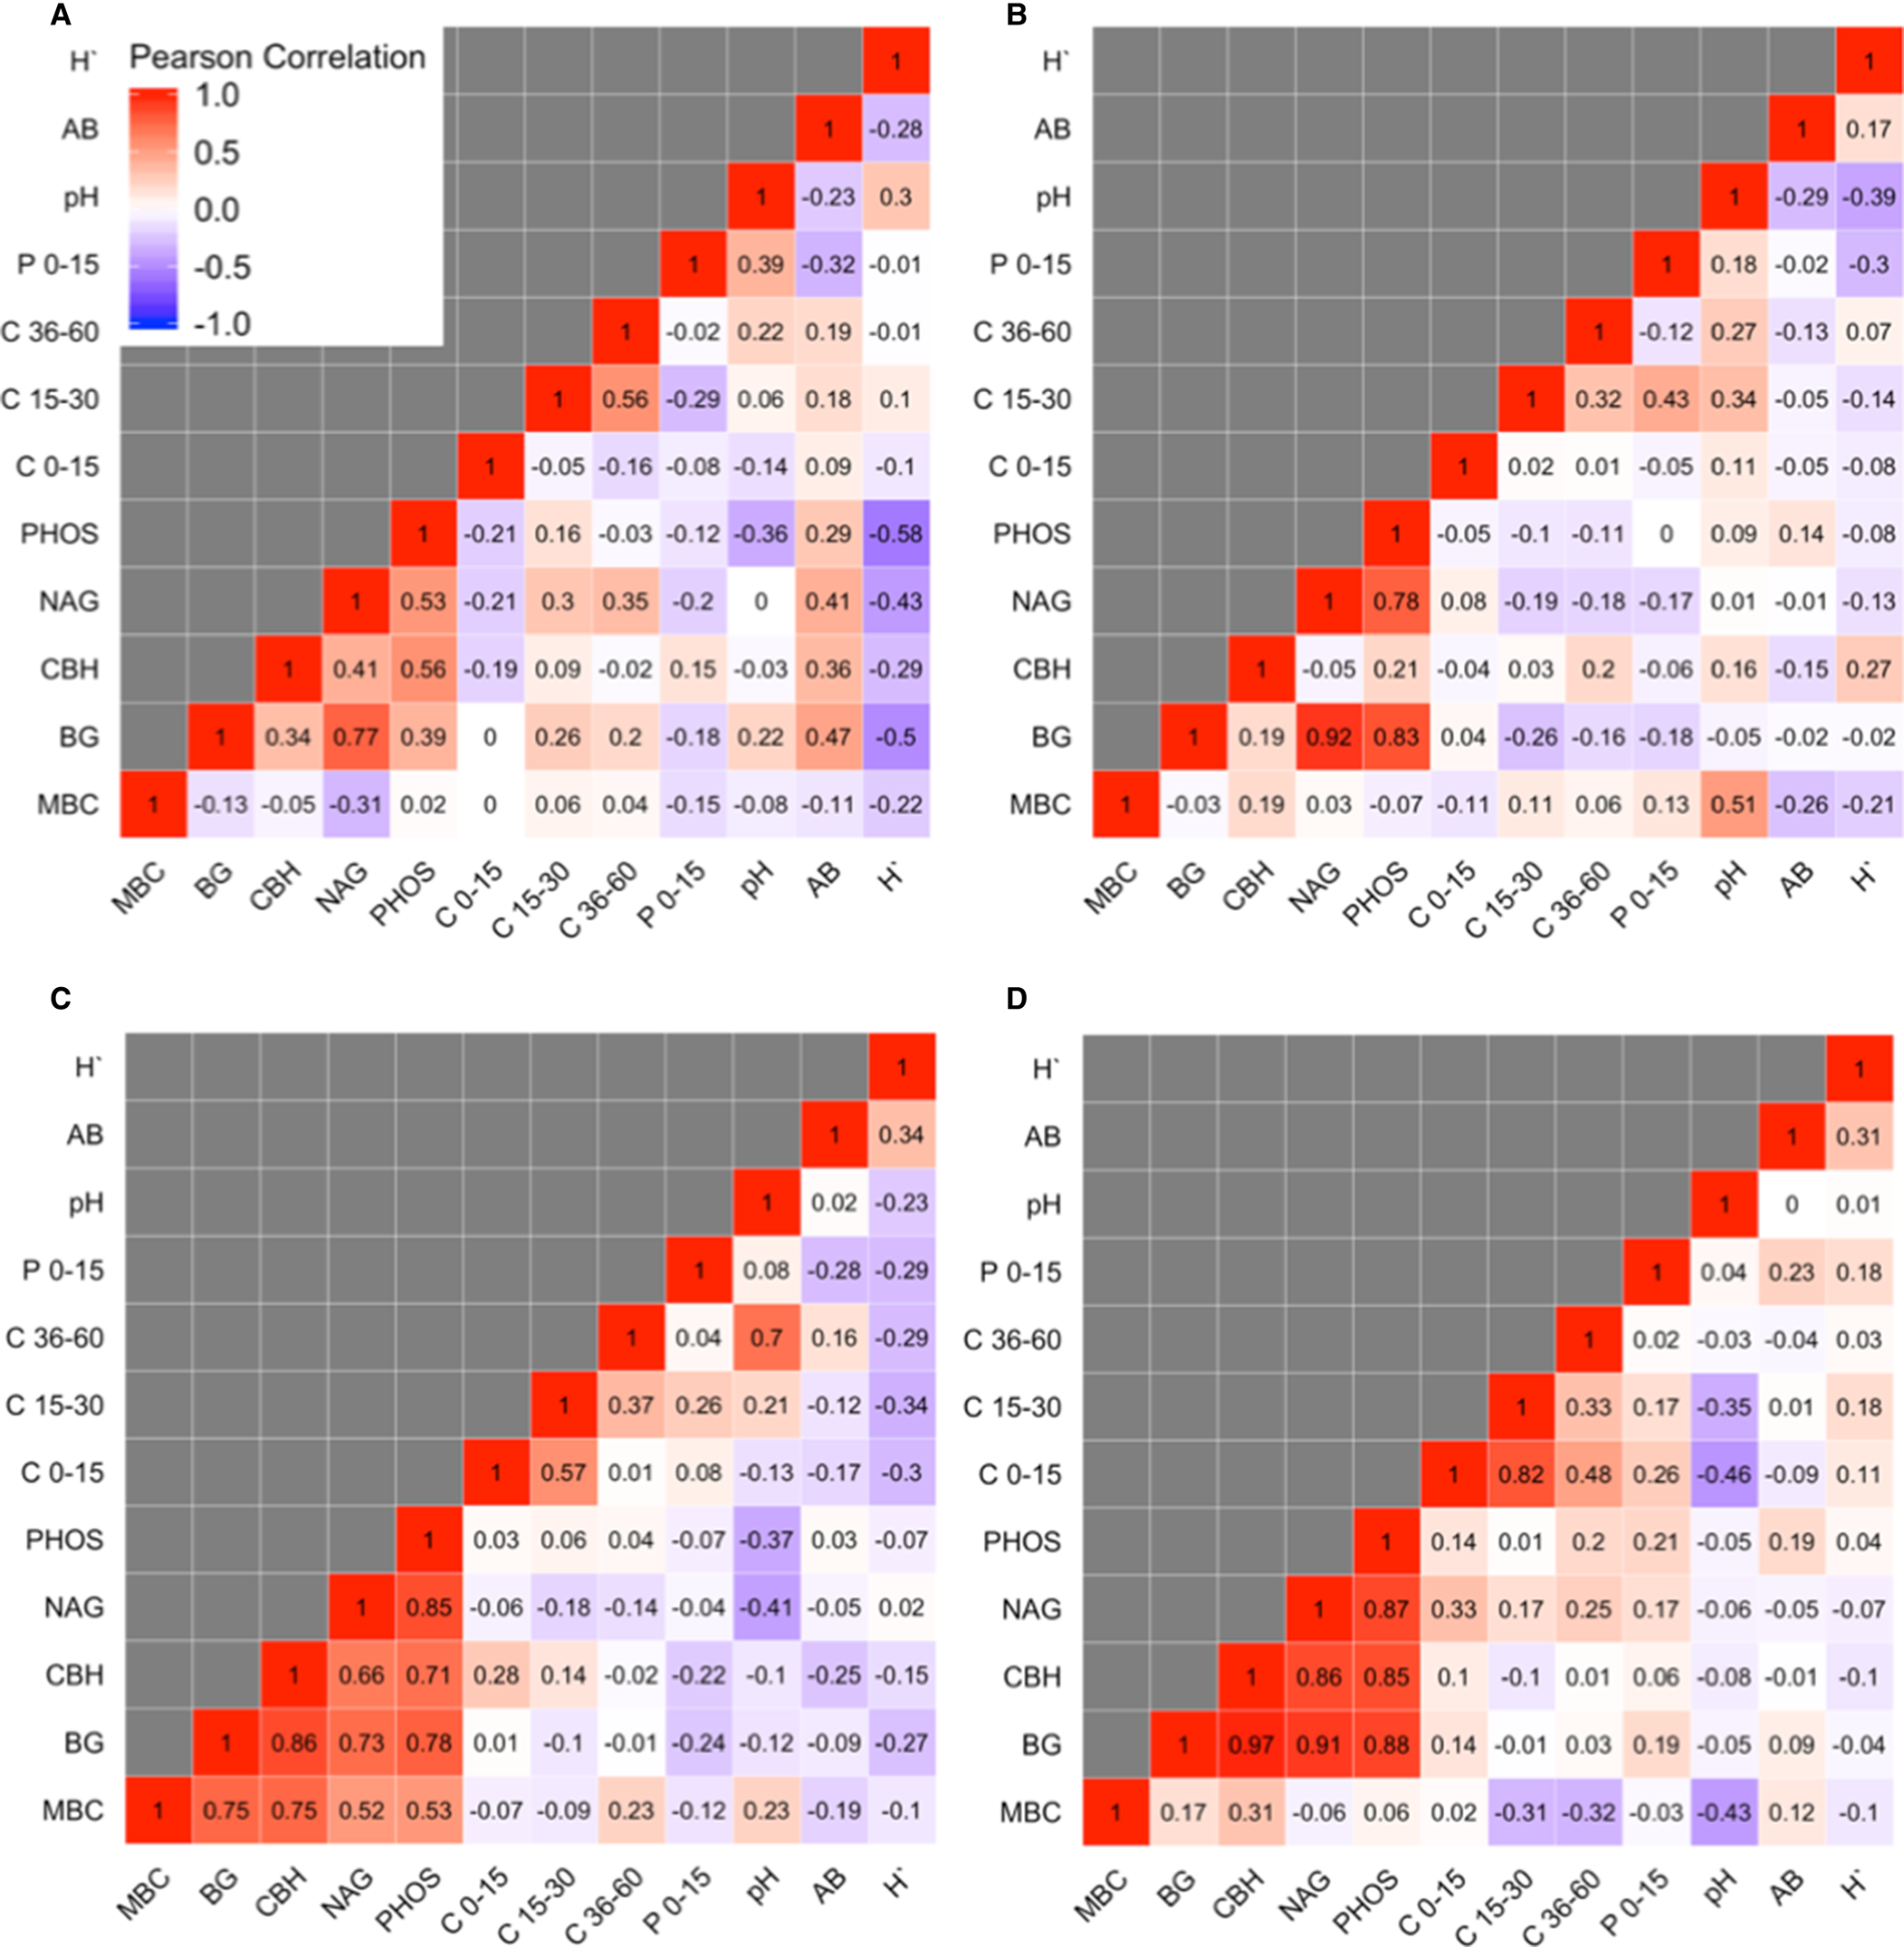
Fig. 4. Pearson's correlation coefficient matrix for microbial biomass C (MBC), β-glucosidase (BG), cellobiohydrolase (CBH), N-acetylglucosaminidase (NAG), phosphatase (PHOS), final total soil C at the 0–15, 15–30 and 30–60 depth intervals, soil pH and aboveground biomass (AB) and Shannon diversity index (H`) at Becker (A), Lamberton (B), Roseau (C) and Waseca (D), MN.
Discussion
Aboveground biomass yield and species diversity
The effects of plant species diversity on productivity have been largely learned through experiments that carefully control and maintain the number of species and relative abundance of species in mixtures (Tilman et al., Reference Tilman, Isbell and Cowles2014). Our study is unique in that it represented a more typical scenario for a managed multispecies bioenergy crop; we did not maintain planted species richness or diversity but instead allowed the relative abundances of planted species to fluctuate and develop through time. Long-term patterns in species abundances and yields from this study can be found in Jungers et al. (Reference Jungers, Clark, Betts, Mangan, Sheaffer and Wyse2015a). In this study, plant surveys from the final year of the study (11 or 12 years after establishment) show (1) that some of the most abundant species in the mixture treatments were species that were not originally planted in the treatment, indicating that species recruitment was occurring, (2) plant diversity varied by species mixture and N fertilization across locations (a significant three-way interaction between species mixture, N fertilization and location; F = 2.17; P = 0.037) and (3) the most abundant species in the mixtures varied by location (Table S2). Recruitment of species into monocultures and loss of species in the polycultures contributed to the homogenization of H` across mixture treatments (Table 2). Despite not controlling for species richness or diversity, evidence of the positive diversity–productivity relationship commonly observed in natural system experiments was observed at the Waseca site, where the HD treatment yielded more biomass than the GM treatment.
Soil microbial C, extracellular enzymes and potential nutrient limitation
Although treatments were in place for more than a decade, we did not measure any differences in MBC across treatments. This was surprising given that a global meta-analysis recently demonstrated that as perennial stands age, a more pronounced positive relationship develops between plant species and MBC (Chen et al., Reference Chen, Chen, Chen and Huang2019) especially in stands >10 years old. Our results show that final plant community composition and diversity varied substantially from the planted species mixture treatments, and that these differences varied by location, which could explain why we did not observe a relationship between MBC and initial plant diversity treatments. We also saw no correlations between MBC, aboveground biomass or final plant diversity when measured at the end of the study.
Significant treatment effects on EEA were observed at the Roseau site, where we saw higher β-glucosidase (BG), cellobiohydrolase (CBH) and phosphatase (PHOS) activity in the HD treatment compared to all others. This was also one of the two sites where after 11–12 years, the HD treatment had lower plant diversity than the GL or SG treatments. Microbes are inherently carbon limited (Soong et al., Reference Soong, Fuchslueger, Marañon-Jimenez, Torn, Janssens, Penuelas and Richter2020) and BG and CBH are both carbon acquisition enzymes. At this northern Minnesota location, conditions would have been less ideal for microbial decomposition, with decreasing plant diversity over time with the dominance of grass species, high in recalcitrant carbon, microbial carbon limitation could have been higher. This in turn would have resulted in increased microbial investment in carbon acquisition enzymes, particularly BG which is known to be associated with more recalcitrant biomass (Caldwell, Reference Caldwell2006). BG activity can be influenced by fertilization, but it can be relatively ephemeral in nature (Ajwa et al., Reference Ajwa, Dell and Rice1999; Bach and Hofmockel, Reference Bach and Hofmockel2015), thus the late fall timing of sampling may have precluded the observation of any differences between fertilized and unfertilized plots.
At the Roseau site, phosphatase (PHOS) activity was also highest in the HD treatment. The HD treatment at Roseau also had significantly lower pH and somewhat lower soil P, and was dominated by switchgrass more than other plant mixtures at that site or even across sites (Table S2). Grasses acquire phosphorus by relying heavily on acid phosphatases, organic acids and the fostering of microbial decomposition activity for P acquisition (Richardson and Simpson, Reference Richardson and Simpson2011). Also supporting this idea, PHOS activity can be greater in soils under monocultures of grasses compared to monocultures of forbs (Fujita et al., Reference Fujita, Robroek, de Ruiter, Heil and Wassen2010). With a relatively lower pH from 7.0 to 6.8 on average in the HD, there also could have been a slight shift toward acid phosphatases, which are produced by plants and microbes, as opposed to purely microbially produced alkaline phosphatases (Spohn and Kuzyakov, Reference Spohn and Kuzyakov2013).
Nitrogen fertilization has been shown to consistently enhance PHOS activity (Marklein and Houlton, Reference Marklein and Houlton2012), yet the effects of N on P uptake can be plant species-specific (Fujita et al., Reference Fujita, Robroek, de Ruiter, Heil and Wassen2010). Although we did not see a main effect of N fertilization on PHOS, there was an N fertilization × mixture treatment interaction at Becker. Under N fertilized conditions, PHOS activity was greater in SG compared to LG and HD mixtures. Lower PHOS activity in the fertilized LG and HD mixtures compared to SG at Becker can be explained by the higher abundances of forb species in these treatments compared to SG (Table S2) and the notion that forbs are less dependent on extracellular enzymes for P acquisition than grasses. An interesting point at the Becker site is that plant species diversity was actually significantly negatively correlated with PHOS activity, and slightly positively correlated with soil pH (Fig. 4). The lack of mineralizable organic matter in the sandy soil at Becker could possibly tighten plant–soil–microbial relationships given that plant productivity is still just as high there. As mentioned, the most diverse plots at Becker were dominated by forbs, which likely do not produce or stimulate as much phosphatase production.
The plant–soil–microbial P acquisition relationships observed at Becker were also different than Roseau in terms of how plant species mixtures potentially altered soil pH. Soil acidification in the HD mixture at Roseau could have been driven by organic acid and phosphatase production by switchgrass, a dominant species in that mixture. At Becker where switchgrass never dominated mixtures as it did at the Roseau site, lower pH in the LG compared to the HD could have been associated with the higher legume abundance in LG (Fig. 4A). Effects of plant species on soil acidification may have been enhanced at Becker as a result of the lower buffering capacity inherent to the sandy soil there.
Total Soil C
We did not see changes in total soil C or differences in final total soil C across treatments at Lamberton, the site with the highest clay content and relatively high organic matter content (Tables 1 and 2). The only location where changes in total soil C were observed was Becker, the location with the lowest clay and organic matter contents. The variability we observed in soil C across locations matches the patterns observed in previous studies. Studying an Alfisol and a Mollisol in the Upper Midwest, USA, Sprunger and Robertson (Reference Sprunger and Robertson2018) found that the less fertile Alfisol was quicker to accumulate soil C across diversity levels, suggesting that differences in diversity effects on soil C were related to baseline soil C and clay content. Even long-term biodiversity studies conducted on coarse-structured, low organic matter soils show minimal changes in soil C within the first 10 yrs of observation (Yang et al., Reference Yang, Tilman, Furey and Lehman2019). Changes in soil C after converting annual cropland to perennial grasslands can require decades to occur (McLauchlan et al., Reference McLauchlan, Hobbie and Post2006). Low soil C accumulation rates in early years following the transition from annual crops to perennials have been attributed to priming effects and subsequent losses in soil C (Jelinski and Kucharik, Reference Jelinski and Kucharik2009; Cihacek and Ulmer, Reference Cihacek, Ulmer, Kimble, Lal and Follett2010). In our study, a comparison of final total soil C across treatments would capture a cumulative effect of the N fertilizer and species mixture treatments. Although our study allowed for more than 10 years of soil C treatment effects to accumulate, we found few changes in total soil C across treatments.
At Roseau, we observed greater total soil C at the 30–60 cm depth interval beneath GM and LG treatments compared to SG (Fig. 2A). Although we did not measure EEA below the 0–15 cm depth to match the total soil C differences, we do see that the GM and LG treatments had among the lowest BG and CBH activities. These differences relative to the other treatments do not exactly align with the relative differences in 30–60 cm total soil C, but this EEA trend could potentially help explain total soil C differences. Low BG and CBH activities indicate lower C mineralization of organic matter, a process that involves microbial respiration and subsequent C losses. Therefore, lower BG and CBH activities could indicate less decomposition, thus explaining the relatively higher total soil C observed in the 30–60 cm depth below the GH and LG treatments.
An interaction between species mixture and N fertilization treatments on final soil C at Waseca (Fig. 1B) could have been related to crop residue C:N content and mineralization potential. Final soil C was lower in the fertilized LG compared to the fertilized GM treatment. Fertilization may have increased the tissue N content of the grasses in LG, and in combination with N-rich tissues of legumes, may have resulted in lower C:N of tissues in LG compared to GM. The lower C:N of the fertilized LG residue may have decomposed more readily, thus resulting in lower soil C accumulation and final values compared to the GM treatment.
Our analysis of soil C change from 2013 to 2017 provides an indication of the more recent soil C accumulation trajectory. At Becker, we observed an increase in soil C from 2013 to 2017 at the 0–15 cm (Fig. 3A) depth. However, we observed soil C loss at the 30–60 cm depth in some treatment combinations including the fertilized SG and HD treatments. Differences in soil C accrual patterns by depth could be related to differences in the root depth distribution, whereas a concentration of high C:N root biomass at the 0–15 cm depth may have resulted in higher soil C accrual at that specific depth interval. Although belowground biomass was not sampled in this study, root tissue quality, biomass and distribution of biomass by depth can explain a large portion of variability in soil C dynamics compared to planted species diversity (Fornara and Tilman, Reference Fornara and Tilman2008; Jungers et al., Reference Jungers, Eckberg, Betts, Mangan, Wyse and Sheaffer2017), thus explaining the lack of a species (Zemenchik and Albrecht, Reference Zemenchik and Albrecht2002) mixture treatment on total soil C in this study. Khan et al. (Reference Khan, Mulvaney, Ellsworth and Boast2007) also observed reductions in soil C at depths >30 cm under fertilized, long-term crop rotations including corn, oats, soybean and alfalfa.
Associations between plant community and soil variables
Plant community composition and diversity changed from the time that the species mixture treatments were established to the end of the study, which can explain the lack of differences in soil MBC, total C and EAA across species mixture treatments. As a result, we tested for associations between soil variables and plant community metrics measured at the end of the study. We did not find any strong associations between plant community and soil variables. This analysis provided little evidence of a positive relationship between soil variables and plant diversity when measured at a single timepoint, with the few significant relationships already discussed above (see section ‘Soil microbial C, extracellular enzymes and potential nutrient limitation’). This can be explained by the potentially slow response of soil parameters to plant diversity. Soil variables measured at the end of this study may reflect the 11 or 12 years of accumulated plant diversity effects; effects that likely changed during succession throughout the life of the stands.
Conclusion
Soil microbial and C dynamics were inconsistent in response to the diversity of perennial plant mixtures and N fertilization in bioenergy cropping systems studied at four locations varying in soil and climate conditions after a decade or more since establishment. Inconsistencies across sites are likely related to site-specific changes in plant species composition through time, weather and soil conditions. For example, grass monocultures and mixtures dominated by grass species had higher PHOS activity compared to mixtures where forbs were more abundant. Similarly, we found evidence of soil C accrual at Becker, the location with the lowest clay and soil organic matter content. However, few soil microbial or C variables responded similarly across locations. By mimicking realistic management practices, such as not hand weeding or replanting absent species, we allowed plant succession to naturally introduce additional variability into this study to better reflect outcomes that would be observed in real-world production bioenergy fields. Increasing the number of sown species in perennial bioenergy cropping systems is likely to support other ecosystem services at various stages of the production lifespan; however, here we show that sown species diversity effects on soil C can vary widely across locations and through time.
Supplementary material
The supplementary material for this article can be found at https://doi.org/10.1017/S1742170521000302
Acknowledgements
This work was supported by the Minnesota Turf Seed Council and the Minnesota Department of Agriculture. We thank Kevin Betts, Lindsay Wilson and Nicole Tautges for their technical assistance in the field and we also thank Fucui Li, Galen Bergquist, Carol Loopstra and Anna Crandall for assistance in the laboratory.
Conflict of interest
The authors declare that they have no known competing financial interests or personal relationships that could have appeared to influence the work reported in this paper.


 Open access