


INTRODUCTION
A recent resurgence of investigations creating records of annual radiocarbon (14C) from calendar dated tree-ring series has demonstrated the potential of such data to expose year-to-year rapid excursions in 14C (e.g. Miyake et al. Reference Miyake, Nagaya, Masuda and Nakamura2012, Reference Miyake, Masuda, Hakozaki, Nakamura, Tokanai, Kato, Kimura and Mitsutani2014; Wang et al. Reference Wang, Yu, Zou, Dai and Cheng2017) and a range of other likely solar driven patterns (e.g. Miyake et al. Reference Miyake, Jull, Panyushkina, Wacker, Salzer, Baisan, Lange, Cruz, Masuda and Nakamura2017; Park et al. Reference Park, Southon, Fahrni, Creasman and Mewaldt2017; O’Hare et al. Reference O’Hare, Mekhaldi, Adolphi, Raisbeck, Aldahan, Anderberg, Beer, Christl, Fahrni, Synal and Park2019) that are otherwise obscured in reconstructions based on 5-, 10- or 20-yr blocks of tree-rings (e.g. IntCal13; Reimer et al. Reference Reimer, Bard, Bayliss, Beck, Blackwell, Bronk Ramsey, Buck, Cheng, Edwards, Friedrich, Grootes, Guilderson, Haflidason, Hajdas, Hatté, Heaton, Hoffmann, Hogg, Hughen, Kaiser, Kromer, Manning, Niu, Reimer, Richards, Scott, Southon, Staff, Turney and van der Plicht2013). The reproducibility, potential and use of such 14C marker events is now well demonstrated (Jull et al. Reference Jull, Panyushkina, Lange, Kukarskih, Myglan, Clark, Salzer, Burr and Leavitt2014; Wacker et al. Reference Wacker, Güttler, Goll, Hurni, Synal and Walti2014; Güttler et al. Reference Güttler, Adolphi, Beer, Bleicher, Boswijk, Christl, Hogg, Palmer, Vockenhuber, Wacker and Wunder2015; Sigl et al. Reference Sigl, Winstrup, McConnell, Welten, Plunkett, Ludlow, Büntgen, Caffee, Chellman, Dahl-Jensen and Fischer2015; Oppenheimer et al. Reference Oppenheimer, Wacker, Xu, Galván, Stoffel, Guillet, Corona, Sigl, Di Cosmo, Hajdas and Pan2017; Büntgen et al. Reference Büntgen, Wacker, Galván, Arnold, Arseneault, Baillie, Beer, Bernabei, Bleicher and Boswijk2018). What requires further exploration is the utility of longer (multidecadal, multicentennial) 14C time-series from single tree-rings for improving the radiocarbon calibration curve and for better defining 14C variability between laboratories and within the natural environment at a correspondingly high resolution.
Pearson et al. (Reference Pearson, Brewer, Brown, Heaton, Hodgins, Jull, Lange and Salzer2018) showed that between 1700 and 1500 BC, consecutive annual 14C measurements produced at the University of Arizona AMS Laboratory (hereafter AA) on single years from contemporary North American bristlecone pine and Irish oak trees, were within stated error of one another and the majority of the raw data derived from multiyear German and Irish oak samples underlying the IntCal13 curve (Reimer et al. Reference Reimer, Bard, Bayliss, Beck, Blackwell, Bronk Ramsey, Buck, Cheng, Edwards, Friedrich, Grootes, Guilderson, Haflidason, Hajdas, Hatté, Heaton, Hoffmann, Hogg, Hughen, Kaiser, Kromer, Manning, Niu, Reimer, Richards, Scott, Southon, Staff, Turney and van der Plicht2013). When compared with the curve itself, these annual data agreed with IntCal13 from 1700 to 1650 BC, but then diverged towards older values by ca. 25 14C yr between ca. 1650 to 1540 BC. Consistent laboratory protocols were used throughout the period of data collection at AA, yet the data produced both fitted and diverged from the calibration curve. This result required extensive testing to see if the results could be replicated at a different laboratory.
Furthermore, the agreement between data from the two independently developed tree-ring chronologies at the same laboratory indicated that annually based tree-ring 14C datasets could make the shape of the calibration curve more accurate by more precisely defining transitions between slopes and plateaus in 14C production. This observation also required testing to refine, improve and further define the limitations of such annual datasets for calibration and proxy synchronization.
This study presents a major new annual calibration dataset based on Irish oak produced at the ETH AMS Laboratory, Zürich, for the period 1680–1500 BC. These data replicate the period published by Pearson et al. (Reference Pearson, Brewer, Brown, Heaton, Hodgins, Jull, Lange and Salzer2018) using tree-rings from the same Irish oaks. The reproducibility of annual 14C measurements on Irish oak are tested in terms of inter-tree variation (same site, same laboratory, different trees) and interlaboratory biases (same tree-ring samples, different laboratories). This is then extended to consideration of potential geographic variation (same year samples, same laboratory, trees from different growth locations) using the Pearson et al. (Reference Pearson, Brewer, Brown, Heaton, Hodgins, Jull, Lange and Salzer2018) North American bristlecone pine data and contemporary AA data from two other growth locations. The aim was to test the published AA data quality and to provide a better understanding of variability and error associated with the creation of annual 14C data.
This work also contributes directly towards the long-running debate over the date of the Thera eruption (e.g. Warburton Reference Warburton2009), a critical event for synchronizing the chronologies of the ancient Mediterranean, Levant and Egypt. Uncalibrated 14C ages for materials stratified around this pivotal eruption layer fall in the transition zone between a slope and plateau of the calibration curve, so calibrated and modeled ranges are sensitive to subtle changes in curve shape. More annual data are needed as a resource for calibration to enable Bayesian modeling for dated annual materials (seeds, beans, etc.) to provide the most accurate age ranges possible for the eruption.
METHODS
Tree-Ring Sampling and Chronological Verification
Oak tree-rings (3449–3629 cal BP) were dissected from a securely dated chronology from Timahoe West, Co. Kildare, Northern Ireland, latitude 53.3450. The samples were originally preserved in a wet environment and were prepared for measurement using a razor blade and, where needed, chalk to enhance the ring pattern for measurement. Ring-widths were measured to a precision of 1/50 mm using a microcomputer-based traveling stage. The 424-yr-long site chronology was constructed using the procedures described by Baillie (Reference Baillie1982) and is dated 1807 BC–1384 BC (historic dates BC without the year zero). It contains 21 samples (see Table 1 in the supplemental appendix). Correlation t-values based on CROS84 (Munro Reference Munro1984) between individual samples and with other regional chronologies are provided in supplemental appendix Tables 2–3. Samples were cleaned with a razor blade and the annual growth rings marked and split away from the bulk sample using a scalpel bade. Because early wood growth in oak is formed using 14C stored from the previous growth season (Pilcher Reference Pilcher, Frinzel, Stauffer and Weiss1995) only the latewood part of the annual growth ring, representing ca. May–July growth in the assigned BC year, was used for radiocarbon analysis. The remainder of the samples are stored in the Dendrochronology Laboratory, School of Natural and Built Environment, Queen’s University, Belfast. The ring-width data can be found online (QUB 2020). The Irish oak 14C data from both AA and ETH (across the period 3449–3629 cal BP) compared in the main text (Table 1, Figures 1 and 2) are provided in Table 4 of the supplemental appendix.
Table 1 Comparison between different subsets of the annual 14C data.

* Please note low statistics (minimal numbers of sample pairs).

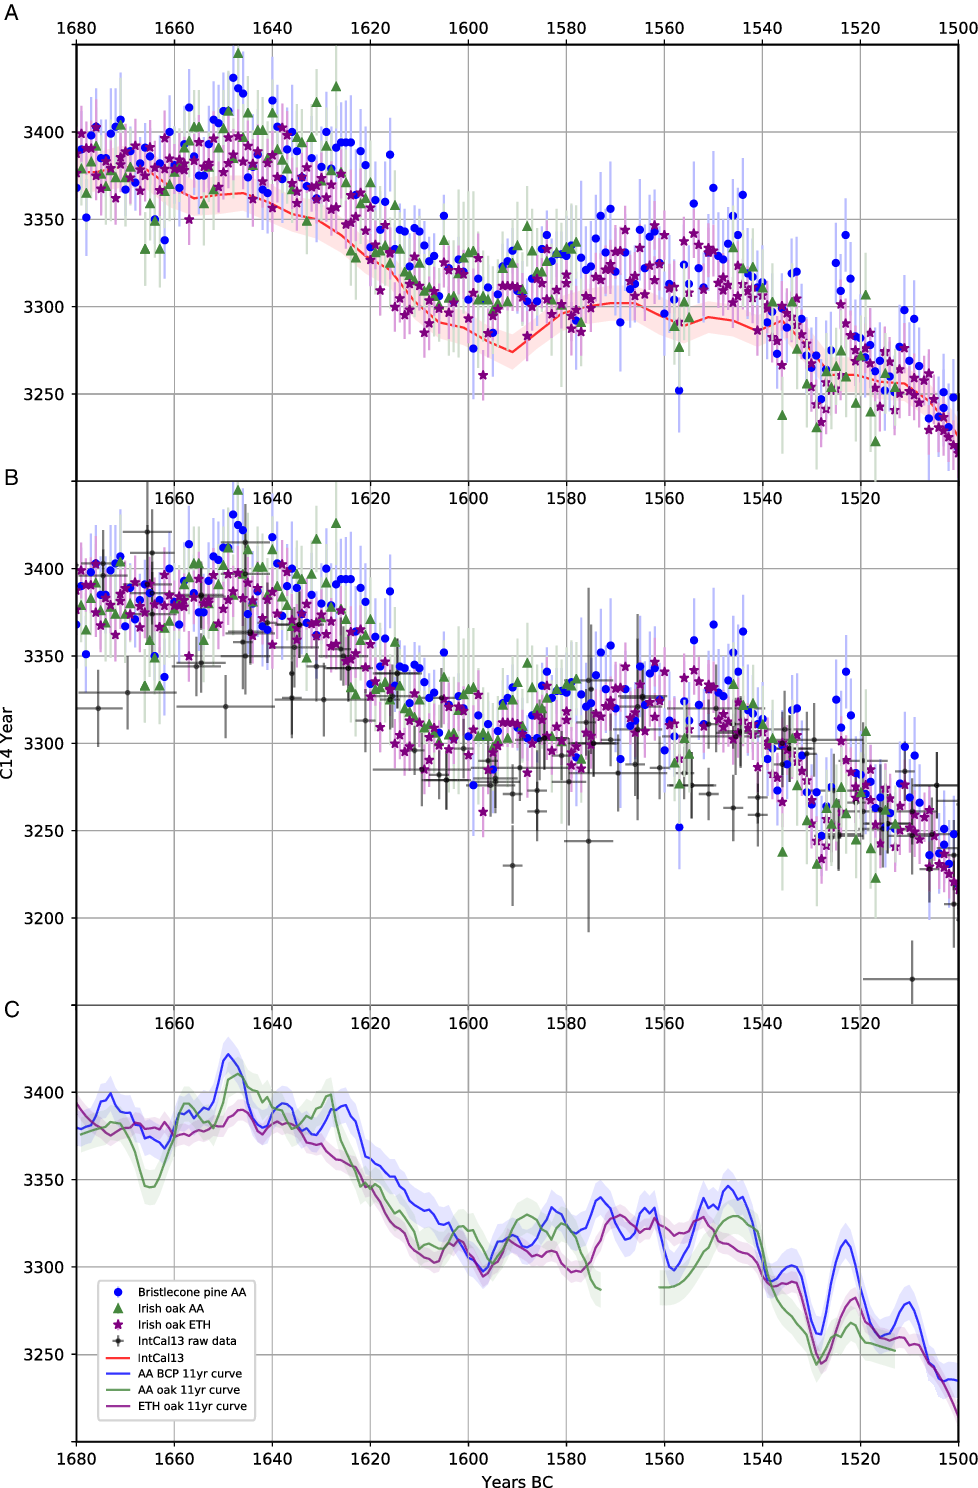
Figure 1 A: Annual 14C data 1680–1500 BC. Bristlecone pine (AA), Irish oak (AA), Irish oak (ETH) relative to IntCal13. B: Data relative to IntCal13 raw data 1680–1500 BC. Horizontal error on “IntCal raw” indicates bidecadal, decadal, and 4-yr data. These data, derived from German or Irish oak trees, were produced at four different labs in multiple discrete batches over a number of years. C: Data smoothed with a Savitzky-Golay filter (Savitzky and Golay, Reference Savitzky and Golay1964) which uses a spline function with 2 degrees of freedom over 11 resp. 21 data points (±5 resp. ±10 yr). General trends in data confirm the height and termination of the plateau at ca. 1540 BC and a small excursion around 1528 BC. The slight offset between the oak and pine is most clearly observed for the period ca. 1630–1610 BC.
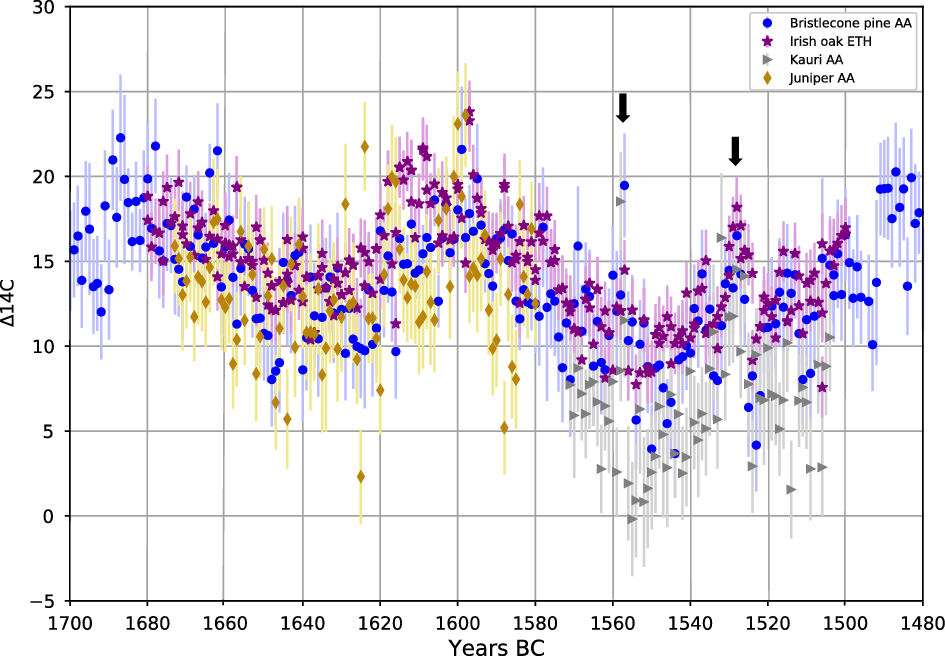
Figure 2 Δ14C between 1700 and 1480 BC for trees from North America, Ireland, New Zealand and the Eastern Mediterranean. Arrows highlight replicable small scale 14C features around 1557 and 1528 BC.
The North American bristlecone pine sequence published by Pearson et al. (Reference Pearson, Brewer, Brown, Heaton, Hodgins, Jull, Lange and Salzer2018) was used for comparison in Table 1 and Figure 1 along with the Irish oak data. This sequence was also extended by 20 yr (3449–3429 cal BP) and plotted in Figure 2 to improve the discussion of Δ14C for this time period. The new data (supplemental appendix Table 5) were produced from tree-rings dissected from sample SHP-849 from the securely dated chronology from Sheep Mountain, California, USA, latitude 37.5327 (for ring-width data and cross-dating statistics for the Sheep Mountain chronology, see NOAA 2020a). The sample was preserved above ground, a remnant of a standing tree. It was sanded, measured and dated according to standard procedures (Stokes and Smiley Reference Stokes and Smiley1968). The full Sheep Mountain chronology is calendar dated –2649 to 2005 AD (astronomical calendar AD/BC according to the standard convention for bristlecone dating after Ferguson Reference Ferguson1969), so 2650 BC to 2005 AD. Further details are provided in Salzer and Hughes (Reference Salzer and Hughes2007), Salzer et al. (Reference Salzer, Hughes, Bunn and Kipfmueller2009, Reference Salzer, Bunn, Graham and Hughes2014a, Reference Salzer, Larson, Bunn and Hughes2014b), and Bunn et al. (Reference Bunn, Salzer, Anchukaitus, Breuning and Hughes2018). For all samples used in this study and to create the Pearson et al. (Reference Pearson, Brewer, Brown, Heaton, Hodgins, Jull, Lange and Salzer2018) dataset (SHP-851, SHP-33, and SHP-849), independent verification was carried out using COFECHA12K version 6.06P (Holmes Reference Holmes1983). Dating was rechecked by correlating ring widths between 50-yr segments and the master SHP mountain chronology lagged successively by 25 yr and then reconfirmed through the presence/absence of subannual ring features such as frost rings. Samples were cleaned and dissected with a razor blade. The whole ring was sampled, representing a growth season that is currently typically ca. 45 days from mid-to-late June to late July/early August, although as the trees retain their needles, photosynthesis is possible outside the standard growth season. The remainder of the samples and subsamples are stored at the Laboratory of Tree-Ring Research Archive in Tucson, Arizona, USA.
In addition, annual 14C data from Turkish juniper trees (3624–3530 cal BP) were used to extend the geographic comparison in Table 1 and plotted on Figure 2. These data are provided in the supplemental appendix (Table 6). The tree-rings were dissected from samples 161 and 76 from the Gordion area chronology (Turkey), at a latitude of around 39.6498 (Rose et al. Reference Rose, Darbyshire, DeVries, Kromer, Kuniholm, Liebhart, Manning, Newton, Sams and Voight2011). Ring-widths series and cross-dating verification are published online (NOAA 2020b; see also Manning et al. Reference Manning, Kromer, Ramsey, Pearson, Talamo, Trano and Watkins2010). The full chronology, first published in relative years and by 14C wiggle-match dating by Kuniholm et al. Reference Kuniholm, Kromer, Manning, Newton, Latini and Bruce1996, has recently been refined to a fixed calendar dated range (Pearson et al. Reference Pearson, Salzer, Wacker, Brewer, Sookdeo and Kuniholmforthcoming). The samples were prepared by sanding, measured and cross-checked using Tellervo (Brewer Reference Brewer2014). Whole rings were dissected representing a growth season of between April to November, with potential for extended growth later in the year or to have bimodal xylogenisis within this period (Camarero et al. Reference Camarero, Olano and Parras2010). The remainder of the samples are stored at the Laboratory of Tree-Ring Research Archive, Tucson, Arizona and at Cornell University.
To provide a Southern Hemisphere comparison (Table 1, Figure 2), annual 14C data from New Zealand kauri (3608–3453 cal BP) were produced using tree-rings dissected from a securely dated chronology from Gibson’s Farm, Dargaville, latitude –35.5414. The ring-widths and 14C data are provided in Tables 7 and 8 of the supplemental appendix. These samples were preserved in a swamp and were prepared by sanding and then measured and cross-dated using Dendro for Windows (Tyers Reference Tyers2004) and Corina Legacy, a crossdating program from the Cornell Tree Ring Laboratory for statistical (t- and r values) and visual crossmatching. The full Gibson farm chronology and cross-dating statistics are published in Boswijk and Palmer (Reference Boswijk and Palmer2012), it is calendar dated from 1721 to 792 BC (historic dates BC without the year zero). Samples were cleaned and dissected with a razor blade and the whole ring was sampled. It should be noted that the rings are labeled by year, but the growth period represented actually represents part of two years because of the SH location. For example, the ring for 1721 BC actually represents a growth season which is roughly October 1721 to February 1722 BC. More specifically, Wunder et al. (Reference Wunder, Fowler, Cook, Pirie and McCloskey2013) reported a dominant October–November growth period with reduced growth mid-summer and cessation by late April, citing Belieski (Reference Bieleski1959) who also reported a dormancy period of ca. late April–late August/September. The remainder of the samples and subsamples are stored at the University of Auckland, SENV Tree-Ring Laboratory.
Radiocarbon Protocols
Tree-ring samples processed at the University of Arizona Accelerator Mass Spectrometry (AMS) Laboratory were converted to holo-cellulose, one sample at a time. Samples were prepared as submillimeter-thick slices of wood with large surface areas and short diffusion distances to facilitate the uptake of reagents and the extraction of contaminants. Each sample was then processed following standard 1N HCl / NaOH / HCl extraction protocols at 70ºC. Then a bleaching solution of the same temperature made from NaClO2, HCl and H2O was used to reduce the material to bright white holo-cellulose. Samples were then combusted to CO2 and converted to graphite using standard procedures (Jull et al. Reference Jull, Burr, Beck, Hodgins, Biddulph, McHargue and Lange2008) and measured using a National Electrostatics Corporation AMS system, operated at a terminal voltage of 2.5 MV (Donahue et al. Reference Donahue, Beck, Biddulph, Burr, Courtney, Damon, Hatheway, Hewitt, Jull, Lange and Lifton1997). The 14C/13C ratio of each sample was compared to National Institute of Standards and Technology standards SRM4990B and 4990C and the resulting fractionation corrected to a δ13C value measured offline on a stable isotope mass spectrometer. Calculations of the fraction of modern carbon and Δ14C can be found in Jull et al. (Reference Jull, Panyushkina, Lange, Kukarskih, Myglan, Clark, Salzer, Burr and Leavitt2014: Equations 1 and 2).
Tree-ring samples at ETH Zürich were cleaned to holo-cellulose with essentially the same treatment as in Arizona, with the addition of an overnight treatment with 1 N NaOH at 70° before the acid-base-acid bleaching procedure (Němec et al. Reference Němec, Wacker, Hajdas and Gäggeler2010; Sookdeo et al. Reference Sookdeo, Kromer, Büntgen, Friedrich, Friedrich, Helle, Pauly, Nievergelt, Reinig, Treydte, Synal and Wacker2019), then graphitized as part of a fully automated system directly coupled to an elemental analyzer (Wacker et al. Reference Wacker, Němec and Bourquin2010b), before being measured using the mini carbon dating system (MICADAS; Wacker et al. Reference Wacker, Bonani, Friedrich, Hajdas, Kromer, Němec, Ruff, Suter, Synal and Vockenhuber2010a).
Comparative Statistics
Table 1 shows the weighted mean difference (Bevington and Robinson Reference Bevington and Robinson1992, equation 4.19) between same year pairs from different subsets of the data listed in the supplemental appendix. These average differences can arise from a variety of causes which are explored by analyzing different subsets of the data: inter-tree variation (Table 1: 1, 3), inter-laboratory biases (Table 1: 2, 3, and 4), and geographical variation (Table 1: 4–8). Tests 3 and 4 potentially conflate more than one source of variation (inter-tree and inter-laboratory variation, and geographical and inter-laboratory variation respectively). The reduced chi-square statistic (Bevington Reference Bevington and Bevington1969: 69) was used for tests 3 and 4 (Table 1) to provide a measure of how well replicate measurements reproduced within the quoted uncertainty. In principal, χ2red = 1 where replicate measurements do reproduce within the quoted uncertainty, less than this when quoted errors are too large and more than this when quoted errors are too small and/or the replication is offset.
RESULTS
The main comparative part of the study was conducted using a new sequence of annual 14C measurements from absolutely dated Irish oak tree-rings analyzed at ETH Zürich versus published data from the same tree-ring series measured at AA (Pearson et al. Reference Pearson, Brewer, Brown, Heaton, Hodgins, Jull, Lange and Salzer2018, extended, see supplemental appendix, Table 4), for the period between 3629 and 3449 cal BP. Comparison of the potential contribution of inter-tree variability in annual 14C at the same growth location (Table 1: 1) versus whole process inter-laboratory difference between ETH and AA on the same tree (Table 1: 2) and the combined inter-tree and inter-laboratory reproducibility (Table 1: 3) across 127 pairs of measurements, indicated no measurable inter-tree effect.
Tests 2 and 3 (Table 1) indicate a small, but significant mean inter-laboratory difference of –6.2 ± 1.8 14C yr (–6.8 ± 2.6 14C yr and –5.8 ± 2.3 14C yr), with ETH being younger. The χ2red statistic for test 2 is 0.75 and for test 3, 0.81, indicating that the uncertainties were overestimated at a 95% confidence level, though on average only by slightly more than 10%. The average error for ETH measurements was 13.5 14C yr, for AA it was 24 14C yr.
An average weighted mean difference of –8.1 ± 1.9 14C yr can be calculated between the Irish oaks and North American pines (based on tests 4 and 5, with the test 4 result for the Irish material corrected for the inter-laboratory offset). Comparison of the oak data with other multidecadal annual 14C time series produced at AA for juniper trees from Turkey (Table 1: 6) from a similar latitude (lower altitude, same approximate growth season) as the bristlecone pine, also indicated a difference of –8.4 ± 3.4 14C yr relative to the Irish oak. New Zealand kauri trees showed the expected Southern Hemisphere offset (Table 1: 8 and 9) with the Irish trees –37.1 ± 5.2 14C yr different to those in New Zealand, and the slightly more southerly grown trees from North America offset by –30.1 ± 3.7 14C yr. These results are within the stated error of previously reported values for the Northern versus Southern Hemisphere offset (e.g. 43 ± 23 14C yr; Hogg et al. Reference Hogg, Palmer, Boswijk, Reimer and Brown2009) and the only annual to annual data comparison in this study which provides an “offset” result outside the stated errors for the reported measurements. Nevertheless, the “within error” trends noted between contemporary Irish, North American, and Mediterranean samples merit further investigation as they are consistent with the observation of Büntgen et al. (Reference Büntgen, Wacker, Galván, Arnold, Arseneault, Baillie, Beer, Bernabei, Bleicher and Boswijk2018) for a possible meridional decline in Northern Hemisphere atmospheric radiocarbon concentrations.
The overall agreement between the Irish and North American annual 14C time-series produced at AA and ETH is shown in Figure 1. The variability between samples representing the same year from different materials run at different labs and the range of year-to-year variability represented provides a useful context in which to evaluate preexisting single 14C dates on archaeological materials representing a single growth season. For example, the much debated range of dates reported for the pre-Thera eruption seed assemblage from the site of Akrotiri on Santorini (Manning et al. Reference Manning, Ramsey, Kutschera, Higham, Kromer, Steier and Wild2006; Warburton Reference Warburton2009; Wiener and Earle Reference Wiener and Earle2014) can now be reviewed in the context of not only the mixed age range of material expected within a period of occupation, but also, the approximate range of possible natural or laboratory based year-to-year variation for the wider time period.
The data in Figure 1A agree more closely with one another than with the IntCal13 curve for the time period between ca. 1650 and 1540 BC where they are offset from IntCal. Between 1700 and 1650 BC and after 1540 BC the annual data and the IntCal13 curve more generally agree, reconfirming curve shape for these periods. For the offset period between 1680 and 1540 BC, the annual 14C data are within stated errors of the majority of the IntCal raw data (Reimer et al. Reference Reimer, Bard, Bayliss, Beck, Blackwell, Bronk Ramsey, Buck, Cheng, Edwards, Friedrich, Grootes, Guilderson, Haflidason, Hajdas, Hatté, Heaton, Hoffmann, Hogg, Hughen, Kaiser, Kromer, Manning, Niu, Reimer, Richards, Scott, Southon, Staff, Turney and van der Plicht2013; Figure 1B).
A similar sized offset from IntCal04 (ca. 24 14C yr) was observed by Wacker et al. (Reference Wacker, Bonani, Friedrich, Hajdas, Kromer, Němec, Ruff, Suter, Synal and Vockenhuber2010a) for a sequence of blocked tree-ring 14C data around 1200 AD. It seemed that one possible explanation in that case was related to inter-laboratory differences in pretreatment and measurement protocols between different datasets used in the calibration curve and the dataset being compared (Němec et al. Reference Němec, Wacker, Hajdas and Gäggeler2010; Wacker et al. Reference Wacker, Bonani, Friedrich, Hajdas, Kromer, Němec, Ruff, Suter, Synal and Vockenhuber2010a: 260). Prior to confirmation of the AA data, it was possible that inter-laboratory comparison would show that these data would move up or down as a whole relative to IntCal13 because of some consistent laboratory effect. The time-series would still have likely shown a pattern of on and off agreement with the calibration curve, but for different periods. Confirmation from the ETH laboratory that, although a –6.2 ± 1.8 14C yr offset is present between the laboratories, overall the reproducibility of the annual datasets is very good, is an important step towards defining the limitations and potential of annually derived calibration series. It also confirms that combined annually derived 14C time series can more accurately describe past 14C levels than multiyear blocked data, which is logical.
Comparison of these annual data and IntCal13 raw datasets indicates that the difference between the IntCal13 curve and the overall form of the annual data is not controlled by a single factor, but is likely connected with a range of slight differences in the underlying blocked-data, along with the statistical smoothing of the curve. Such differences may include the random cumulative effect of a series of small (statistically insignificant) offsets or may relate to physical properties of the blocked samples. For example, if a 14C sample in the raw data from which a calibration curve is produced consists of a block of 5 or 10 tree-rings where two wide years (reflecting very favorable growth conditions) contribute 70% of the total sample, then the 14C measurement for that bulk sample will be skewed by the 14C in the two wide rings. This may or may not be a problem in terms of final calibration curve shape. It depends on how stable 14C production was across the particular growth period, where within the 11-yr solar cycle the multiyear blocks of rings were divided, or if they happened to include a subdecadal scale “rapid” excursion in 14C (such as in Miyake et al. Reference Miyake, Nagaya, Masuda and Nakamura2012). It also depends on how many samples make up the raw data for the curve in the time period (as is true for any potentially skewed dataset or data point in the raw data) and on how the chosen statistical method uses these data to produce a smoothed curve.
In Figure 1C, the <10 14C yr differences across the annual oak and pine datasets (Table 1: 4) are emphasized using a smoothed 11-yr running average. Whether this reflects some aspect of true natural 14C variability or is just an artifact of the analytical process within stated error requires more investigation. For example, the slight fluctuation between the AA oak and pine data between ca. 1630 and 1610 BC could be a small growth season related offset, an intermittent laboratory-based factor, or a data artifact. The agreement in structure between 1560 and 1520 BC could be coincidental, but it could also indicate regional 14C homogeneity at this time and provide important confirmation of calibration curve structure. As a minimum these data are helpful in illustrating the cumulative variability which might be built into a segment of calibration curve based on annual data.
The data were subsequently extended to cover 1500–1480 BC (with 20 additional years of AA bristlecone data, see supplemental appendix, Table 5) and explored as a cosmic radiation time-series (Figure 2). Two ca. 25–30-yr periods of higher Δ14C occur ca. 1690–1660 BC and ca. 1620–1590 BC with another possibly starting around 1490 BC. These seem similar in scale to the Oort Minimum (Miyake Reference Miyake2013). The spacing between the first three periods of lower solar activity fluctuates around ca. 44 yr between crest and trough, with a ca. 8–10‰ increase over the 40 yr between each of the first three events (the fourth still pending confirmation with other data). These observations potentially link with the ca. 88-yr Gleissberg cycle (Damon and Sonett Reference Damon, Sonett, Sonnet, Giampapa and Shapley1991; Damon and Peristykh Reference Damon and Peristykh2000) which has been speculated to modulate the 11-yr solar cycle (Attolini et al. Reference Attolini, Cecchini, Galli, Kocharov and Nanni1993).
Figure 2 also includes data for New Zealand kauri which, while requiring further inter-laboratory replication, appears to show features around 1558/1557 and 1528 BC also seen in the oak and pine data. The Southern Hemisphere offset is generally consistent with that observed in other time periods (McCormac et al. Reference McCormac, Hogg, Higham, Baillie, Palmer, Xiong, Pilcher, Brown and Hoper1998; Büntgen et al. Reference Büntgen, Wacker, Galván, Arnold, Arseneault, Baillie, Beer, Bernabei, Bleicher and Boswijk2018), however around these two features it shows intermittent disturbance. In particular at the time of the event centered on 1528 BC, the Southern Hemisphere offset appears to disappear briefly, possibly as a result of whatever caused the rapid increase in Δ14C (ca. 6‰ over 3–4 yr) at this time. This feature is similar to (though weaker than—see Figure 3) the solar storm around 660 BC (Park et al. Reference Park, Southon, Fahrni, Creasman and Mewaldt2017; O’Hare et al. Reference O’Hare, Mekhaldi, Adolphi, Raisbeck, Aldahan, Anderberg, Beer, Christl, Fahrni, Synal and Park2019) which featured an increase of 10‰ over 3–4 yr. The feature at 1528 BC is also followed by a rapid decrease (of ca. 4.8‰), which requires further verification and is difficult to explain.

Figure 3 A comparison of the oak and pine data at 1528 BC versus the 660 BC event (red) with the x-axis set with the event peak at 0.
CONCLUSIONS
The data presented in this study confirm the initial findings of Pearson et al. (Reference Pearson, Brewer, Brown, Heaton, Hodgins, Jull, Lange and Salzer2018) that a calibration curve based on annually derived 14C can provide a more accurate representation of past 14C production than a curve based on coarser resolution data. They also indicate that a refined curve shape between ca. 1610 and 1540 BC will have an impact on calibrated age ranges from this period, including increased possibilities for a mid-16th century BC date for the Thera eruption. The fact that the annual data can agree so closely on the levels of past 14C production, and yet differ from the existing calibration curve in some periods, should not be surprising as it reflects, in part, simply the difference between a coarse and more finely resolved dataset.
Data were also explored in terms of what may or may not be possible in terms of replication and error for long, multiregional annual 14C time-series. Inter-tree impacts on annual 14C were not found to be significant but a small, mean laboratory difference of –6.2 ± 1.8 14C yr was evident. This contributes to a growing body of data which will help define and refine the best possible inter-laboratory limits for measuring annual 14C in tree-ring series.
While regional offsets in the Northern Hemisphere have been extensively discussed in the literature (e.g. McCormac et al. Reference McCormac, Hogg, Higham, Baillie, Palmer, Xiong, Pilcher, Brown and Hoper1998; Kromer et al. Reference Kromer, Manning, Kuniholm, Newton, Spurk and Levin2001; Dee et al. Reference Dee, Brock, Harris, Ramsey, Shortland, Higham and Rowland2010; Manning et al. Reference Manning, Griggs, Lorentzen, Ramsey, Chivall, Jull and Lange2018) our data raise some important questions. Overall, they indicate that during the period 1700–1500 BC there are no large scale (>10) 14C yr offsets between Northern Hemisphere trees. The scale of the offset of the annual data from IntCal13 however is comparable with some previously identified regional differences, indicating that care should be taken to test for potential “curve composition” effects in future studies focused on regional variability. It may also be prudent to test some previously identified “regional offsets” to rule out this possibility, where either all measurements for multiple growth locations are performed by the same laboratory, or the laboratories involved in the test can demonstrate a high level of intercalibration (as demonstrated in this exercise).
Conversely, the potential to isolate consistent <10 14C yr differences between trees from different regions should also be further tested. If such trends are analytical noise, then they are useful in defining and illustrating the most realistic possible error ranges related to the construction and use of portions of the calibration curve based on annual data 14C data. If they are real, they might offer insight on future ways to optimize regional radiocarbon calibration. For example, according to the definitions of Hua et al. (Reference Hua, Barbetti and Rakowski2013), the Irish oaks grew in radiocarbon zone NH1 and the bristlecone pine and juniper in radiocarbon zone NH2. While the relevance of this zoning (developed during the bomb spike period) requires further testing for annual 14C in earlier time periods, it may be that a more accurate calibration for NH2 materials might be derived from trees in that region, or by extrapolating correction factors based on the latitude of samples to be dated. The improvement in dating would unlikely be major, but in combating the dating issues surrounding 14C plateaus, this information might be useful. For example, in terms of the debate over the Minoan eruption of Thera, the calendar dated NH2 bristlecone pine might be a more appropriate dataset against which to calibrate NH2 archaeological materials. If this is the case, this information could also be employed in defining broader error associated with the calibration and modeling process.
Examination of the data as Δ14C demonstrated that inter-laboratory agreement is possible for subdecadal patterns in Δ14C from different regions across features with increases or decreases in Δ14C of as little as 4‰. The Δ14C features refined around 1680 BC, 1600 BC, 1528 BC and 1480 BC can also be observed in the coarser resolution data of IntCal13 (Reimer et al. Reference Reimer, Bard, Bayliss, Beck, Blackwell, Bronk Ramsey, Buck, Cheng, Edwards, Friedrich, Grootes, Guilderson, Haflidason, Hajdas, Hatté, Heaton, Hoffmann, Hogg, Hughen, Kaiser, Kromer, Manning, Niu, Reimer, Richards, Scott, Southon, Staff, Turney and van der Plicht2013), however our data allow for more precise, annually resolved description of these. Possible 14C “events” around 1557 and 1528 BC warrant further investigation. All of this opens up new opportunities for geophysical, solar and astrophysics research as well as providing a number of marker points for synchronization with ice core 10Be or as a means to secure floating tree-ring chronologies within this time period.
ACKNOWLEDGMENTS
We thank T. Lange, R. Cruz, J. Nordby for work on sample preparation and AMS analysis at the University of Arizona AMS Laboratory. We thank A.J.T. Jull and D. Frank for helpful discussion and M. Munro for early work on the Timahoe samples. Preparation of dendrochronological samples and metadata from the Irish oak was funded by Historic England. AMS analysis was supported by ETH Zürich, the University of Arizona and the Malcolm H. Wiener Foundation as part of the Interdisciplinary Chronology of Civilizations Project (ICCP; PI Pearson).
SUPPLEMENTARY MATERIAL
To view supplementary material for this article, please visit https://doi.org/10.1017/RDC.2020.14


 Open access