


INTRODUCTION
Radiocarbon (14C) is present in the environment from three sources: natural production (cosmogenic interaction of 14N in upper atmosphere), release from atmospheric tests, and routine release from nuclear installations. 14C is a low energy beta emitter (Emax: 156 kev and Eavg: 49.5 kev) with long radioactive half-life: 5700 ± 30 yr (Kutschera Reference Kutschera2013). 14C is produced in the atmosphere by a variety of reactions, the most important being between thermalized neutrons from cosmic radiation and nitrogen atoms (Davis et al. Reference Davis1977). The annual cosmogenic production rate of 14C by this process is 1.4 × 10⁶ GBq, and the total inventory of 14C in the atmosphere was estimated to be 1.4 × 10⁸ GBq (IAEA 2004). It has been estimated that a total of 2.2 × 10⁸ GBq 14C was released to the atmosphere by nuclear weapon testing, causing a significantly increased concentration of 14C in the atmosphere in 1950–1960 (IAEA 2004). It has been estimated that about 1.1 × 10⁶ GBq of 14C is produced yearly in the nuclear power plants all over the world, in which about 1.1 × 10⁵ GBq is released to the atmosphere as gaseous form from all operating nuclear power plants and about 3.7 × 10⁵ GBq in both gaseous and liquid forms is released from the reprocessing plants (UNSCEAR 2000). The production rate and pathway of 14C in the nuclear power plants vary with the type of power plants, the concentrations of oxygen and nitrogen in the fuel, structural materials, moderator, and coolant.
14C is an important radionuclide for reactors using heavy water because of larger production than the pressurized water reactor (PWR) and boiling water reactor (BWR) (Graven et al. Reference Graven and Gruber2011). 14C production is more in moderator (Joshi et al. Reference Joshi, Ramamirtham and Soman1987; Peterson et al. Reference Peterson, Davis and Rao1997). The reasons behind higher 14C production and emission in a pressurized heavy water reactor (PHWR) compared to a light water reactor (PWR, BWR) are as follows: (a) average thermal neutron flux in PHWR is higher than LWR, so a large amount of D2O is present in high thermal neutron fluxes at PHWR, because of this large inventory of 17O arises; and (b) isotopic abundance of 17O in D2O used in PHWR is higher than in H2O at LWR (Sohn et al. Reference Sohn, Kang and Kim2012). In PHWR, the majority of 14C releases in the form of 14CO2 through the stack (Robertson et al. Reference Robertson1978). It is reported that 14C-free fossil carbon added to atmospheric CO2 by combustion dilutes the atmospheric 14C/12C ratio. However, releases of 14C from nuclear power plants may affect this dilution and may bias 14C/12C based estimates of fossil-fuel-derived CO2 if these nuclear influences are not correctly accounted for (Graven et al. Reference Graven and Gruber2011; Lassey et al. Reference Lassey, Etheridge, Lowe, Smith and Ferretti2007a, Reference Lassey, Lowe and Smith2007b). 14CO2 in air in the vicinity of a nuclear power plant thus becomes important to be monitored, to check % rise of natural background level, if any (Vokal et al. Reference Vokal and Kobal1997; Stenström et al. Reference Stenström, Skog, Thornberg, Erlandsson, Hellborg, Mattsson and Persson1998; Molnár et al. Reference Molnár, Bujtás, Svingoré and Světlík2007; Povinec et al. Reference Povinec, Sivo, Simon, Holý, Chudý, Richtáriková and Morávek2008, Reference Povinec, Chudy, Sivo, Simon, Holy and Richtarikova2009; Dias et al. Reference Dias, Stenström, Bacelar Leão, Santos, Nícoli, Skog, Ekström and da Silveira Corrêa2009).
Considering the significance, a systematic study on the measurement of 14CO2 activity in air at NPP stack (onsite) and at micrometeorological laboratory of Environmental Survey Laboratory (ESL) (at 1.6 km from NPP stack) was carried out, correlated with various meteorological parameters are presented in this paper.
MATERIALS AND METHODS
Site Description and Study Area
This study was carried out at Kakrapar Gujarat nuclear power plant site, situated on the southern bank of Moticher Lake, which is about 85 km by road from Surat city, in the southern region of Gujarat State (latitude 21º14'N; longitude 73º22'E) (Figure 1A). The Kakrapar Gujarat site is comprised of two nuclear power reactors (PHWR type) with a capacity of 220 MWe each (KAPS-1&2). Unit-1 of the power station started commercial operation in May 1993 and Unit-2 in September 1995. One common 100-m-high stack is for both reactors (Kakrapar Atomic Power Station-1&2). Samplings were carried out at the reactor stack (onsite) and at the ESL meteorology laboratory (1.6 km away from the reactor in the NNE downwind sector) (Figure 1B). Both reactors: Unit-1 and Unit-2 were operated in 100% during our sampling event. Meteorological parameters such as wind speed, wind direction, ambient temperature, relative humidity, atmospheric pressure, solar radiation, and rainfall are measured at the micrometeorological laboratory of ESL, Kakrapar Gujarat Site. Statistical correlation between the dilution factor of 14CO2 at 1.6 km (NNE sector) with influencing meteorological parameters were studied for 72 different sampling events, and correlation coefficient (r) and p value (two-tailed) are tabulated in Table 3.

Figure 1A Satellite map around Kakrapar Atomic Power Station.

Figure 1B Environmental monitoring map along with sampling locations.
Air Sample Collection and Processing
Some portion of the effluent gas from the exhaust air of KAPS-1&2 stack was sampled at a rate of 2 lpm and passed through 200 mL of 1M NaOH solution for one hour duration. Simultaneously,14CO2 in air was collected at ESL meteorology laboratory and absorbed in 20 mL of 1M NaOH solution at 2 lpm for 1-hr duration using handheld air sampler (Figure 2). The experiment was conducted during 23/06/2021 to 31/08/2021, and 72 samples were collected from each location. The samples were processed as per standard procedure (Joshi et al. Reference Joshi, Ramamirtham and Soman1987; Baburajan et al. Reference Baburajan, Dalvi, Sudheendran, Varakhedkar, Saradhi, Ravi and Karunakara2020). The Na2CO3 generated in the sample was precipitated as BaCO3 by externally adding 20% BaCl2 solution and then centrifuged. BaCO3 precipitate was washed twice by using 40% alcohol in distilled water, and dried under an IR lamp. A known quantity of precipitate was introduced in the acidification setup (Figure 3). 1–2 mL of aqueous solution (88%) of lactic acid is added into dried precipitate of BaCO3. Evolution of CO2 from BaCO3 is reabsorbed in ethanol amine and methanol (1:4 V/V) absorbing mixture of 10 mL. This was kept overnight. 10 mL of Ultima gold LLT cocktail was added to this mixture, properly homogenized and then counted for 14C in an ultra-low background liquid scintillation spectrometer (LSS) (Model: Quantulus-1220 by Perkin Elmer).
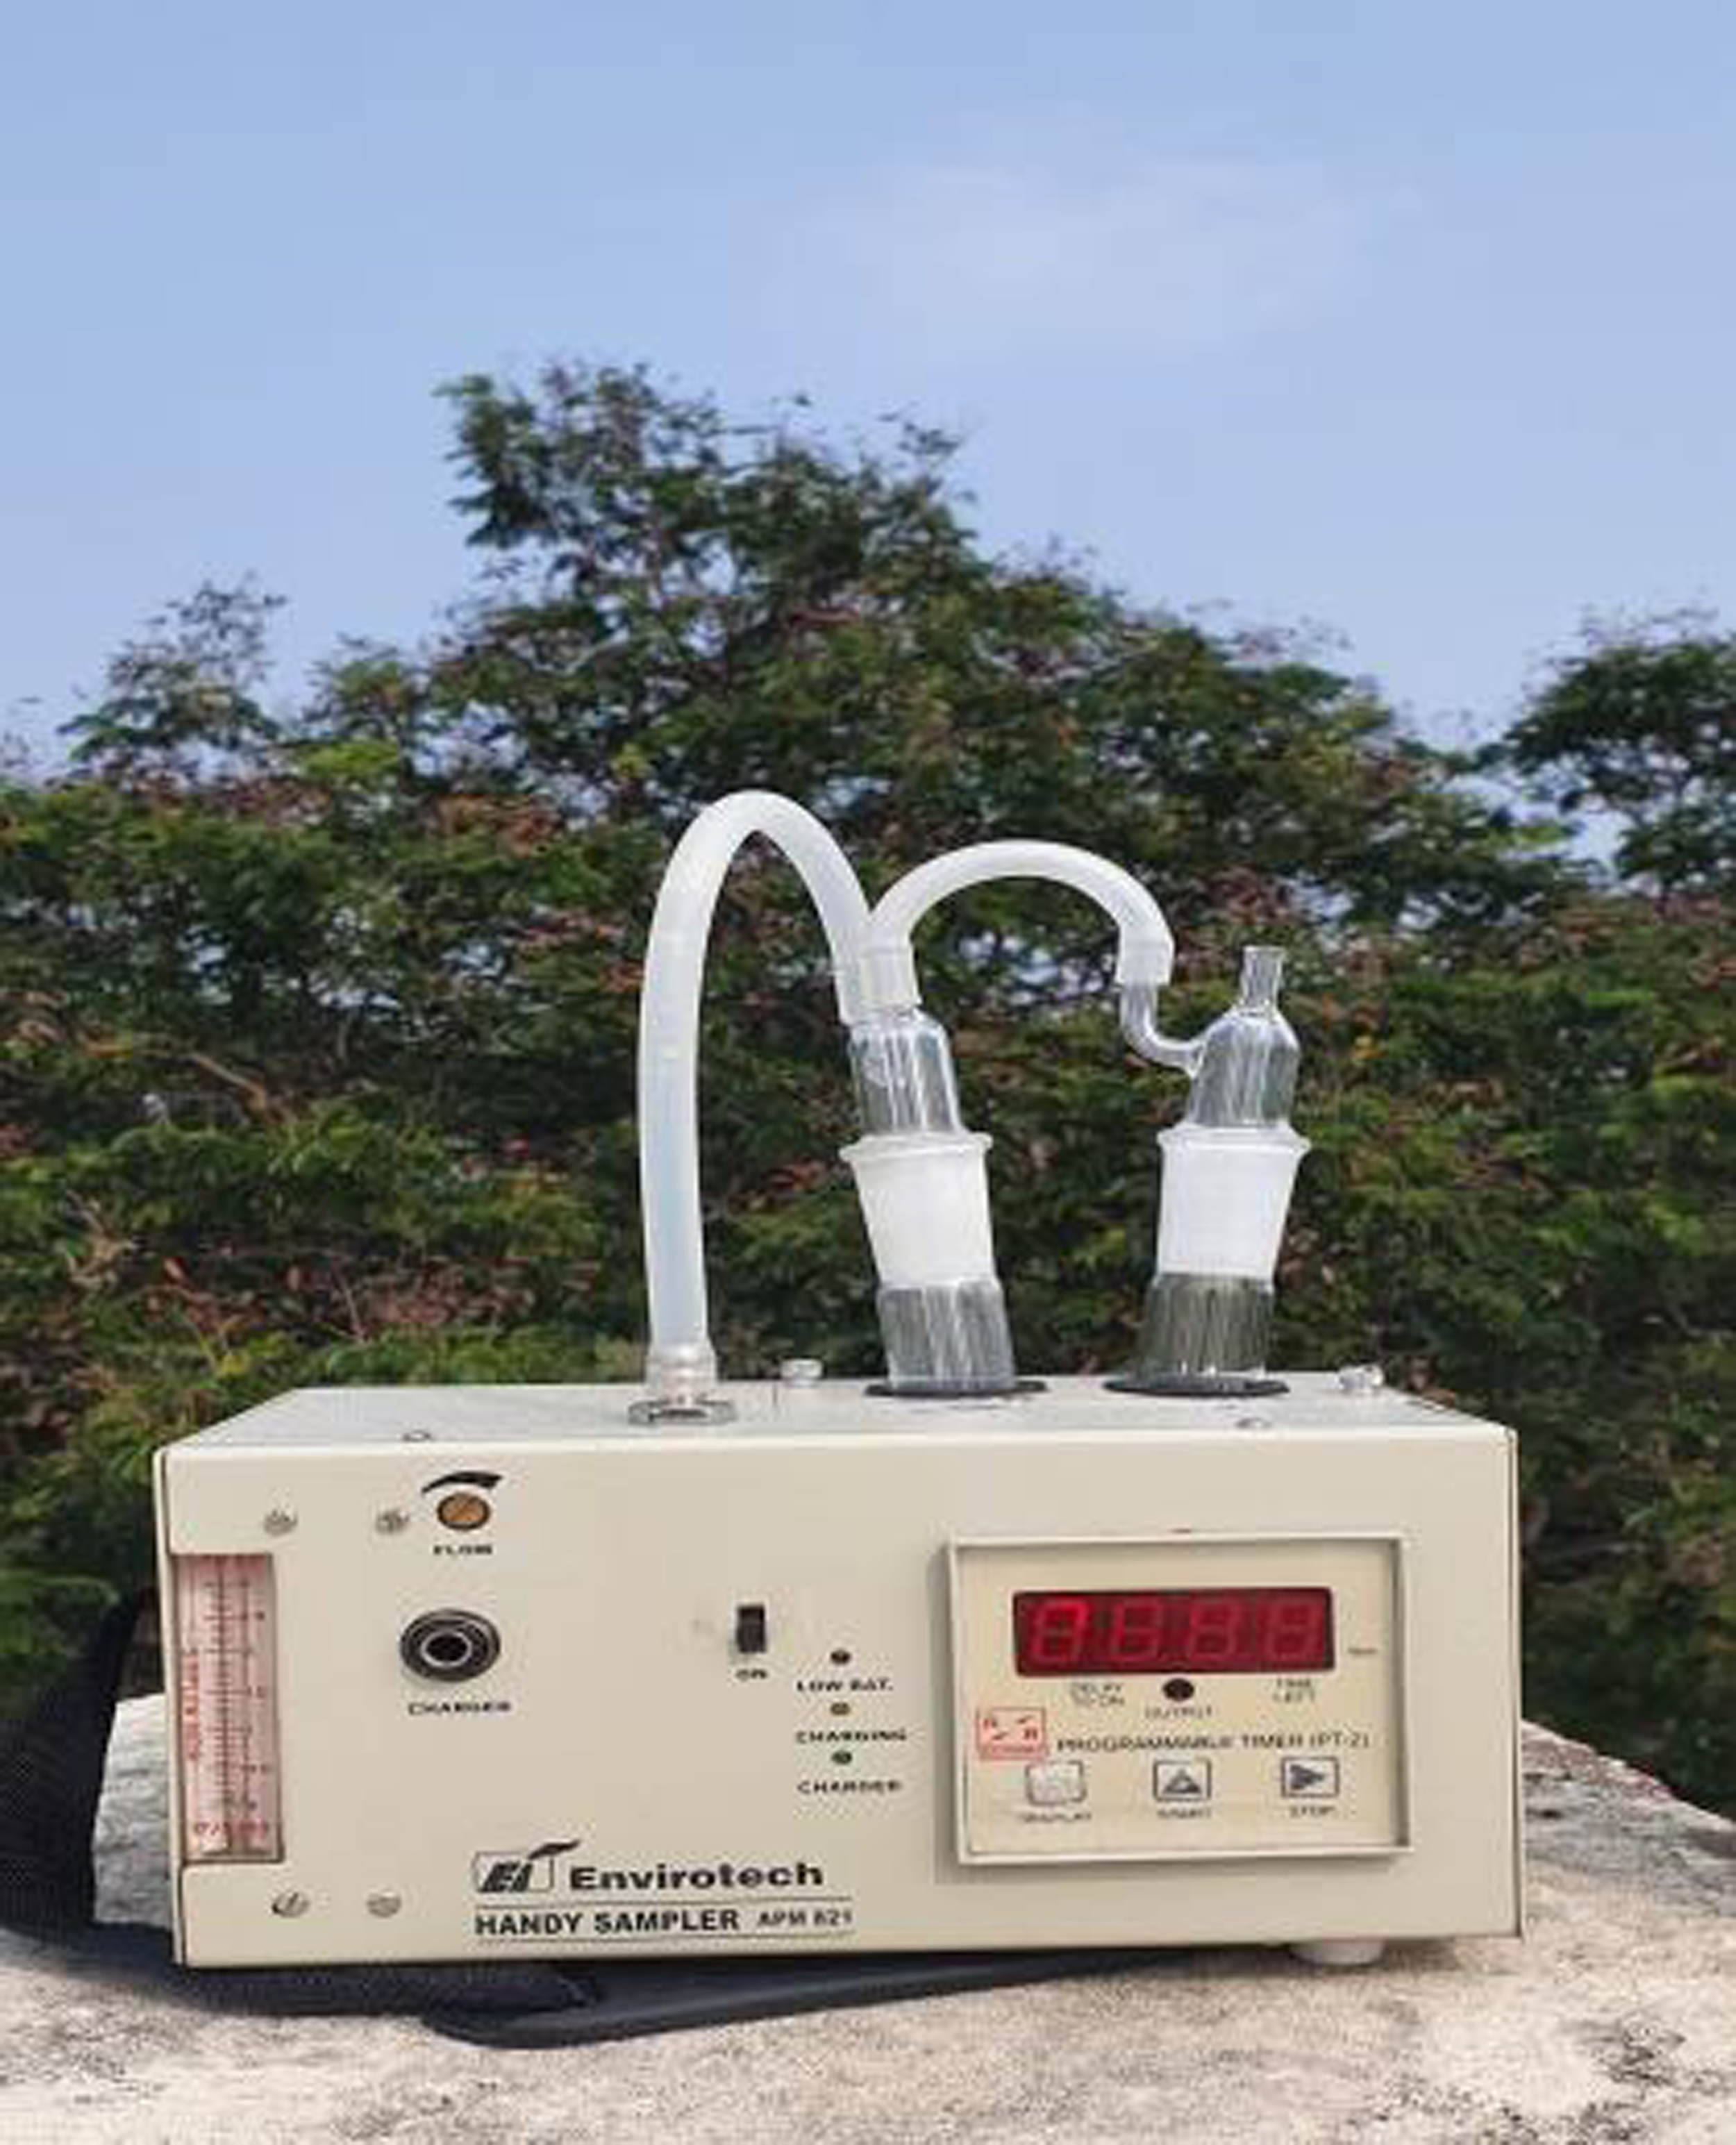
Figure 2 Handheld air sampler used for bubbling air sample through NaOH solution.

Figure 3 Acidification setup for regeneration of 14CO2 absorbed in the organic solvent.
Methodology for Calculating 14CO2 Activity and Uncertainty in the Analysis
14CO2 activity in air sample was calculated using the standard Equation (1) (Baburajan et al. Reference Baburajan, Dalvi, Sudheendran, Varakhedkar, Saradhi, Ravi and Karunakara2020)
 $${\rm{A}} = \;{{{\rm{Net}}\;{\rm{CPM}}} \over {\left( {60{\rm{*E*V*F*R*Q}}} \right)}}\;\; \pm \;\;\;{{\sqrt {{{{\rm{SC}}} \over {{\rm{Ts}}}} + {{{\rm{BC}}} \over {{\rm{Tb}}}}} } \over {\left( {60{\rm{*E*V*F*R*Q}}} \right)}}$$
Where A: 14CO2 activity in Bq m-3. Net CPM = SC – BC (SC: sample CPM, BC: background CPM of chemical blank).
Volume of air sampled (V) in m3 = 0.12.
E: LSS counting efficiency in fraction, which is 0.75 or 75% in our system (using14C standard spiked to ethanol amine-methanol absorbing mixture). Region of interest in channel (ROI: 130-340) was decided such that figure of merit comes more than 4000 in LSS.
F: fraction of CO2 absorption in NaOH solution at single stage of impinger/bubbler.
Based on the four set of experiments carried out, mean F value for stack and environmental samplings were found to be 0.44 ± 0.03 and 0.56 ± 0.024, respectively.
R: recovery factor (analytical yield calculated from first step: precipitation of BaCO3 to last step: reabsorbed CO2 in absorbing mixture), known inorganic form 14C activities of following: 14.79, 29.58, 44.37, 59.16, and 73.95 Bq spiked to 1M NaOH solutions of 200 mL (for stack sample) and 20 mL (for environmental sample). Recovery factor was calculated from 14C spiked activity and 14C recovered activity. Mean recovery factor of five set of data was found to be 0.80 ± 0.06 and 0.82 ± 0.07 for stack and environmental sample, respectively.
Q: Fraction of BaCO3 which is introduced in acidification setup wrt total BaCO3 yield, ≤1.
Ts and Tb: LSS operating time in minutes of sample and background, respectively. In our case Ts = Tb.
Overall uncertainty (U) of the mentioned procedure for 14CO2 measurement in air sample was computed using Equation (2) (IAEA-TECDOC-1401 2004; Baburajan et al. Reference Baburajan, Dalvi, Sudheendran, Varakhedkar, Saradhi, Ravi and Karunakara2020).
 $$U = \sqrt {{{({{\rm{U}}_1})}^2} + {{\left( {{{\rm{U}}_2}} \right)}^2} + {{\left( {{{\rm{U}}_3}} \right)}^2} + {{\left( {{{\rm{U}}_4}} \right)}^2} + {{({{\rm{U}}_5})}^2}} $$
Sources of relative uncertainties are U1 to U5.
U1: Sampling uncertainty in % (by taking single stage bubbler)
U2: Weighing (BaCO3 precipitate) uncertainty in %
U3: Recovery factor uncertainty in %
U4: LSS efficiency calibration uncertainty in %
U5: LSS count rate uncertainty in %
Each uncertainty component was quantified. U1 and U3 were calculated by using coefficient of variation in %. For stack (200 mL) and environmental sampling (20 mL), U1 were 6.81% and 4.28%, respectively and U3 were 7.50% and 8.53%, respectively. U2 was 0.1% as per the manufacture certification of our electronic weighing balance. U4 was 1.3%. U5 is based on Equation (3) (Huang et al. Reference Huang, Guo, Wu, Zhang, Chen, Zhang, Qin and Shang-Guan2015).
 $${{\rm{U}}_5} = {{\sqrt {{{{\rm{SC}}} \over {{\rm{Ts}}}}\; + \;{{{\rm{BC}}} \over {{\rm{Tb}}}}} } \over {{\rm{SC}} - {\rm{BC}}}}*100$$
In order to detect low level of activity, counting time is increased which reduces counting uncertainty. For environmental sample (Ts = Tb = 1440 min) and stack sample (Ts = Tb = 60 min), the calculated U5 is 8.25% and 2.45%, respectively.
By putting the value of all relative uncertainties in equation 2, overall uncertainty (U) was found to be 13% and 11% for environmental and stack sample, respectively.
Minimum Detectable Level (MDL) of 14C in Air
MDL of 14C in air Bq m–3 at a confidence level of 99.7% is calculated as per Equation (4);
 $${\rm{MDL}} = {{3{\rm{*}}\sqrt {{{{\rm{BC}}} \over {\rm{T}}}} } \over {60{\rm{*E*V*F*R*Q}}}}$$
For Quantulus-1220 LSS, BC = 1.07 CPM; T = 1440 minutes; counting efficiency (E) = 75%, Uncertainty in MDL is calculated by using error propagation. Since environmental data are reported at 95% confidence level, the uncertainty corrected MDL value is 0.032 ± 0.008Bq m–3, varies from 0.024 to 0.04Bq m–3. By taking upper limit, MDL is considered as 0.04Bq m–3.
Gaussian Plume Dispersion Model for 14CO2 Activity Prediction
Using basic Gaussian plume dispersion model (GPM) (Equation [5]), 14CO2 activity is calculated.
 $$\chi \left( {{\rm{x}},{\rm{y}},{\rm{z}}} \right) = {{\rm{Q}} \over {2.\pi .{\rm{u}}.{\sigma _{\rm{y}}}.{\sigma _{\rm{z}}}}}{\rm{*}}\exp \left( { - {{{{\rm{y}}^2}} \over {2.{\sigma _{\rm{y}}}^2}}} \right){\rm{*}}\left[ {\exp \left( { - {{{{\left( {{\rm{z}} - {\rm{H}}} \right)}^2}} \over {2.{\sigma _{\rm{Z}}}^2}}} \right) + \exp \left( { - {{{{\left( {{\rm{z}} + {\rm{H}}} \right)}^2}} \over {2.{\sigma _{\rm{Z}}}^2}}} \right)} \right]$$
For the above equations, the origin is at the base of the stack, and x-, y-, and z- axes are in the horizontal downwind, horizontal cross-wind and the vertical directions, respectively. The symbols used are: χ (x,y,z) = mean effective 14CO2 concentration Bq m–3 of the effluent at a point (x,y,z) in the plume; y = cross wind distance in (m) from the center line of the plume; z = height above ground in (m) where concentration is calculated; u = mean velocity in the x-direction (m s–1) at stack height 100 m; H = the effective height of release (m), Q = 14CO2 source strength in Bq s–1 which is emitted in CO2 gaseous form from stack; ${\sigma _{\rm{y}}}$
and
${\sigma _{\rm{y}}}$
and ${{\rm{\sigma }}_{\rm{z}}}$
in (m) = standard deviations of the assumed normal distribution at distance x in the cross-wind and vertical directions respectively which depends upon the stability category and downwind distance between source and receptor, the dispersion parameters are used which is based on Pasquill–Guifford scheme (Eimutis and Konicek Reference Eimutis and Konicek1972). Meteorological parameters such as wind speed, wind direction, ambient temperature, relative humidity, atmospheric pressure, solar radiation, and rainfall are measured at micrometeorological laboratory of Environmental Survey Laboratory of Kakrapar Gujarat Site. As GPM is dependent upon source strength and meteorological parameter, 14CO2 activity of NPP stack, micro-meteorological monitoring of wind speed, wind direction and atmospheric stability data were used for the prediction of 14CO2 activity in the air samples collected at 1.6 km towards NNE downwind sector.
${{\rm{\sigma }}_{\rm{z}}}$
in (m) = standard deviations of the assumed normal distribution at distance x in the cross-wind and vertical directions respectively which depends upon the stability category and downwind distance between source and receptor, the dispersion parameters are used which is based on Pasquill–Guifford scheme (Eimutis and Konicek Reference Eimutis and Konicek1972). Meteorological parameters such as wind speed, wind direction, ambient temperature, relative humidity, atmospheric pressure, solar radiation, and rainfall are measured at micrometeorological laboratory of Environmental Survey Laboratory of Kakrapar Gujarat Site. As GPM is dependent upon source strength and meteorological parameter, 14CO2 activity of NPP stack, micro-meteorological monitoring of wind speed, wind direction and atmospheric stability data were used for the prediction of 14CO2 activity in the air samples collected at 1.6 km towards NNE downwind sector.
Estimation of Atmospheric Dilution Factor
The atmospheric dilution factors are important indicators of diffusive properties of the site. They are useful for estimating the annual averaged concentration distribution of gaseous effluents released from nuclear facilities. There are two ways to estimate atmospheric dilution factors. One way is routinely measured hourly meteorological data are used in the preparation of diffusion climatology of the site which in turn is used to estimate the dilution factors. Another way is to experimentally evaluate the dilution factor by taking the ratio of source/release point measuring contaminant activity to receptor of interest measuring contaminant activity. An attempt was made to evaluate the site specific atmospheric dilution by measuring 14CO2 activity at NPP stack and at 1.6 km towards NNE downwind sector. Dilution factor of 14CO2 at 1.6 km depends upon two important parameters: (a) source strength and (b) meteorological parameters.
RESULTS AND DISCUSSION
14CO2 Activity in Air Samples
14CO2 activity in air along with meteorological parameters is tabulated in Table 1. 14CO2 activity was found at the range of (0.10 ± 0.01) – (0.18 ± 0.01) TBq (GWe.year) –1, with mean value 0.12 ± 0.01 TBq (GWe.year)–1 at NPP stack which is comparable with other PHWR type reactor (Bharath et al. Reference Bharath, D’Souza, Rashmi, Dileep, Ravi, Mangavi, Salunke, Veerendra and Karunakara2022 and Sohn et al. Reference Sohn, Kang and Kim2012). Bharath et al. (Reference Bharath, D’Souza, Rashmi, Dileep, Ravi, Mangavi, Salunke, Veerendra and Karunakara2022) studied the 14C activity at Indian PHWR, Kaiga Generating Station (KGS) during the year 2017–2020 and reported the normalized 14C emission with geometric mean value of 0.12 TBq (GWe.year)–1. Bharath et al. (Reference Bharath, D’Souza, Rashmi, Dileep, Ravi, Mangavi, Salunke, Veerendra and Karunakara2022) also reported that the 14C released in oxide form (CO2) and less than 1.27 % of total release in reduced form (CH4). Sohn et al. (Reference Sohn, Kang and Kim2012) estimated the 14C inventory of CANDU PHWR type reactor at Wolsong Nuclear Power Plant and normalized measured emission observed to be 0.14 and 0.16 TBq (GWe.year)–1 during the year 2001 and 2000, respectively. To detect lower 14CO2 activity in environmental samples, counting time increases and MDL of 14C in air Bq m–3 at a confidence level of 99.7% is 0.04 Bq m–3. 14CO2 activity was found to be in the range of ≤0.04 – (0.13±0.033) Bq m–3, with mean value 0.08 ± 0.02 Bq m–3 at site boundary (1.6 km towards NNE) and is comparable with worldwide values as shown in Table 2. 14CO2 environmental activity data with similar sampling distance are comparable with other PHWRs type reactors: Tarapur Maharashtra Site, India, and Wolsong site, South Korea, as reported in Table 2. One data point was found to be BDL (≤0.04 Bq m–3) at site boundary and all other detectable values are comparatively very low as compared to exhaust air of KAPS-1&2 stack. As a part of the reference sampling for the determination of 14CO2 activity in air, the sampling was carried out at 30–35 km from Kakrapar Gujarat nuclear power plant site, and 14CO2 activity was ≤0.04 Bq m–3. Factors affecting 14CO2 activity measured at 1.6 km fence post are source strength and meteorological parameter (inter-angle and rainfall), other meteorological parameters do not have much influence in dilution of 14CO2 activity at 1.6 km. It is observed that as the 14CO2 activity released from NPP stack (source strength) increases, 14CO2 activity measured at 1.6 km fence post increases and a positive statistically significant correlation is observed (correlation coefficient (r): 0.42 and p value = 0.00024 (two-tailed).
Table 1 14CO2 activity in air samples with associated meteorological parameters.

* Number of samples = 72.
Table 2 Comparison of 14CO2 activity in air samples with worldwide data.

Correlation of Observed 14CO2 Activity in the Air Samples with the Predicted Activity
14CO2 activity in the air samples were predicted using Gaussian plume dispersion model (GPM) for 72 different sampling events. Predicted activity was varying from 10–8 - 0.0025 Bq m–3 at 1.6 km for all the 72 sampling events. There is a large variation of predicted 14CO2 activity. GPM calculation is highly dependent upon inter angle between plume direction and the fixed sampling location. As the inter angle is larger, the 14CO2 activity decreases significantly. When the plume direction is towards NNE sector, then predicted 14CO2 activity calculated using GPM was 0.001–0.0025 Bq m–3 and is lower than the measured activity ≤0.04–0.13 Bq m–3. Dias et al. (Reference Dias, Stenström, Bacelar Leão, Santos, Nícoli, Skog, Ekström and da Silveira Corrêa2009) and Varga et al. (Reference Varga, Orsovszki, Major, Veres, Bujtás, Végh, Manga, Jull, Palcsu and Molnár2020) reported that the dilution and dispersion of 14CO2 do not follow GPM. The main reason behind this is CO2 density is larger than that of air density (Molnár et al. Reference Molnár, Bujtás, Svingoré and Světlík2007) and GPM equation does not account density explicitly. Out of 72 sampling events, in 37 events wind speeds are less than 2.5 m s–1 at 30 m height, and at 25 events wind speeds are 2.5–5 m s–1. This indicates low wind speed is observed in our region during the sampling event and the model does not give precise results during low wind speeds.
Estimation of Dilution Factor for 14CO2 Activity
Dilution factor of 14CO2 at 1.6 km depends upon two important parameters: (a) source strength and (b) meteorological parameters. Based on the 14CO2 activity measured at two different locations (NPP stack and at 1.6 km), dilution factor (s m–3) for 14CO2 was evaluated by taking the ratio of 14CO2 activity at 1.6 km (Bq m–3) to 14CO2 emission from NPP stack (Bq s–1). The dilution factor for 14CO2 was found to be in the range of 4.6E-05 to 21E-05 s m–3 as shown in Table 1. In Table 3, p<0.05 was observed for only two parameters: inter-angle and rainfall, which were statistically significant. Negative correlation was observed in inter-angle and rainfall. This implies the dilution factor increases, i.e., ambient activity increases with decreasing inter-angle and rainfall. Other parameters such as stability class, RH, WS, and AT were not showing any statistical significance. Variation of 14CO2 dilution factor at 1.6 km (NNE Sector) with (a) Inter angle (degree) between plume direction and fixed sampling location: 1.6 km (NNE Sector); (b) presence/absence of rainfall (mm) are represented through Box and whisker plot (Figure 4 a–b). In Figure 4a, at inter-angle 80–120 degree, an asterisk indicates lowest observed dilution factor 4.6E-05 s m–3 due to highest rainfall (7 mm) which occurred during that sampling period. During the study period, sampling was carried out on twelve different rainy days (0.5–7 mm hr–1) and 14CO2 activity in air sample was significantly lower during the rainy days. The reduction of 14CO2 activity in air samples is due to the washout of 14CO2 in rain water. Contribution of rainfall in 14CO2 dilution factor played an important role and was also reported by Pathakoti et al. (Reference Pathakoti, Gaddamidi, Gharai, Sudhakaran Syamala, Venkata Narasimha Rao, Choudhury, Venkata Raghavendra and Dadhwal2018). When the plume direction was towards the receptor of interest, 14CO2 activity is higher. The highest dilution factor of 21E-05 s m–3 was observed when inter-angle was smallest (1 degree), which can also be visualized from Figure 4a. From Figure 5, one can visualize that most of the 14CO2 activity are nearly 0.08 Bq m–3. Out of 72 sampling events, activity data are more than 0.10 Bq m–3 in 11 cases. In those 11 cases, plume direction was towards our sampling location, i.e., NNE sector (smaller inter-angle) in 7 cases and in remaining 3 cases, NPP stack (onsite) 14CO2 source strength was little higher from average observed release 0.12 TBq (GWe.year)–1. Therefore, 14CO2 activity in environmental air samples is mainly dependent upon plume direction.
Table 3 Statistical correlation between dilution factor (s m–3) of 14CO2 with meteorological parameters.


Figure 4 Variation of 14CO2 dilution factor with inter angle (a) and rainfall (b).

Figure 5 Variation of 14CO2 activity (Bq m–3) in air samples at 1.6 km, NNE sector with sampling date and time wise (11 AM–12 AM and 14 PM–15 PM), year: 2021.
CONCLUSIONS
Studies on 14CO2 activity in air samples were carried out at Kakrapar Gujarat site, India where pressurized heavy water nuclear reactors have operated since 1993. 14CO2 activity in air at NPP stack (onsite) and at meteorology laboratory of ESL (at 1.6 km from reactor) are observed to be (0.10 ± 0.01) – (0.18 ± 0.01) TBq (GWe.year) –1, with mean value 0.12 TBq (GWe.year)–1 and ≤0.04 – (0.13 ± 0.033) Bq m–3, with mean value 0.08 ± 0.02 Bq m–3, respectively. Based on the activity measurement, the dilution factor for 14CO2 in air was evaluated at 1.6 km and was found to be in the range of 4.6E-05 to 21E-05 s m–3. The minimum dilution factor is observed on rainy days due to washout of 14CO2 activity from air. Inter angle (degree) between plume direction and fixed sampling location and rainfall (mm) are important influencing parameters for dilution factor of 14CO2 in air. When the plume direction was towards the sampling location, 14CO2 activity was comparatively higher. 14CO2 activity in air was reduced during rain events. The site-specific dilution factor estimation is an important input parameter used for the prediction of radionuclide distribution pattern at different locations.


