


INTRODUCTION
Compound-specific radiocarbon (14C) analysis (CSRA) is a powerful tool for studying the carbon cycle as it provides information about the sources and transport mechanisms of biomarker molecules. A major challenge in CSRA of biomarkers is the low abundance of these specific compounds in natural matrices (e.g. sediments and water) from which they are commonly extracted. This often requires CSRA to work with samples of small sizes (< 100 µgC). Recent improvements in the technology of accelerator mass spectrometry (AMS) permit the radiocarbon analysis of samples as small as ∼1 μgC (Santos et al. Reference Santos, Moore, Southon, Griffin, Hinger and Zhang2007). However, small samples are very sensitive to biases caused by contaminating carbon (carbon of unknown isotopic composition and from unknown sources, defined as blank) that enters the samples during processing in the laboratory. For instance, the discrepancy between blank-uncorrected F14C value of a prepared standard (11 µgC) and its corresponding true F14C value might be as large as 0.229, and this discrepancy even increases as the sample size decreases (Hanke et al. Reference Hanke, Wacker, Hagipour, Schmidt and Eglinton2017). Therefore, it is necessary to carefully assess and correct for the mass and 14C content of the blank.
The preparation of samples for CSRA usually requires a series of complex procedures. An unknown amount of contaminant carbon of unknown F14C value might be introduced into the sample at any of these steps, such as during chemical extraction, isolation of pure compounds with preparative capillary gas chromatography (PCGC) or preparative-high performance liquid chromatography (prep-HPLC), preparation on vacuum line systems, and, in some cases, graphitization (Shah and Pearson Reference Shah and Pearson2007; Ziolkowski and Druffel Reference Ziolkowski and Druffel2009; Feng et al. Reference Feng, Benitez-Nelson, Montluçon, Prahl, McNichol, Xu, Repeta and Eglinton2013). Potential contamination sources include solvents, column bleed (from PCGC, prep-HPLC), carry-over and atmospheric carbon during combustion and vacuum line handling. Combined, these procedural blanks can be large enough to contribute a significant proportion of the mass of purified compound samples or even outweigh the target compound for ultra-small mass samples (Shah and Pearson Reference Shah and Pearson2007). The F14C value of the analyzed samples will significantly deviate from the true values of the target compounds without the proper assessment and correction of procedural blank, which will potentially lead to erroneous interpretation of the biogeochemical characteristics or cycling of the biomarker compounds. Therefore, the assessment of procedural blanks, i.e. the determination of F14C and the mass of the procedural blank (F14Cblank, m blank), is critical for reporting accurate radiocarbon composition.
Several studies have used various approaches to quantify the procedural blank and have attempted to identify the sources of the contaminating carbon. Shah and Pearson (Reference Shah and Pearson2007) measured the masses of procedural blanks from different volumes of effluent from a prep-HPLC system (no sample added) and found masses of the procedural blank to be correlated to the prep-HPLC effluent volumes, which suggests that the procedural blank introduced during the isolation of compounds would vary in proportion to the mass of sample (the larger size samples require larger effluent volume). They also observed that the blank introduced from combustion is constant and there are some additional blanks introduced during other preparation steps in addition to prep-HPLC and combustion that are difficult to identify. Ziolkowski and Druffel (Reference Ziolkowski and Druffel2009) have analyzed the mass and F14C of the eluted procedural blank from repeated dry injections (no solvent injected) on PCGC to directly evaluate the blank introduced from the PCGC separation step. An indirect method of determining the F14C of PCGC isolated size-series of paired standard compounds (one modern, one fossil) has also been used to calculate the masses of modern and fossil blanks introduced during the PCGC step. Ziolkowski and Druffel (Reference Ziolkowski and Druffel2009) have shown that the direct and indirect methods agree in the assessment of the mass and F14C of procedureal blank and half of the procedural blank is introduced before PCGC isolation and likely from the chemical extraction step. In the study of Tao et al. (Reference Tao, Eglinton, Montluçon, McIntyre and Zhao2015), the authors added modern and fossil standards of known F14C values into solvent blanks and used the deviation between the measured and known F14C values to indirectly assess the amount of modern and fossil blanks. Santos et al. (Reference Santos, Southon, Drenzek, Ziolkowski, Druffel, Xu, Zhang, Trumbore, Eglinton and Hughen2010) proposed an approach to consider the amount of modern and fossil procedural blanks as integrated components which are a combination of all potential sources. Hanke et al. (Reference Hanke, Wacker, Hagipour, Schmidt and Eglinton2017) separated the procedural blank into 14C-depleted and modern components and varied their masses to obtain the best m blank and F14Cblank by chi-square fitting.
As stated above, preparing samples for CSRA involves many steps. Although it is possible to quantify the mass and F14C value of extraneous carbon from each step (Hanke et al. Reference Hanke, Wacker, Hagipour, Schmidt and Eglinton2017) and potentially helpful when attempting to minimize the procedural blank, such work can be very time consuming depending on the preparation steps included, which may further increase the workload required for CSRA analysis. In addition, a detailed assessment of contaminating carbon contributions from each step will further complicate the error propagation during the correction for the procedural blank and introduces additional large uncertainties into the final F14C data. Therefore, a simplified but precise approach for blank assessment, which integrates over all preparation steps and avoids the detailed determination of individual contaminant sources, is highly needed for CSRA analysis—especially for small samples.
Here, we present a protocol for blank assessment that is relatively easy to achieve without complicated calculation or labor-intensive laboratory procedures. It is based on existing methods (Donahue et al. Reference Donahue, Linick and Jull1990; Hwang and Druffel Reference Hwang and Druffel2005; Santos et al. Reference Santos, Moore, Southon, Griffin, Hinger and Zhang2007) and advances them by the application of a Bayesian model to more accurately account for uncertainties. As a case study, we apply our method to two different biomarker compound classes (n-alkanoic acid and lignin phenols), both commonly targeted for CSRA, to test whether it is practical for different compounds and preparation procedurals.
BLANK ASSESSMENT
In our approach we neither focus on the extraneous carbon added through individual preparation steps, nor attempt to determine modern C and fossil C contamination separately. Instead, the procedural blank is considered integrally. This approach is based on a hypothesis stated in the studies of Hwang and Druffel (Reference Hwang and Druffel2005) and Santos et al. (Reference Santos, Moore, Southon, Griffin, Hinger and Zhang2007) according to which the mass and F14C value of the integral procedural blank is generally constant per batch of samples handled with the same preparation protocol for a certain class of compounds. Relying on this assumption, the measured mass and F14C value of a processed sample consists of the pure compound of interest and the constant contaminant (blank). Thus, the measured mass (m) and F14C value of a processed sample can be described as Equation (1) and (2), respectively (Hwang and Druffel Reference Hwang and Druffel2005).
 $${m_{{\rm{sample}}}} = {m_{{\rm{true}}}} + {m_{{\rm{blank}}}}$$
(1)
$${m_{{\rm{sample}}}} = {m_{{\rm{true}}}} + {m_{{\rm{blank}}}}$$
(1)
 $${{\rm{F}}^{14}}{{\rm{C}}_{{\rm{sample}}}} = {{\rm{F}}^{14}}{{\rm{C}}_{{\rm{true}}}} \times \left( {{{{m_{{\rm{true}}}}} \over {{m_{{\rm{sample}}}}}}} \right) + {{\rm{F}}^{14}}{{\rm{C}}_{{\rm{blank}}}} \times \left( {{{{m_{{\rm{blank}}}}} \over {{m_{{\rm{sample}}}}}}} \right)$$
(2)
$${{\rm{F}}^{14}}{{\rm{C}}_{{\rm{sample}}}} = {{\rm{F}}^{14}}{{\rm{C}}_{{\rm{true}}}} \times \left( {{{{m_{{\rm{true}}}}} \over {{m_{{\rm{sample}}}}}}} \right) + {{\rm{F}}^{14}}{{\rm{C}}_{{\rm{blank}}}} \times \left( {{{{m_{{\rm{blank}}}}} \over {{m_{{\rm{sample}}}}}}} \right)$$
(2)
Where m sample, m true and m blank refer to the mass of carbon of the processed sample, the pure compound and the procedural blank, respectively. F14Csample, F14Ctrue and F14Cblank are the F14C values of a processed sample, the pure compound and the procedural blank, respectively. Equation (2) can be rearranged to show the relation between F14Csample and m sample:
 $${{\rm{F}}^{14}}{{\rm{C}}_{{\rm{sample}}}} = ({{\rm{F}}^{14}}{{\rm{C}}_{{\rm{blank}}}} \times {m_{{\rm{blank}}}} - {{\rm{F}}^{14}}{{\rm{C}}_{{\rm{true}}}} \times {m_{{\rm{blank}}}}) \times {1 \over {{m_{{\rm{sample}}}}}} + {{\rm{F}}^{14}}{{\rm{C}}_{{\rm{true}}}}$$
(3)
$${{\rm{F}}^{14}}{{\rm{C}}_{{\rm{sample}}}} = ({{\rm{F}}^{14}}{{\rm{C}}_{{\rm{blank}}}} \times {m_{{\rm{blank}}}} - {{\rm{F}}^{14}}{{\rm{C}}_{{\rm{true}}}} \times {m_{{\rm{blank}}}}) \times {1 \over {{m_{{\rm{sample}}}}}} + {{\rm{F}}^{14}}{{\rm{C}}_{{\rm{true}}}}$$
(3)
Except for m sample, the other terms in Equation (3) are constant when using differently sized aliquots of the same material. Therefore, Equation (3) shows a linear relation between F14Csample and 1/m sample (Donahue et al. Reference Donahue, Linick and Jull1990; Hwang and Druffel Reference Hwang and Druffel2005; Shah and Pearson Reference Shah and Pearson2007). The intercept (F14Ctrue) is the F14C value of the pure compound and the slope (a) is defined as:
 $${\rm{a}} = {{\rm{F}}^{{\rm{14}}}}{{\rm{C}}_{{\rm{blank}}}} \times {m_{{\rm{blank}}}} - {{\rm{F}}^{{\rm{14}}}}{{\rm{C}}_{{\rm{true}}}} \times {m_{{\rm{blank}}}}$$
(4)
$${\rm{a}} = {{\rm{F}}^{{\rm{14}}}}{{\rm{C}}_{{\rm{blank}}}} \times {m_{{\rm{blank}}}} - {{\rm{F}}^{{\rm{14}}}}{{\rm{C}}_{{\rm{true}}}} \times {m_{{\rm{blank}}}}$$
(4)
This shows the effect of the procedural blank on the measured F14Csample as a function of the sample size (m sample). It allows the procedural blank to be assessed graphically when determining the F14Csample of several aliquots (of different size) of two standard materials, with known F14Ctrue but different values (F14Ctrue1 and F14Ctrue2), ideally one modern and one fossil standard. We can correlate the F14Csample to 1/m sample resulting in two regression lines with two slopes (a1 and a2), which can be used to derive the m blank from their point of intersection:
 $${m_{blank}} = {{{a_1} - {{\rm{a}}_2}} \over {({F^{14}}{C_{true2}} - {F^{14}}{C_{true1}})}}$$
(5)
$${m_{blank}} = {{{a_1} - {{\rm{a}}_2}} \over {({F^{14}}{C_{true2}} - {F^{14}}{C_{true1}})}}$$
(5)
The F14Cblank can then be calculated as:
 $${F^{14}}{C_{blank}} = {{{a_1}} \over {{m_{blank}}}} + {F^{14}}{C_{true1}}\,\,\,or\,\,\,{F^{14}}{C_{blank}} = {{{a_2}} \over {{m_{blank}}}} + {F^{14}}{C_{true2}}$$
(6)
$${F^{14}}{C_{blank}} = {{{a_1}} \over {{m_{blank}}}} + {F^{14}}{C_{true1}}\,\,\,or\,\,\,{F^{14}}{C_{blank}} = {{{a_2}} \over {{m_{blank}}}} + {F^{14}}{C_{true2}}$$
(6)
The chosen standards should contain the same or at least similar biomarker compounds as the set of “real” samples which is intended to be blank corrected. The standards and “real” samples should be processed using identical protocols. The range of chosen sample sizes (m sample) for the standards should include the mass-range covered by the real sample-set and extend across the entire mass range covered by the method, e.g., 10–100 µgC.
For the blank-correction of real samples, robust estimates of the uncertainties in F14Cblank and mblank are critical. In the approach described above F14Cblank and mblank are afflicted with uncertainties stemming from the linear fit and from the measurements of the mass and F14C values of the different sized standards. Both of these should be considered when calculating the intersection point. In earlier studies applying the linear regression for the blank assessment, the standard error of the slopes of the regression lines (Hwang and Druffel Reference Hwang and Druffel2005) or the correlation coefficient r2 of the regression (Shah and Pearson Reference Shah and Pearson2007) were used to assess σ(F14Cblank) and σ(mblank). However, these approaches only account for the uncertainties introduced by the linear fit and do not consider the measurement uncertainties. Accordingly, we introduce a Bayesian model that includes error models for response and predictor variables taking both sources of uncertainty into account. This method allows for easy numerical estimation of the bivariate distribution of the intersection of the two regression lines (from which m blank and F14Cblank are inferred) using the posterior sample of the distribution of the model parameters. The statistical model was written in the Stan language (Carpenter et al. Reference Carpenter, Gelman, Hoffman, Lee, Goodrich, Betancourt, Brubaker, Guo, Li and Riddell2017) and was fitted using the RStan package (Stan Development Team 2018) for Rstudio 1.1383 (R Core Team 2017). The values of 1/m blank and F14Cblank (the intersection point) were constrained to be positive. Weak half-normal priors (mean = 0, sd = 10) were placed on the regression slopes, with the fossil slope constrained to be positive and the modern slope negative. In some special cases where the F14Cblank is higher than the F14Ctrue of the modern standard, the constraint on the modern slope should be removed. When available, F14Ctrue values for the standards were used to place an informative prior on the value of the intercept (F14C value at 1/m = 0). Three chains of the fitting process were run for 5000 iterations and checked for convergence visually and with the Rhat statistics (Gelman and Rubin Reference Gelman and Rubin1992). The output from the Bayesian model is the “posterior distribution,” which consists of a matrix of parameter estimates based on 7500 iterations, 2500 from the second half of each chain. Each iteration provided one paired estimate of F14Cblank and 1/m blank. The median absolute deviation (MAD) is used as a robust measure of uncertainty for error propagation because the intersection is the ratio of the differences in slopes and intercepts, whose distribution has long tails. For normally distributed variables, the expected value of MAD is equal to the standard deviation. The script and the necessary Stan-code file are provided in the supplementary material along with diagnostic plots of the model fit.
CASE STUDIES
We applied this approach to two groups of biomarkers, i.e. n-alkanoic acids (lipid biomarkers) and lignin phenols. For the blank assessment of radiocarbon analysis on lipid biomarkers, n-hexadecanoic acid (n-C16:0 alkanoic acid) from apple peel collected in 2013 (F14C value of bulk OC = 1.031 ± 0.001) was used as modern standard. A commercial n-triacontanoic acid (n-C30:0 alkanoic acid; Sigma-Aldrich Prod. No. T3527-100MG, LOT 018K3760) of known F14C value (0.002 ± 0.001) (Rethemeyer et al. Reference Rethemeyer, Fülöp, Höfle, Wacker, Heinze, Hajdas, Patt, König, Stapper and Dewald2013) as well as n-hexacosanoic acid (n-C26:0 alkanoic acid) and n-octacosanoic acid (n-C28:0 alkanoic acid) extracted from Messel Shale (immature Eocene oil shale, F14C value of bulk OC = 0.0003 ± 0.0002) were used as fossil standards.
For the blank assessment of radiocarbon analysis on lignin phenols, vanillin extracted from woodchips collected in the wood workshop of University of Bremen in 2010 was used as the modern standard and the commercial standard ferulic acid (Sig-Aldrich, Prod. No.12,870-8, Lot STBB6360) of known F14C value (0.0002 ± 0.0004) was used as fossil standard.
The handling of purified standards for 14C analysis was described in the study of Winterfeld et al. (Reference Winterfeld, Mollenhauer, Dummann, Köhler, Lembke-Jene, Meyer, Hefter, McIntyre, Wacker, Kokfelt and Tiedemann2018) and Sun et al. (submitted for publication). Briefly, the procedure involves flame-sealing the standards with CuO in a vacuum line system and combustion to CO2 that was purified and transferred to glass ampoules in the next step on the same vacuum line system. The 14C of these standards was analyzed as gaseous samples using the miniaturized radiocarbon dating system (MICADAS) at the Laboratory of Ion Beam Physics, ETH Zürich (Ruff et al. Reference Ruff, Wacker, Gäggeler, Suter, Synal and Szidat2007).
Case Study I: n-Alkanoic Acid Samples—Methods and Results
To collect sufficient n-C16:0 and n-C26:0–28:0 alkanoic acid from standard material to permit isolation of multiple aliquots, about 2 g dried apple peel and about 10 g dried and homogenized Messel Shale were Soxhlet-extracted with dichloromethane (DCM): methanol (MeOH) 9:1 (v/v) at 60°C for 48 hr and further processed by the method described in Mollenhauer and Eglinton (Reference Mollenhauer and Eglinton2007). Additionally, asphaltene precipitation was performed with the total lipid extract of the Messel Shale according to the protocol described in Weiss et al. (Reference Weiss, Wilhelms, Mills, Scotchmer, Hall, Lind, Brekke and Hydro2000). The dried total lipid extracts were saponified with 0.1 N potassium hydroxide (KOH) in MeOH:H2O 9:1 (v/v) at 80°C for 2 hr. After the extraction of neutral compounds by n-hexane, the solution was acidified to pH = 1. The acid fraction was extracted by DCM. Approximately 2 mg of the commercial standard n-C30:0 alkanoic acid was processed following the same procedure as the extracted acid fraction from this step onwards. The acid fractions and n-C30:0 alkanoic acid were then methylated with MeOH of known F14C value (0.0008 ± 0.0001) to corresponding n-alkanoic acid methyl esters in 5% HCl under N2 atmosphere at 50°C overnight. The n-alkanoic acid methyl esters were extracted into n-hexane and further eluted with DCM:n-hexane 2:1 (v/v) through silica gel column chromatography. The targeted n-C16:0, n-C26:0, n-C28:0 and n-C30:0 alkanoic acid methyl esters were purified and collected by preparative capillary gas chromatography (PCGC) following the methods described by Eglinton et al. (Reference Eglinton, Aluwihare, Bauer, Druffel and McNichol1996) and Kusch et al. (Reference Kusch, Rethemeyer, Schefuß and Mollenhauer2010). The injection volume was 5 μl, and ∼25–120 repeated injections were conducted to collect sufficient mass of individual standard approximately ∼22–151 μgC. This covers a reasonable range of sample sizes, in which samples for CSRA may commonly occur (Table 1). The purity of these standards was checked by injecting a small aliquot of collected standards to a gas chromatograph coupled to a flame ionization detector (GC-FID). The purified n-alkanoic acid methyl esters were flame-sealed on a vacuum line system with CuO (pre-combusted) and were subsequently combusted at 850°C for 5 hr to oxidize the compounds to CO2. Afterwards, the CO2 samples were purified (dried), and transferred into small glass ampoules on the vacuum line in order to prepare the samples for F14C analysis on AMS. The gas volume analyzed was determined on the AMS.
Table 1 The measured m sample and F14Csample of standard compounds for the blank assessment for n-alkanoic acid methyl ester. F14C of unprocessed compounds are adopted from bulk organic carbon of Messel Shale and apple peel. Errors are given in 1σ.

n.a.: not available. The superscript W and S refer to the data adopted from Winterfeld et al. (Reference Winterfeld, Mollenhauer, Dummann, Köhler, Lembke-Jene, Meyer, Hefter, McIntyre, Wacker, Kokfelt and Tiedemann2018) and Sun et al. (submitted for publication). The superscript numbers represent the years when the standards were prepared and analyzed on AMS. * indicates the F14C of the alkanoic acid methyl ester calculated based on the F14C of corresponding unprocessed alkanoic acid and methanol (see Case Study I).
The measured m sample and F14Csample of the modern and fossil standards of this case study are listed in Table 1. For the blank assessment it is assumed that the true F14C-values of the unprocessed n-alkanoic acids are identical to the F14C values of bulk organic carbon of apple peel and Messel Shale, respectively. It has to be acknowledged that as described above, in the course of the isolation procedure in the laboratory, n-alkanoic acids were methylated to n-alkanoic methyl esters in order to facilitate gas chromatography (e.g. Wakeham et al. Reference Wakeham, McNichol, Kostka and Pease2006). Therefore, CSRA data of the processed standards are obtained from the methyl esters and not from the pure n-alkanoic acids. The methylation means that F14Csample is affected by the F14C of the added methyl-group (F14Cmethyl) next to the unknown blank. Hence, when determining the m blank and F14Cblank as discussed above and shown in Figure 1, the methyl group of the processed n-C16:0 and n-C26:0-30:0 methyl esters affects the slope of the regression lines. As a result, this would count towards the unknown blank. We corrected for this effect by combining the F14Cmethyl value, with the F14Ctrue of the modern and fossil standard (bulk values of apple peel and Messel Shale) by isotopic mass balance to obtain the F14Ctrue of the respective unprocessed methyl esters. The calculated value is set as the intercept for the regression lines as indicated in Equation (3).
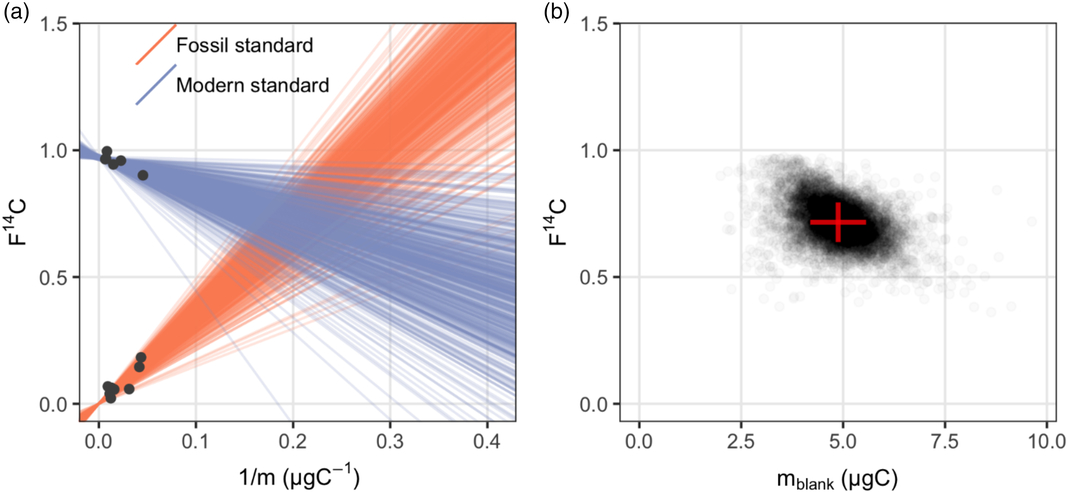
Figure 1 Procedural blank assessment for n-alkanoic acid methyl esters: (a) a sample of 500 regression lines from the posterior distribution give a visual check of the fitted Bayesian model; (b) the posterior distribution of masses and F14C values of the procedural blank.
It appears in Figure 1a that both standards display significant linear relationships between their measured F14Csample and 1/m sample as expected according to Equation (3). Although the fossil standards include saturated n-alkanoic acid methyl esters with different chain lengths (n-C26, n-C28 and n-C30), their F14Csample and 1/m sample relationships are consistent. It is also worth noting that these fossil standards were actually processed at different times between 2014 and 2017. However, this did not influence the consistency in the linear relationship, which suggests that the procedural blank is relatively invariant with time. A sample from the posterior distribution of regression lines fitted with the Bayesian model is plotted in Figure 1a. Figure 1b shows the posterior distribution of masses and F14C values of the procedural blank, which are obtained from the pairwise intersection points of the regression lines. Using our Bayesian model, the m blank and F14Cblank of the n-alkanoic acids and their uncertainties are estimated at m blank ± σ(m blank) 4.88 ± 0.69 μgC and F14Cblank ± σ(F14Cblank) 0.714 ± 0.077, respectively (Table 3).
Case Study II: Lignin Phenol Samples—Methods and Results
Vanillin from woodchips was extracted using the method of Goñi and Montgomery (Reference Goñi and Montgomery2000). Briefly, about 10 g of woodchip were oxidized with copper oxide (CuO) and ferrous ammonium sulfate in de-aerated 2 N sodium hydroxide (NaOH) at 150°C for 90 min under a nitrogen (N2) atmosphere in a CEM MARS5 microwave accelerated reaction system. After the oxidation, the supernatant was acidified to pH<1 and the reaction products were extracted into ethyl acetate. Approximately 3 mg of commercial standard ferulic acid were dissolved in ethyl acetate and processed as the extracted oxidation products according to the method of Feng et al. (Reference Feng, Benitez-Nelson, Montluçon, Prahl, McNichol, Xu, Repeta and Eglinton2013).
Briefly, the extracts and the ferulic acid were both pre-cleaned with Supelclean ENVI-18 solid phase extraction (SPE) cartridges and eluted with acetonitrile. Subsequently, the vanillin from the extracts and ferulic acid were further isolated by LC-NH2 SPE cartridges and were eluted into MeOH and MeOH:12 N HCl 95:5 (v:v), respectively. The vanillin and ferulic acid were extracted from their elution with ethyl acetate and re-dissolved in MeOH for purification on prep-HPLC. The vanillin was then purified with a Phenomenex Synergi Polar-RP column followed by a ZORBAX Eclipse XDB-C18 column. The ferulic acid was purified with the same columns but in reverse order. The specific elution conditions on the prep-HPLC system can be found in Feng et al. (Reference Feng, Benitez-Nelson, Montluçon, Prahl, McNichol, Xu, Repeta and Eglinton2013). ∼ 20 repeated injections were conducted to collect sufficient mass of individual standard, which was divided into a range of sample sizes (Table 1). The purity of the collected standards was checked by injecting a small aliquot of the standard to GC-FID. All purified lignin phenolic compounds were flame-sealed with CuO on a vacuum line and were combusted to form CO2, which was subsequently purified and transferred to smaller glass ampules on the vacuum line system.
As is the case of blank assessment for n-alkanoic acid methyl esters, the measured m blank and F14Cblank of a range of different sized modern and fossil lignin phenolic standards are listed in Table 2. The F14C value of pure ferulic acid was measured as graphite target and assumed to be the F14Ctrue, which is set as the intercept for the regression line of the fossil standard. Note that the exact F14C value of wood chips from which the vanillin was extracted is not available, therefore the intercept of the regression line of modern standard (F14Ctrue) cannot be defined. Similar to the lipid standards, the measured F14Csample of both vanillin and ferulic acid are linearly related to the corresponding 1/m sample (Figure 2a). This suggest that the assumption of a constant procedural blank is also valid for the purification of lignin phenolic compounds. The posterior distribution of the masses and F14C values of the procedural blank from the Bayesian model is shown in Figure 2b. The m blank and F14Cblank value of the procedural blank during CSRA of lignin phenolic compounds are estimated at m blank ± σ(m blank) 0.90 ± 0.23 μgC and F14Cblank ± σ(F14Cblank) 0.813 ± 0.155, respectively (Table 3).
Table 2 Measured m sample and F14Csample of standard compounds for the blank assessment of lignin phenols (Sun et al., submitted for publication).
n.a.: not available.
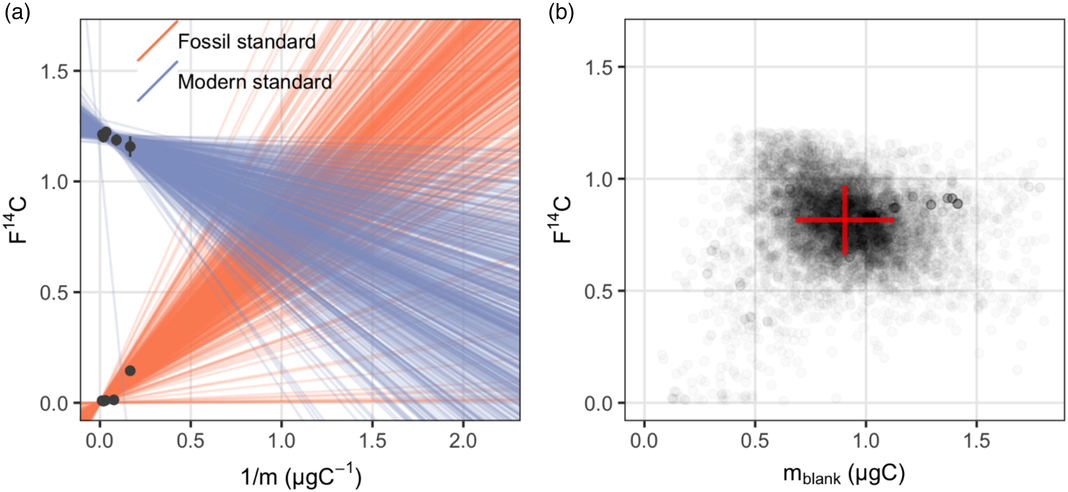
Figure 2 Procedural blank assessment for lignin phenols: (a) a sample of 500 regression lines from the posterior distribution give a visual check of the fitted Bayesian model; (b) the posterior distribution of masses and F14C values of the procedural blank.
Table 3 Estimated values of m blank and F14Cblank.
CASE STUDIES—DISCUSSION
For our two case studies, we are able to obtain statistically robust estimates of the mass and F14C value of the procedural blank (i.e. small uncertainties in both variables), despite requiring a long extrapolation of the regression lines to the intersection point. This also suggests that much smaller uncertainties can be obtained if small sized samples with masses close to the intersection point (mass of the blank) are available for the assessment of blanks because this will shorten the extrapolation distance. Therefore, the smallest sample sizes of the set of standards should be as small as possible to achieve a relatively short extrapolation distance, which will produce better estimates of m blank and F14Cblank.
Our results of the mass and F14C values of procedural blanks for lignin phenolic compounds by the Bayesian model agree well with the one obtained by least-square model (0.90 ± 0.18 μgC with F14C of 0.814 ± 0.407, Haghipour et al. Reference Haghipour, Ausin, Usman, Ishikawa, Welte, Wacker and Eglinton2018). The mass and F14C values of procedural blanks for n-alkanoic acid methyl esters and lignin phenolic compounds can be further applied to correct for the F14C values of the real samples. The F14C of the procedural blank (0.714 ± 0.077 or Δ14C = –292 ± 71‰) for n-alkanoic acid methyl esters is similar to the procedural blank determined in the study of Tao et al. (Reference Tao, Eglinton, Montluçon, McIntyre and Zhao2015) (Δ14C = –325 ± 129‰), in which a similar sample preparation protocol was used. In Tao et al. (Reference Tao, Eglinton, Montluçon, McIntyre and Zhao2015), the mass of the combined procedural blank was determined to be 1.3 ± 0.2 μgC per 30 PCGC injections, which means that these authors assumed the procedural blank varies with the sample size rather than a constant procedural blank.
The larger procedural blank for n-alkanoic acid methyl esters (4.88 ± 0.69 μgC) means that for this case, the results of small size samples (e.g. <15 μgC) are meaningless due to a high proportion of contaminant carbon (∼30%). Compared to the preparation process of n-alkanoic acid methyl esters, our preparation of CSRA for lignin phenols introduced a lower amount of procedural blank (0.90 ± 0.23 μgC). Although the masses of procedural blank in preparation of lignin phenols and n-alkanoic acid methyl esters are different, their F14C values are identical within errors. This implies that the blank introduced by the two different protocols has the same composition and source but varies in size. The general difference in the preparation for these two types of compounds lies in almost every step, i.e., chemical extraction, cleaning, isolation methods. For example, it includes Soxhlet extraction, purification with PCGC, flame-sealing on the vacuum line and combustion for n-alkanoic acid methyl esters and alkaline CuO oxide digestion combined with solvent extraction followed by isolation with prep-HPLC and all the vacuum line handling and combustion for lignin phenols. As such, it is reasonable to assume that the different masses of the blank are associated with the different preparation procedures.
According to the results of these two case studies, our approach of blank assessment is successfully applied for n-alkanoic acid methyl esters and lignin phenols that require different isolation methods. It demonstrates that this blank assessment method can further be applicable for other compounds and various preparation protocols. Unlike the methods considering modern or fossil procedural blank separately and assessing contamination introduced from different preparation steps, our method is not difficult to achieve and reduces the complexity in the calculation of uncertainty. Therefore, this method has the potential to serve as a simple and widely applied approach for blank assessment. We propose to routinely conduct blank assessment for different batches of samples and different compounds-classes to ensure the accuracy and precision of F14C values of real samples of purified organic compounds, especially of small sizes (<100 μgC).
CONCLUSION
Based on our methods of blank assessment, we observe that our preparation protocol of radiocarbon analysis of n-alkanoic acid and lignin phenols will produce 4.88 ± 0.69 μg of extraneous carbon with F14C of 0.714 ± 0.077 and 0.90 ± 0.23 μg of extraneous carbon with F14C of 0.813 ± 0.155, respectively. The F14C of the procedural blanks for both biomarkers are similar, but the mass of the procedural blank of n-alkanoic acid is five times larger than that for lignin. This discrepancy is probably due to different chemical cleaning, isolation methods and preparation on the vacuum line system thereby highlighting the necessity to conduct blank assessment for different compound classes and preparation procedures. The method proposed in this study is neither time consuming nor labor intensive; it is worth extending to other biomarkers and may also serve as a standardized method for blank assessment.
ACKNOWLEDGMENTS
We thank Thorsten Riedel, Meng Yu and Thomas Blattmann for laboratory assistance. Sonja Wedmann (Senckenberg) is thanked for providing material of the Messel Oil Shale. Shuwen Sun thanks the China Scholarship Council (CSC) and GLOMAR-Bremen International Graduate School for Marine Sciences for additional support. Andrew Dolman was supported by the German Federal Ministry of Education and Research (BMBF) as a Research for Sustainability initiative (FONA) through the PalMod project (FKZ: 01LP1509C). The R and Stan codes for the Bayesian model are available at the database Pangaea: https://doi.pangaea.de/10.1594/PANGAEA.892180
SUPPLEMENTARY MATERIAL
To view supplementary material for this article, please visit https://doi.org/10.1017/RDC.2019.108


 Open access