1. Introduction
A high and variable fractional optical linear polarisation ( $p_{opt}$
) is a well-known characteristic of blazars (e.g., Strittmatter et al. Reference Strittmatter, Serkowski, Carswell, Stein, Merrill and Burbidge1972), which is a subset of flat-spectrum radio quasars (FSRQs) whose flux density at not only centimetric but also at optical and possibly at even shorter wavelengths is dominated by a synchrotron jet relativistically beamed in our direction (e.g., Blandford & Rees Reference Blandford, Rees and Wolfe1978; Begelman, Blandford, & Rees Reference Begelman, Blandford and Rees1984; Antonucci Reference Antonucci1993; Urry & Padovani Reference Urry and Padovani1995). Guided by the limiting polarisation of up to
$p_{opt}$
) is a well-known characteristic of blazars (e.g., Strittmatter et al. Reference Strittmatter, Serkowski, Carswell, Stein, Merrill and Burbidge1972), which is a subset of flat-spectrum radio quasars (FSRQs) whose flux density at not only centimetric but also at optical and possibly at even shorter wavelengths is dominated by a synchrotron jet relativistically beamed in our direction (e.g., Blandford & Rees Reference Blandford, Rees and Wolfe1978; Begelman, Blandford, & Rees Reference Begelman, Blandford and Rees1984; Antonucci Reference Antonucci1993; Urry & Padovani Reference Urry and Padovani1995). Guided by the limiting polarisation of up to $\sim$
2% that can arise from scattering (with extremely few outlier QSOs), two polarisation classes have been defined for quasars, separated at
$\sim$
2% that can arise from scattering (with extremely few outlier QSOs), two polarisation classes have been defined for quasars, separated at $p_{opt}$
= 3% (e.g., Stockman, Moore, & Angel Reference Stockman, Moore and Angel1984). These are: (i) high-polarisation quasars (HPQ,
$p_{opt}$
= 3% (e.g., Stockman, Moore, & Angel Reference Stockman, Moore and Angel1984). These are: (i) high-polarisation quasars (HPQ, $p_{opt}$ $\gt$
3%) which are nearly always radio-loud and are referred to here as blazars, dominated by relativistically beamed radio-optical synchrotron radiation (e.g., Wills et al. Reference Wills, Wills, Breger, Antonucci and Barvainis1992), and (ii) low-polarisation radio quasars (LPRQ).
$\gt$
3%) which are nearly always radio-loud and are referred to here as blazars, dominated by relativistically beamed radio-optical synchrotron radiation (e.g., Wills et al. Reference Wills, Wills, Breger, Antonucci and Barvainis1992), and (ii) low-polarisation radio quasars (LPRQ).
The opto-polarimetric division begs the question about trans-migration of individual FSRQs between the two polarisation classes. Early attempts to examine this were reported by Fugmann (Reference Fugmann1988), Kühr & Schmidt (Reference Kühr and Schmidt1990) and Impey & Tapia (Reference Impey and Tapia1990), hereafter, IT90. Using optical polarimetric observations separated by month-like timescales, Fugmann (Reference Fugmann1988) inferred that, statistically, a FSRQ exists in a blazar state with a duty cycle of $\sim$
2/3, so that at any time, nearly two-thirds of a sample of FSRQs exhibits blazar characteristics (HP), as also found by IT90. This poses the next question which is about the typical timescale on which the above duty cycle operates. An early quantitative check was reported in IT90, based on an assortment of multi-epoch (mostly two-epoch) optical polarimetry of 41 FSRQs. It showed that nearly a quarter of the FSRQs jumped the
$\sim$
2/3, so that at any time, nearly two-thirds of a sample of FSRQs exhibits blazar characteristics (HP), as also found by IT90. This poses the next question which is about the typical timescale on which the above duty cycle operates. An early quantitative check was reported in IT90, based on an assortment of multi-epoch (mostly two-epoch) optical polarimetry of 41 FSRQs. It showed that nearly a quarter of the FSRQs jumped the $p_{opt}$
= 3% threshold (in either direction), on year-like timescales. This would indicate that over a much longer, say decade-like, time interval the memberships of the HPQ and LPRQ subsets in a sample of FSRQs would undergo a drastic churn, even though their relative numerical strengths remain unchanged. One study bearing on this question employed strong intranight optical variability (INOV), a well-established signature of blazar activity (Goyal et al. Reference Goyal, Gopal-Krishna, Wiita, Anupama, Sahu, Sagar and Joshi2012, Reference Goyal, Gopal-Krishna, Paul, Stalin and Sagar2013; also, Gopal-Krishna & Wiita Reference Gopal-Krishna and Wiita2018). Goyal et al. (Reference Goyal, Gopal-Krishna, Wiita, Anupama, Sahu, Sagar and Joshi2012) specifically investigated the dependence of INOV of FSRQs on optical polarisation, by carrying out sensitive and densely sampled intranight optical monitoring of nine HPQs and 12 LPRQs. Remarkably, the HPQ subset showed strong INOV (i.e., amplitude
$p_{opt}$
= 3% threshold (in either direction), on year-like timescales. This would indicate that over a much longer, say decade-like, time interval the memberships of the HPQ and LPRQ subsets in a sample of FSRQs would undergo a drastic churn, even though their relative numerical strengths remain unchanged. One study bearing on this question employed strong intranight optical variability (INOV), a well-established signature of blazar activity (Goyal et al. Reference Goyal, Gopal-Krishna, Wiita, Anupama, Sahu, Sagar and Joshi2012, Reference Goyal, Gopal-Krishna, Paul, Stalin and Sagar2013; also, Gopal-Krishna & Wiita Reference Gopal-Krishna and Wiita2018). Goyal et al. (Reference Goyal, Gopal-Krishna, Wiita, Anupama, Sahu, Sagar and Joshi2012) specifically investigated the dependence of INOV of FSRQs on optical polarisation, by carrying out sensitive and densely sampled intranight optical monitoring of nine HPQs and 12 LPRQs. Remarkably, the HPQ subset showed strong INOV (i.e., amplitude $\psi$ $\gt$
4%) on 11 out of 29 nights, in stark contrast to the LPRQs for which strong INOV was observed on just one out of 44 nights. This demonstrates that the key blazar characteristic of rapid optical variability is primarily a property of HPQs. This is also consistent with the recent study of eight FSRQs, based on a 10-yr long monitoring at Steward observatory of their optical flux and polarisation (Pandey et al. Reference Pandey, Rajput and Stalin2022). This study revealed that in an overwhelming majority of cases (
$\gt$
4%) on 11 out of 29 nights, in stark contrast to the LPRQs for which strong INOV was observed on just one out of 44 nights. This demonstrates that the key blazar characteristic of rapid optical variability is primarily a property of HPQs. This is also consistent with the recent study of eight FSRQs, based on a 10-yr long monitoring at Steward observatory of their optical flux and polarisation (Pandey et al. Reference Pandey, Rajput and Stalin2022). This study revealed that in an overwhelming majority of cases ( $\sim$
90%), changes in optical flux on day-to-month-like timescales are positively correlated with the degree of optical polarisation, again in accord with the notion that a high optical polarisation is associated with relativistically beamed synchrotron component, a key marker of blazar activity (e.g., Wills et al. Reference Wills, Wills, Breger, Antonucci and Barvainis1992; Marscher Reference Marscher2016). This correlation is widely understood in terms of the, so called, ‘shock-in-jet’ model of relativistic blazar jets, wherein both particle acceleration and magnetic field alignment take place at shocks within the jet flow (Blandford & Königl Reference Blandford and Königl1979; Hughes, Aller, & Aller Reference Hughes, Aller and Aller1985; Marscher & Gear Reference Marscher and Gear1985).
$\sim$
90%), changes in optical flux on day-to-month-like timescales are positively correlated with the degree of optical polarisation, again in accord with the notion that a high optical polarisation is associated with relativistically beamed synchrotron component, a key marker of blazar activity (e.g., Wills et al. Reference Wills, Wills, Breger, Antonucci and Barvainis1992; Marscher Reference Marscher2016). This correlation is widely understood in terms of the, so called, ‘shock-in-jet’ model of relativistic blazar jets, wherein both particle acceleration and magnetic field alignment take place at shocks within the jet flow (Blandford & Königl Reference Blandford and Königl1979; Hughes, Aller, & Aller Reference Hughes, Aller and Aller1985; Marscher & Gear Reference Marscher and Gear1985).
Another striking aspect highlighted in the afore-mentioned study by Goyal et al. (Reference Goyal, Gopal-Krishna, Wiita, Anupama, Sahu, Sagar and Joshi2012) is that the grossly divergent INOV behaviour of the two FSRQ subsets was observed even though their HPQ/LPRQ classification had been made more than two decades prior to the INOV campaign, indicating a long-term memory of the polarisation class. Recently, we revisited this curious finding about the timescale over which the HPQ (i.e., blazar) state of a FSRQ persists (Chand & Gopal-Krishna Reference Chand and Gopal-Krishna2022, Paper I), by checking for the HP state among individual members of a well-defined sample of 80 FSRQs, selected from IT90, out of which 49 had been confirmed to be in HP (blazar) state during 1970–1980s, through opto-polarimetry. For each FSRQ, we then checked for blazar state around 2020, based on flux variability in its high-quality optical light-curves obtained under the ongoing Zwicky Transient Facility (ZTF)Footnote a project which was launched in 2018 and presents an unprecedented combination of sensitivity and cadence (Bellm et al. Reference Bellm2019). It was thus found in Paper I that over the time baseline of $\sim$
4 decades, not more than
$\sim$
4 decades, not more than $\sim$
10% of the FSRQs showed a clear sign of transition to (or from) blazar state. Paper I also reported supporting evidence for this rather unexpected result, utilising the ‘recent’ polarisation state classification based on the opto-polarimetric measurements (instead of optical flux variability) that are available for 32 out of the total sample of 80 FSRQs, in the archives of the RoboPol survey conducted during 2013–2017 (Blinov et al. Reference Blinov2021, hereafter, B21). In this paper we employ a 2.6 times larger quasar sample which has enabled a statistically much more robust test of the persistence of blazar/HP state among quasars, while ensuring that the blazar state at both ends of the time baseline is assigned in terms of opto-polarimetric data alone.
$\sim$
10% of the FSRQs showed a clear sign of transition to (or from) blazar state. Paper I also reported supporting evidence for this rather unexpected result, utilising the ‘recent’ polarisation state classification based on the opto-polarimetric measurements (instead of optical flux variability) that are available for 32 out of the total sample of 80 FSRQs, in the archives of the RoboPol survey conducted during 2013–2017 (Blinov et al. Reference Blinov2021, hereafter, B21). In this paper we employ a 2.6 times larger quasar sample which has enabled a statistically much more robust test of the persistence of blazar/HP state among quasars, while ensuring that the blazar state at both ends of the time baseline is assigned in terms of opto-polarimetric data alone.
2. The opto-polarimetric sample of quasars
Out of the total 222 radio quasars in the RoboPol survey (B21), 210 have been marked as blazar/FSRQ in the ROMA-BZCAT catalogue (Massaro et al. Reference Massaro, Maselli, Leto, Marchegiani, Perri, Giommi and Piranomonte2015). We were able to assign to 83 of them ‘old’ opto-polarimetric class through an extensive (though not complete) search of the literature published before 1995 (data acquired no later than 1990), albeit from sensitivity considerations data taken before 1968 were not considered (see IT90). These 83 quasars constitute our RoboPol sample (Table 1). The AGN classes mentioned in col. 2, taken from the ROMA-BZCAT catalogue are based on multiple criteria, namely: (i) radio detection and radio core-dominance/spectral-index, (ii) optical spectrum, and (iii) X-ray luminosity. For these reasons, this classification does not bear a one-to-one correspondence with the blazar classification scheme adopted in the present work, which is based solely on the afore-mentioned $p_{opt} \gt 3\%$
criterion.
$p_{opt} \gt 3\%$
criterion.
Table 1. The basic optical data and the polarisation classifications for the present sample of 83 radio quasars (Section 2). Only the first two sources are shown here, the full table is available in the on-line material.
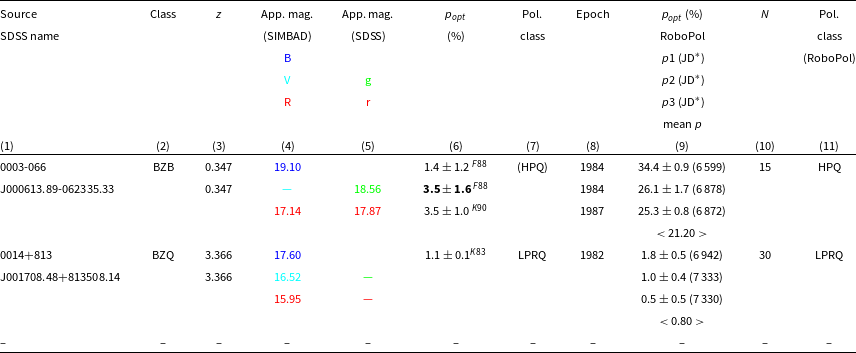
Col. (2): The source class is taken from the fifth edition of ROMA-BZCAT (Massaro et al. Reference Massaro, Maselli, Leto, Marchegiani, Perri, Giommi and Piranomonte2015) where the BZB stands for BL Lac type of blazar, BZQ stands for FSRQ type blazar, BZG: BL Lac-galaxy dominated and BZU: blazars of Uncertain type; Col. (3): Redshift, the upper value is from NED and the lower value is from Blinov et al. (Reference Blinov2021). The redshift marked with ‘a’ and ‘b’ is taken from Tarnopolski et al. (Reference Tarnopolski, Zywucka, Marchenko and Pascual-Granado2020) and Landoni et al. (Reference Landoni, Falomo, Paiano and Treves2020) respectively; Col. (6): The reference codes for polarisation are shown as the superscripts, where A80 stands for Angel & Stockman (Reference Angel and Stockman1980), A84: Antonucci (Reference Antonucci1984), B90: Ballard et al. (Reference Ballard, Mead, Brand and Hough1990), Bi81: Biermann et al. (Reference Biermann1981), B86: Brindle et al. (Reference Brindle, Hough, Bailey, Axon and Hyland1986), C88: Courvoisier et al. (Reference Courvoisier, Robson, Blecha, Bouchet, Hughes, Krisciunas and Schwarz1988), F88: Fugmann & Meisenheimer (Reference Fugmann and Meisenheimer1988), I82: Impey, Brand, & Tapia (Reference Impey, Brand and Tapia1982), I88: Impey & Tapia (Reference Impey and Tapia1988), I90: Impey & Tapia (Reference Impey and Tapia1990), I91: Impey, Lawrence, & Tapia (Reference Impey, Lawrence and Tapia1991), J93: Jannuzi, Smith, & Elston (Reference Jannuzi, Smith and Elston1993), K76: Kinman (Reference Kinman1976), K83: Kuhr et al. (Reference Kuhr, Liebert, Strittmatter, Schmidt and Mackay1983), K90: Kühr & Schmidt (Reference Kühr and Schmidt1990), M83: Martin et al. (Reference Martin, Thompson, Maza and Angel1983), M90: Mead et al. (Reference Mead, Ballard, Brand, Hough, Brindle and Bailey1990), M75: Miller (Reference Miller1975), M81: Moore & Stockman (Reference Moore and Stockman1981), M84: Moore & Stockman (Reference Moore and Stockman1984), P83: Puschell et al. (Reference Puschell, Jones, Phillips, Rudnick, Simpson, Sitko, Stein and Moneti1983), Si85: Sitko et al. (Reference Sitko, Schmidt and Stein1985), S86: Smith et al. (Reference Smith, Balonek, Heckert and Elston1986), S87: Smith et al. (Reference Smith, Balonek, Elston and Heckert1987), S88: Smith et al. (Reference Smith, Elston, Berriman, Allen and Balonek1988), S78: Stockman & Angel (Reference Stockman and Angel1978), S84: Stockman et al. (Reference Stockman, Moore and Angel1984), W80: Wills et al. (Reference Wills, Wills, Breger and Hsu1980) and W92: Wills et al. (Reference Wills, Wills, Breger, Antonucci and Barvainis1992); Col. (7): polarisation class of the source ( $p_{opt}({\max}) \leq$
3% for LPRQs and
$p_{opt}({\max}) \leq$
3% for LPRQs and $\gt$
3% for HPQs). The polarisation class in parentheses is for border-line cases for which the quoted one-
$\gt$
3% for HPQs). The polarisation class in parentheses is for border-line cases for which the quoted one- $\sigma$
error on
$\sigma$
error on $p_{\max}$
would push the source to the other polarisation class; Col. (8): Epoch of the
$p_{\max}$
would push the source to the other polarisation class; Col. (8): Epoch of the $p_{opt}$
measurement; Col. (9): RoboPol measured
$p_{opt}$
measurement; Col. (9): RoboPol measured $p_{opt}$
, taken from Blinov et al. (Reference Blinov2021). The JD in parentheses marked with ‘*’ corresponds to Julian date minus 2,450,000. The parameters p1, p2, and p3 are explained in section 2; Col. (10): Number of RoboPol polarisation measurements; Col. (11): polarisation class of the source (
$p_{opt}$
, taken from Blinov et al. (Reference Blinov2021). The JD in parentheses marked with ‘*’ corresponds to Julian date minus 2,450,000. The parameters p1, p2, and p3 are explained in section 2; Col. (10): Number of RoboPol polarisation measurements; Col. (11): polarisation class of the source ( $p_{opt}({\max}) \leq$
3% for LPRQs and
$p_{opt}({\max}) \leq$
3% for LPRQs and $\gt$
3% for HPQs). The polarisation class in parentheses is for those six sources for which the quoted one-
$\gt$
3% for HPQs). The polarisation class in parentheses is for those six sources for which the quoted one- $\sigma$
error on
$\sigma$
error on $p_{max}$
would push the source to the other polarisation class. Note that all these six sources have the number of RoboPol measurements
$p_{max}$
would push the source to the other polarisation class. Note that all these six sources have the number of RoboPol measurements $N\lt 5$
.
$N\lt 5$
.
Using the published opto-polarimetric measurements made a few decades ago (Table 1, col. 6), and then again in recent years (2013–2017, RoboPol) (see, Table 1, col. 9), we have assigned to each quasar polarisation categories ‘old’ and ‘new’, each based on the maximum observed polarisation, $p_{opt}({\max})$
. The maximum value of
$p_{opt}({\max})$
. The maximum value of $p_{opt}$
is preferred over averaged value, as this reduces the chance of missing out genuine blazars/HPQs since their polarisation is known to vary and hence may sometimes dip below the defining threshold of 3% (Section 1), particularly because for a majority of the quasars, at most a couple of polarisation measurements are available in the old literature. In relatively rare cases where the old literature lists multiple values of
$p_{opt}$
is preferred over averaged value, as this reduces the chance of missing out genuine blazars/HPQs since their polarisation is known to vary and hence may sometimes dip below the defining threshold of 3% (Section 1), particularly because for a majority of the quasars, at most a couple of polarisation measurements are available in the old literature. In relatively rare cases where the old literature lists multiple values of $p_{opt}$
for a quasar, all consistent with the same classification (HPQ, or LPRQ), we have selected one representative value of
$p_{opt}$
for a quasar, all consistent with the same classification (HPQ, or LPRQ), we have selected one representative value of $p_{opt}$
out of them, by applying a judicious mix of criteria. These criteria are: the availability (and smallness) of the rms error and of the epoch of the measurement, giving a higher weightage to older measurements with a view to extend the time baseline (see the entries in bold-face, in col. 6 in Table 1). It may be noted that for making a proper comparison of the RoboPol measurements with those found in the old literature where the available number of polarisation measurements per quasar seldom exceeds two, we have also limited the number of RoboPol measurements accordingly. Thus, for each of the 58 of our 83 quasars, for which more than three RoboPol measurements are available
$p_{opt}$
out of them, by applying a judicious mix of criteria. These criteria are: the availability (and smallness) of the rms error and of the epoch of the measurement, giving a higher weightage to older measurements with a view to extend the time baseline (see the entries in bold-face, in col. 6 in Table 1). It may be noted that for making a proper comparison of the RoboPol measurements with those found in the old literature where the available number of polarisation measurements per quasar seldom exceeds two, we have also limited the number of RoboPol measurements accordingly. Thus, for each of the 58 of our 83 quasars, for which more than three RoboPol measurements are available $(N>3)$
, we have selected three out of the available measurements in an unbiased manner, using a random-number generator (col. 9 in Table 1). As for the old data, the RoboPol-based polarimetric classification of each quasar in our sample was then carried out based on the highest
$(N>3)$
, we have selected three out of the available measurements in an unbiased manner, using a random-number generator (col. 9 in Table 1). As for the old data, the RoboPol-based polarimetric classification of each quasar in our sample was then carried out based on the highest $p_{opt}$
(
$p_{opt}$
( $p_{new}({\max})$
listed in Table 1), yielding 59 HPQs, 18 LPRQs and six border-line cases (four probable HPQs and two probable LPRQs) for which
$p_{new}({\max})$
listed in Table 1), yielding 59 HPQs, 18 LPRQs and six border-line cases (four probable HPQs and two probable LPRQs) for which $p_{new} ({\max})$
is consistent with either classification within the quoted rms error (Table 1). Note that for eight of the LPRQs, the classification is based on a single available measurement of
$p_{new} ({\max})$
is consistent with either classification within the quoted rms error (Table 1). Note that for eight of the LPRQs, the classification is based on a single available measurement of $p_{new}$
. Thus, for several of these (6 + 8 =) 14 quasars, the ‘new’ classification may actually fall under the HPQ category.
$p_{new}$
. Thus, for several of these (6 + 8 =) 14 quasars, the ‘new’ classification may actually fall under the HPQ category.
3. Discussion
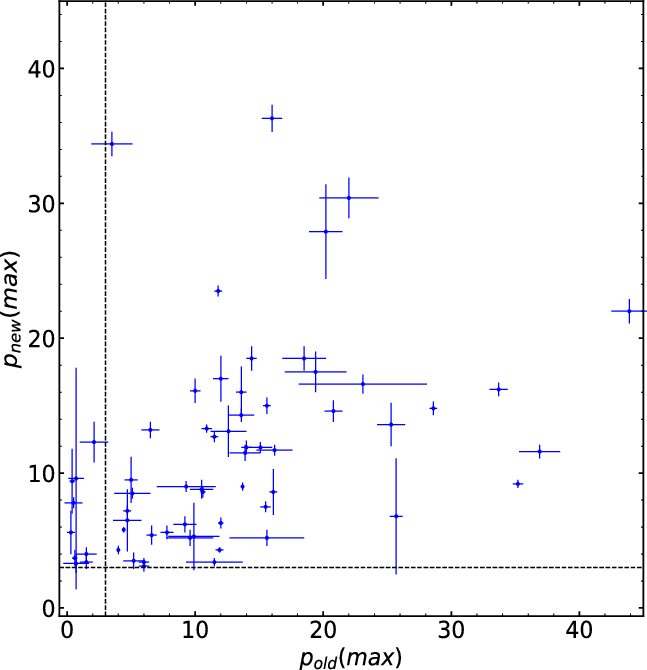
Figure 1 shows a plot of $p_{opt}({\max})$
at the two ends of the time baseline, for the 63 HPQs in our RoboPol sample, including the four border-line HPQs (1012+232, 1514-241, 1638+398 and 2150+173) (see Section 2, also Table 1). Thus, we plot
$p_{opt}({\max})$
at the two ends of the time baseline, for the 63 HPQs in our RoboPol sample, including the four border-line HPQs (1012+232, 1514-241, 1638+398 and 2150+173) (see Section 2, also Table 1). Thus, we plot $p_{old}({\max})$
(from the 1973–1989 literature, shown in bold-face in col. 6 of Table 1) against
$p_{old}({\max})$
(from the 1973–1989 literature, shown in bold-face in col. 6 of Table 1) against $p_{new}({\max})$
(from RoboPol survey 2013–2017, col. 9). Based on this diagram, we discuss below individually the candidates for polarisation state transition over this time interval of
$p_{new}({\max})$
(from RoboPol survey 2013–2017, col. 9). Based on this diagram, we discuss below individually the candidates for polarisation state transition over this time interval of $\sim$ $3.5$
decades. In tandem, we shall also examine the role of the thermal UV emission arising from the accretion disk, which would increasingly contribute to the observed optical flux of high-z quasars (see, e.g., Wills et al. Reference Wills, Wills, Breger, Antonucci and Barvainis1992), expectedly moderating their observed optical flux variability as well as fractional polarisation. For the purpose of this check, we shall thus limit our analysis to the
$3.5$
decades. In tandem, we shall also examine the role of the thermal UV emission arising from the accretion disk, which would increasingly contribute to the observed optical flux of high-z quasars (see, e.g., Wills et al. Reference Wills, Wills, Breger, Antonucci and Barvainis1992), expectedly moderating their observed optical flux variability as well as fractional polarisation. For the purpose of this check, we shall thus limit our analysis to the $z \lt 1$
members of our HPQ sample, numbering 54 including the three border-line HPQs (for identifying
$z \lt 1$
members of our HPQ sample, numbering 54 including the three border-line HPQs (for identifying $z \gt 1$
HPQs, their names appear underlined in this section).
$z \gt 1$
HPQs, their names appear underlined in this section).


3.1. Cases of long-term change in the polarisation state
3.1.1. The RoboPol HPQs, that is, blazars
From the $p_{old}({\max})$
vs
$p_{old}({\max})$
vs $p_{new}({\max})$
plot for the 63 HPQs in our RoboPol sample (Figure 1; Table 1), including the four border-line cases mentioned above, and using the information provided in Table 1, we have shortlisted the following nine HPQs as candidates for polarisation state transition.
$p_{new}({\max})$
plot for the 63 HPQs in our RoboPol sample (Figure 1; Table 1), including the four border-line cases mentioned above, and using the information provided in Table 1, we have shortlisted the following nine HPQs as candidates for polarisation state transition.
0748+126: This HPQ with two measurements of $p_{new}$
(=
$p_{new}$
(= ${12.3\pm1.5\%}$
and
${12.3\pm1.5\%}$
and ${4.2\pm1.1\%}$
) had been found to be a confirmed LPRQ, based on all three available measurements during 1984–1986 (Table 1). Hence, it is a clear case of polarisation state transition.
${4.2\pm1.1\%}$
) had been found to be a confirmed LPRQ, based on all three available measurements during 1984–1986 (Table 1). Hence, it is a clear case of polarisation state transition.
0827+243: With $p_{new}({\max})$
=
$p_{new}({\max})$
= $4.0\pm0.5\%$
, this source qualifies as an HPQ, and also as a case for polarisation state transition, having been earlier recorded as an LPRQ on the basis of two available measurements during 1979–1980. Note, however, that this quasar is only a ‘probable’ case of polarisation state transition since its average
$4.0\pm0.5\%$
, this source qualifies as an HPQ, and also as a case for polarisation state transition, having been earlier recorded as an LPRQ on the basis of two available measurements during 1979–1980. Note, however, that this quasar is only a ‘probable’ case of polarisation state transition since its average $p_{new}$
, based on 13 RoboPol measurements is clearly below 3%.
$p_{new}$
, based on 13 RoboPol measurements is clearly below 3%.
0850+581: With $p_{new}({\max})$
=
$p_{new}({\max})$
= $9.4\pm2.4\%$
, this is a confirmed RoboPol HPQ. However, it is only a ‘probable’ case of polarisation state transition, since its LPRQ classification in the old literature is based on a single measurement, due to which the possibility of its then being an HPQ cannot be ignored.
$9.4\pm2.4\%$
, this is a confirmed RoboPol HPQ. However, it is only a ‘probable’ case of polarisation state transition, since its LPRQ classification in the old literature is based on a single measurement, due to which the possibility of its then being an HPQ cannot be ignored.
1012+232: With $p_{new}({\max})$
=
$p_{new}({\max})$
= $9.6\pm8.2\%$
, its HPQ classification is highly uncertain and even its LPRQ classification in the old literature (1985) is based on a single measurement,
$9.6\pm8.2\%$
, its HPQ classification is highly uncertain and even its LPRQ classification in the old literature (1985) is based on a single measurement, $p_{old}$
=
$p_{old}$
= $0.7\pm0.6\%$
(Table 1). Therefore, it is at most a ‘probable’ case of state transition.
$0.7\pm0.6\%$
(Table 1). Therefore, it is at most a ‘probable’ case of state transition.
1551+130: With $p_{new}({\max})$
=
$p_{new}({\max})$
= $3.3\pm0.7\%$
, this border-line HPQ, is likely to be actually an LPRQ, given its average
$3.3\pm0.7\%$
, this border-line HPQ, is likely to be actually an LPRQ, given its average $p_{opt}$
of 1.83%, based on 47 RoboPol measurements. In the old literature (1992), this quasar is classified as an LPRQ (
$p_{opt}$
of 1.83%, based on 47 RoboPol measurements. In the old literature (1992), this quasar is classified as an LPRQ ( $p_{old}$
=
$p_{old}$
= $0.7\pm1.0\%$
), making it an unlikely case of polarisation state transition.
$0.7\pm1.0\%$
), making it an unlikely case of polarisation state transition.
1633+382: The polarimetric state transition of this HPQ with $p_{new}$
consistently remaining above 3%, is confirmed, since all five measurements available in the old literature gave
$p_{new}$
consistently remaining above 3%, is confirmed, since all five measurements available in the old literature gave $p_{old}$ $\lt 3\%$
(i.e., LPRQ, see Table 1). Its transition has also been highlighted in Lister & Smith (Reference Lister and Smith2000).
$\lt 3\%$
(i.e., LPRQ, see Table 1). Its transition has also been highlighted in Lister & Smith (Reference Lister and Smith2000).
1954+513: With $p_{new}({\max})$
=
$p_{new}({\max})$
= $3.4\pm0.5\%$
, this HPQ, is likely to be actually an LPRQ, given its average
$3.4\pm0.5\%$
, this HPQ, is likely to be actually an LPRQ, given its average $p_{opt}$
of 2.78%, based on 17 RoboPol measurements. Also, its LPRQ classification in the old literature (1980) is based on a single measurement (
$p_{opt}$
of 2.78%, based on 17 RoboPol measurements. Also, its LPRQ classification in the old literature (1980) is based on a single measurement ( $p_{old}$
=
$p_{old}$
= $1.5\pm0.5\%$
). Hence, an unlikely case of polarisation state transition.
$1.5\pm0.5\%$
). Hence, an unlikely case of polarisation state transition.
2021+614: With two measurements of $p_{new}$
(=
$p_{new}$
(= $5.6\pm1.6\%$
and
$5.6\pm1.6\%$
and $4.7\pm1.3\%$
), the source is a confirmed RoboPol HPQ. However, its LPRQ classification in the old literature (1986) is based on a single measurement (
$4.7\pm1.3\%$
), the source is a confirmed RoboPol HPQ. However, its LPRQ classification in the old literature (1986) is based on a single measurement ( $p_{old}$
=
$p_{old}$
= $0.3\pm0.3\%$
). Hence, it can only be termed as a ‘probable’ case of polarisation state transition.
$0.3\pm0.3\%$
). Hence, it can only be termed as a ‘probable’ case of polarisation state transition.
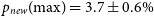
2145+067: This quasar, with $p_{new} ({\max}) = 3.7\pm0.6\%$
is a border-line HPQ, particularly since its available 70 RoboPol measurements give an average
$p_{new} ({\max}) = 3.7\pm0.6\%$
is a border-line HPQ, particularly since its available 70 RoboPol measurements give an average $p_{opt}$
= 1.28%. Thus, even though it is a confirmed LPRQ in the old literature, it remains at best a weak case of polarisation state transition.
$p_{opt}$
= 1.28%. Thus, even though it is a confirmed LPRQ in the old literature, it remains at best a weak case of polarisation state transition.
In summary, we find that out of the 63 HPQs in our RoboPol sample, just two are confirmed cases and four are ‘probable’ cases of polarisation state transition over the time interval of $\sim$
3 decades preceding the RoboPol survey. Thus, the frequency of polarimetric state transition is
$\sim$
3 decades preceding the RoboPol survey. Thus, the frequency of polarimetric state transition is $\sim$
3%, and within 10% even if the four ‘probable’ cases are accepted. This is consistent with the upper limit of
$\sim$
3%, and within 10% even if the four ‘probable’ cases are accepted. This is consistent with the upper limit of $\sim$
10% deduced in Paper I, based albeit on a 2.3 times smaller RoboPol sample of 27 HPQs. A consistent result is found when we consider just the
$\sim$
10% deduced in Paper I, based albeit on a 2.3 times smaller RoboPol sample of 27 HPQs. A consistent result is found when we consider just the $z \lt 1$
subset of the 63 HPQs. It is found that out of the total 54 such HPQs, one (0748+126) is a confirmed case of transition and another three (0827+243, 1012+232, and 2021+614) are probable cases. Thus, taken together, at most four (i.e.,
$z \lt 1$
subset of the 63 HPQs. It is found that out of the total 54 such HPQs, one (0748+126) is a confirmed case of transition and another three (0827+243, 1012+232, and 2021+614) are probable cases. Thus, taken together, at most four (i.e., $\sim$
7%) of the 54 HPQs with
$\sim$
7%) of the 54 HPQs with $z \lt 1$
have undergone polarimetric state transition over the time interval of
$z \lt 1$
have undergone polarimetric state transition over the time interval of $\sim$
3 decades preceding the RoboPol survey.
$\sim$
3 decades preceding the RoboPol survey.
3.1.2. The RoboPol LPRQs
Bearing in mind the fluctuating polarisation of HPQs, and broadly in conformity with the analysis of IT90, we shall accept a source as a confirmed LPRQ only provided its $p_{opt}$
is consistently found to be
$p_{opt}$
is consistently found to be $\leq$
3% in all available (at least two) measurements. Considering
$\leq$
3% in all available (at least two) measurements. Considering $p_{new}$
values given in col. 9 of Table 1, this condition is satisfied by 11 quasars having
$p_{new}$
values given in col. 9 of Table 1, this condition is satisfied by 11 quasars having $N \geq 2$
. These are: 0014+813, 0333+321, 0403-132, 0833+585, 0836+710, 1426+428, 1606+105, 1637+574, 1652+398, 1928+738, and 2141+175. Below we mention any evidence that these bona-fide LPRQs in our RoboPol sample had appeared in HPQ state in the old literature, thus indicating a state transition.
$N \geq 2$
. These are: 0014+813, 0333+321, 0403-132, 0833+585, 0836+710, 1426+428, 1606+105, 1637+574, 1652+398, 1928+738, and 2141+175. Below we mention any evidence that these bona-fide LPRQs in our RoboPol sample had appeared in HPQ state in the old literature, thus indicating a state transition.
0014+813, 0833+585, 1606+105 and 2141+175: These four RoboPol LPRQs were reported to be in the same (i.e., LPRQ) polarisation state in the old literature, based on a single available measurement.
0333+321, 1637+574 and 1928+738: These three RoboPol LPRQs were consistently found in the same (i.e., LPRQ) polarisation state in the old literature, based on multiple available measurements.
0403-132 and 1652+398: These two RoboPol LPRQs are clear cases of state transition from HPQ to LPRQ.
0836+710 and 1426+428: These two RoboPol LPRQs were reported to be in the same (i.e., LPRQ) polarisation state in the old literature, based on both available measurements.
Thus, it is seen that out of the 11 confirmed LPRQs in the RoboPol sample (Table 1), just two are clear cases of polarisation state transition over the three decades preceding the RoboPol survey. If we now exclude the five of these 11 LPRQs because of their lying at $z \gt 1$
(whose names are underlined), then the remaining six LPRQs contain no clear case of polarimetric state transition.
$z \gt 1$
(whose names are underlined), then the remaining six LPRQs contain no clear case of polarimetric state transition.
In summary, for our combined RoboPol sample consisting of 59 HPQs, 18 LPRQs, and six border-line cases (Section 2), it is seen that only four out of these total 83 quasars ( $\sim$
5%) are clear cases of polarisation state transition over the three decades preceding the RoboPol survey. The fraction would become 8/83 (
$\sim$
5%) are clear cases of polarisation state transition over the three decades preceding the RoboPol survey. The fraction would become 8/83 ( $\sim$
10%) if the four probable cases of transition are also included (Section 3.1.1). Considering only the
$\sim$
10%) if the four probable cases of transition are also included (Section 3.1.1). Considering only the $z \lt 1$
subset of our RoboPol sample, which consists of 65 sources, there is only one clear and three probable cases of polarimetric state transition. Thus, the estimates for both the entire RoboPol sample and its
$z \lt 1$
subset of our RoboPol sample, which consists of 65 sources, there is only one clear and three probable cases of polarimetric state transition. Thus, the estimates for both the entire RoboPol sample and its $z \lt 1$
subset are consistent with the fraction of
$z \lt 1$
subset are consistent with the fraction of $\lesssim$
10% reported in Paper I, based on opto-polarimetric measurements for a 2.6 times smaller sample of RoboPol quasars.
$\lesssim$
10% reported in Paper I, based on opto-polarimetric measurements for a 2.6 times smaller sample of RoboPol quasars.
3.2. Polarisation state fluctuations/swings on month/year-like timescales
Having argued for a remarkable stability of polarisation state in an overwhelming majority of radio quasars on decade-like timescales, it would be interesting to verify the previous claims of roughly a quarter of quasars undergoing polarisation state transitions on year-like timescales itself, as reported in IT90 (see, also, Paper I). To make an equivalent check employing an independent and larger sample of radio quasars, we use here the polarimetric data listed in Table 1 for the present RoboPol sample of 83 radio quasars, where the number of polarimetric measurements per quasar has been restricted to three (for cases with available $N>3$
, see Section 2). Not only is the present sample larger than that used in IT90, it also has the advantage of optical polarimetry performed in a homogeneous manner using a single instrument (RoboPol). From col. 9 of Table 1, out of the total 83 radio quasars, two or three RoboPol measurements (p1, p2, and possibly p3) are available for 64 quasars (including 52 HPQs, 10 LPRQs, and two border-line cases). For these sources, Table 1 lists the highest value of
$N>3$
, see Section 2). Not only is the present sample larger than that used in IT90, it also has the advantage of optical polarimetry performed in a homogeneous manner using a single instrument (RoboPol). From col. 9 of Table 1, out of the total 83 radio quasars, two or three RoboPol measurements (p1, p2, and possibly p3) are available for 64 quasars (including 52 HPQs, 10 LPRQs, and two border-line cases). For these sources, Table 1 lists the highest value of $p_{opt}$
, p1 followed by p2 and p3, in decreasing order. The on-line Figure S1 displays a plot of p1 against p2 (or p3, if available) for the 64 quasars. The time interval between the two measurements for each quasar (col. 9 of Table 1) is found to have a median value of
$p_{opt}$
, p1 followed by p2 and p3, in decreasing order. The on-line Figure S1 displays a plot of p1 against p2 (or p3, if available) for the 64 quasars. The time interval between the two measurements for each quasar (col. 9 of Table 1) is found to have a median value of $\sim$
1 yr for the sample of 64 quasars. From the on-line Figure S1, it is seen that 18 out of the 64 quasars (
$\sim$
1 yr for the sample of 64 quasars. From the on-line Figure S1, it is seen that 18 out of the 64 quasars ( $\sim$
28 %) have shown a change of polarisation state on the year-like timescales during the RoboPol survey (2013–2017), by crossing the
$\sim$
28 %) have shown a change of polarisation state on the year-like timescales during the RoboPol survey (2013–2017), by crossing the $p_{opt} = 3\%$
threshold (in either direction, see Table 1). This fraction is probably an underestimate, if one considers the eight border-line cases (see on-line Figure S1) which are consistent with a state transition within one-
$p_{opt} = 3\%$
threshold (in either direction, see Table 1). This fraction is probably an underestimate, if one considers the eight border-line cases (see on-line Figure S1) which are consistent with a state transition within one- $\sigma$
error, suggesting that some of them may actually be bona-fide cases of transitions.
$\sigma$
error, suggesting that some of them may actually be bona-fide cases of transitions.
Thus, it appears from the analysis presented above that fluctuations/swings of HP/blazar state on month/year-like timescales and its long-term persistence (on decade-like timescales) can occur in tandem in beamed radio quasars. The two, apparently contrasting behaviours are probably manifestations of different physical processes. In particular, the observed fluctuations of polarisation state on month/year-like timescales are probably associated with transient events, like ejections of blobs of nonthermal plasma from the active nucleus (which subsequently appear as VLBI radio components), which too seem to take place on year-like timescales (e.g., Savolainen et al. Reference Savolainen, Wiik, Valtaoja, Jorstad and Marscher2002; Lister et al. Reference Lister2009; Liodakis et al. Reference Liodakis, Romani, Filippenko, Kiehlmann, Max-Moerbeck, Readhead and Zheng2018). Clues favouring this scenario emerge from the phenomenology associated with the occurrence of $\gamma$
-ray outbursts in FSRQs. These are often found to correlate with (i) millimetric outbursts (e.g., Jorstad et al. Reference Jorstad, Marscher, Mattox, Aller, Aller, Wehrle and Bloom2001; Lähteenmäki & Valtaoja Reference Lähteenmäki and Valtaoja2003; Wehrle et al. Reference Wehrle2012; Marscher et al. Reference Marscher, Jorstad, Agudo, MacDonald and Scott2012; Gupta et al. Reference Gupta2017) and concomitant variation in optical polarisation properties (e.g., Blinov et al. Reference Blinov2018), and (ii) emergence of new jet features during the outbursts, which subsequently become optically thin and detected by VLBI as knots in the parsec-scale jets (e.g., Jorstad et al. Reference Jorstad, Marscher, Mattox, Aller, Aller, Wehrle and Bloom2001). Examples of new plasmon being ejected from the radio core (or passing through it), accompanied by a millimetric/radio (and/or optical) outburst have been extensively reported (e.g., Krichbaum et al. Reference Krichbaum1990; Mutel et al. Reference Mutel, Phillips, Su and Bucciferro1990; Abraham et al. Reference Abraham, Carrara, Zensus and Unwin1996; Tateyama et al. Reference Tateyama, Kingham, Kaufmann, Piner, Botti and de Lucena1999; Savolainen et al. Reference Savolainen, Wiik, Valtaoja, Jorstad and Marscher2002; Karamanavis et al. Reference Karamanavis2016; Liodakis et al. Reference Liodakis2020).
$\gamma$
-ray outbursts in FSRQs. These are often found to correlate with (i) millimetric outbursts (e.g., Jorstad et al. Reference Jorstad, Marscher, Mattox, Aller, Aller, Wehrle and Bloom2001; Lähteenmäki & Valtaoja Reference Lähteenmäki and Valtaoja2003; Wehrle et al. Reference Wehrle2012; Marscher et al. Reference Marscher, Jorstad, Agudo, MacDonald and Scott2012; Gupta et al. Reference Gupta2017) and concomitant variation in optical polarisation properties (e.g., Blinov et al. Reference Blinov2018), and (ii) emergence of new jet features during the outbursts, which subsequently become optically thin and detected by VLBI as knots in the parsec-scale jets (e.g., Jorstad et al. Reference Jorstad, Marscher, Mattox, Aller, Aller, Wehrle and Bloom2001). Examples of new plasmon being ejected from the radio core (or passing through it), accompanied by a millimetric/radio (and/or optical) outburst have been extensively reported (e.g., Krichbaum et al. Reference Krichbaum1990; Mutel et al. Reference Mutel, Phillips, Su and Bucciferro1990; Abraham et al. Reference Abraham, Carrara, Zensus and Unwin1996; Tateyama et al. Reference Tateyama, Kingham, Kaufmann, Piner, Botti and de Lucena1999; Savolainen et al. Reference Savolainen, Wiik, Valtaoja, Jorstad and Marscher2002; Karamanavis et al. Reference Karamanavis2016; Liodakis et al. Reference Liodakis2020).
4. Conclusions
For a well-defined sample of 83 radio quasars extracted from the RoboPol survey (2013–2017), for which opto-polarimetric measurements taken prior to 1990 could be found in the literature, we have made a source-wise comparison of the polarisation states observed during these two time spans separated by about three decades, taking the conventional $p_{opt}$
= 3% as the division between HPQs (blazars) and LPRQs. Our well-defined sample consists of 59 HPQs, 18 LPRQs, and six border-line cases. This comparison, based purely on opto-polarimetric measurements for a fairly large quasar sample, has revealed that
$p_{opt}$
= 3% as the division between HPQs (blazars) and LPRQs. Our well-defined sample consists of 59 HPQs, 18 LPRQs, and six border-line cases. This comparison, based purely on opto-polarimetric measurements for a fairly large quasar sample, has revealed that $\sim$
90% of them have retained their polarisation class over the three to four decades long time baseline. This confirms the finding of Paper I, based on opto-polarimetric data for a
$\sim$
90% of them have retained their polarisation class over the three to four decades long time baseline. This confirms the finding of Paper I, based on opto-polarimetric data for a $\sim$
2.5 times smaller RoboPol sample of quasars. The implied long-term stability of optical polarisation state in radio quasars is shown here to hold even for their
$\sim$
2.5 times smaller RoboPol sample of quasars. The implied long-term stability of optical polarisation state in radio quasars is shown here to hold even for their $z \lt 1$
subset whose optical flux is much less contaminated by the thermal emission from the accretion disk. The long-term stability is particularly remarkable in view of the polarisation state swings/transitions which are also found here and elsewhere (IT90; Paper I) to occur on year-like timescales, for a sizable fraction (
$z \lt 1$
subset whose optical flux is much less contaminated by the thermal emission from the accretion disk. The long-term stability is particularly remarkable in view of the polarisation state swings/transitions which are also found here and elsewhere (IT90; Paper I) to occur on year-like timescales, for a sizable fraction ( $\sim$
25%) of radio quasars. Apparently, the long-term stability of the HP/blazar mode and its transience on much shorter (year-like) timescales comprise two physical processes which need to be distinguished, although they might be at work simultaneously. The fluctuations/swings of polarisation state on year-like timescales are probably associated with transient events, such as the relatively frequent, semi-regular ejections of blobs of synchrotron plasma from the central engine, which are subsequently observed as parsec-scale radio knots in the VLBI images of the nuclear radio jets.
$\sim$
25%) of radio quasars. Apparently, the long-term stability of the HP/blazar mode and its transience on much shorter (year-like) timescales comprise two physical processes which need to be distinguished, although they might be at work simultaneously. The fluctuations/swings of polarisation state on year-like timescales are probably associated with transient events, such as the relatively frequent, semi-regular ejections of blobs of synchrotron plasma from the central engine, which are subsequently observed as parsec-scale radio knots in the VLBI images of the nuclear radio jets.
Acknowledgements
We thank the anonymous reviewer for a constructive feedback. GK acknowledges a Senior Scientist fellowship from the Indian National Science Academy. This research has made use of data from the RoboPol programme, a collaboration between Caltech, the University of Crete, IA-FORTH, IUCAA, the MPIfR, and the Nicolaus Copernicus University, which was conducted at Skinakas Observatory in Crete, Greece. This work has also made use of the NASA/IPAC Extragalactic Database (NED) which is operated by the Jet Propulsion Laboratory, California Institute of Technology, under contract with the National Aeronautics and Space Administration.
Data availability
The data used in this study are publicly available in peer-reviewed publications listed in the reference section.