


Preface
The following set of papers describe in detail the science goals of the future Space Infrared telescope for Cosmology and Astrophysics (SPICA). The SPICA satellite will employ a 2.5-m telescope, actively cooled to around 6K, and a suite of mid- to far-IR spectrometers and photometric cameras, equipped with state of the art detectors. In particular, the SPICA Far-Infrared Instrument (SAFARI) will be a grating spectrograph with low (R = 300) and medium (R ≃ 3000–11000) resolution observing modes instantaneously covering the 35–230μm wavelength range. The SPICA Mid-Infrared instrument (SMI) will have three operating modes: a large field of view (12arcmin × 10 arcmin) low-resolution (LR) 17–36μm spectroscopic (R ~ 50–120) and photometric camera at 34μm, a medium resolution (R ≃ 2000) grating spectrometer covering wavelengths of 17–36μm, and a high-resolution echelle module (R ≃ 28000) for the 12–18μm domain. A large field of view (80arcsec × 80 arcsec), three channel (110, 220, and 350μm) polarimetric camera will also be part of the instrument complement. These articles will focus on some of the major scientific questions that the SPICA mission aims to address, more details about the mission and instruments can be found in Roelfsema et al. (Reference Roelfsema2017).
1 INTRODUCTION
Heavy elements (i.e. elements heavier than He, also known as metals) carry the signature of galaxy evolution. The study of their content and composition in galaxies allows us to look back at the history of the internal recycling of matter: gas accretion feeding star formation episodes and nuclear activity produced by supermassive black holes (SMBH), the enrichment of the gas in the interstellar medium (ISM), or the depletion of heavy elements into dust. The ensemble of the processes involved, known as the ‘baryon cycle’ (Davé, Finlator, & Oppenheimer Reference Davé, Finlator and Oppenheimer2012), are invoked to explain fundamental characteristics observed in the present day Universe such as the mass–metallicity relation, where the highest metallicities are found in the most massive galaxies (Tremonti et al. Reference Tremonti2004; Gallazzi et al. Reference Gallazzi, Charlot, Brinchmann and White2006).
In this scenario, the interstellar and intergalactic media—ISM and IGM, respectively—are progressively enriched with heavy elements after a series of matter cycling. These are mixed in the gas phase of the ISM and IGM, but are also the main components of the solid phase in the form of dust grains (Draine Reference Draine2003). Despite their small contribution in terms of mass fraction (≲ 1% of the galaxy mass), heavy elements and dust are fundamental components with a strong influence on the observational properties of galaxies and a main role in the physical and chemical processes that take place in the ISM, e.g. absorption of the optical and UV radiation and re-emission into the infrared (IR), ISM cooling favouring the cloud collapse, and subsequent star formation.
Therefore, to understand the physical mechanisms driving the evolution of galaxies, it is essential to probe the products of the baryon cycle over cosmic time. Since the vast majority of star formation and SMBH accretion activity in the universe occurs during a dust-embedded phase in the evolution of galaxies (see Madau & Dickinson Reference Madau and Dickinson2014), the content and composition of metal and dust cannot be accurately derived from tracers in the rest-frame obscured optical range. The use of tracers able to peer into highly obscured environments is mandatory to investigate the content of metals and dust from the peak of star-formation activity and SMBH accretion at z ~ 1–3 to the Local Universe (e.g. Boyle & Terlevich Reference Boyle and Terlevich1998; Franceschini et al. Reference Franceschini, Hasinger, Miyaji and Malquori1999; Madau & Dickinson Reference Madau and Dickinson2014; Mancuso et al. Reference Mancuso, Lapi, Shi, Cai, Gonzalez-Nuevo, Béthermin and Danese2016). Thus, the answers to fundamental questions in the field of galaxy evolution rely on the contribution of an IR observatory: how are heavy elements and dust produced? how is dust destroyed? Can we describe quantitatively the cycle of matter in galaxies and the physical processes involved? What fundamental physical processes determine the chemical evolution of galaxies?
The present work is focused on the role that a cryogenic IR observatory like the SPace Infrared telescope for Cosmology and Astrophysics Footnote 1 (SPICA; Swinyard et al. Reference Swinyard2009, Nakagawa et al. Reference Nakagawa, Shibai, Onaka, Matsuhara, Kaneda, Kawakatsu, Roelfsema, Oschmann, Clampin, Fazio and MacEwen2014, Sibthorpe et al. Reference Sibthorpe, Helmich, Roelfsema, Kaneda and Shibai2016, Roelfsema et al. Reference Roelfsema2017), with its 2.5-m primary mirror actively cooled to below 8K, would play to understand the chemical evolution of galaxies from z ~ 3 till the present time. The SPICA observatory has been proposed by a European–Japanese collaboration as the fifth medium-sized class (M5) mission of the European Space Agency (ESA) Cosmic Vision programme. In this paper, enclosed in the SPICA white paper series on galaxy evolution, we explore the power of SPICA in detecting lines and features which can allow robust measurements of the metallicity and dust composition in galaxies. We refer to Spinoglio et al. (Reference Spinoglio2017) for the general overview on SPICA studies of galaxy evolution and for the description of the power of IR line diagnostics. The paper is organised as follows: in Section 2, we address the key scientific questions that we want to investigate; the main observables, abundance tracers, and dust features available in the mid- to far-IR range are described in Section 3; in Section 4, we discuss the role that SPICA would play to address the above science questions; the possible synergies with future facilities available in the late 2020s are described in Section 5; finally, the main conclusions of this study are summarised in Section 6.
2 THE CHEMICAL EVOLUTION OF GALAXIES
The total content of dust and metals in galaxies is determined by the balance among star formation, the different episodes of gas accretion and ejection (produced by gravity torques and gas inflow motions, and winds and outflows, respectively), and the role of active galactic nuclei (AGN). The influence of these physical processes in the ISM chemistry and its evolution over cosmic time—from the build-up of metals and dust in galaxies till the present time—are still a matter of discussion. However, the past history of galaxy evolution is recorded in the global content and distribution of metals and dust. These are the main products of the matter cycle and show their imprint in the IR spectrum, in the form of continuum emission, spectral lines, and dust spectral features. Moreover, their spatial distribution across the galaxy may also reflect the past activity of the baryon cycle. Thus, a consistent picture describing the role of the different physical mechanisms in the evolution of galaxies should explain, at once, how the global content of metals and dust in galaxies evolves with cosmic time, and how galaxies were assembled.
In this context, we identify three main questions in the field of chemical evolution whose answers are key to understand how galaxies have evolved in the last ~ 11Gyr: (i) how are metals distributed within galaxies? (ii) how did the global content of metals in galaxies evolve with cosmic time? and (iii) how did metals locked into dust grains evolve from high-z till the present time?
2.1. The assembly of galaxies
Current models of galaxy formation predict that galaxy discs form through accretion of matter in an inside-out growth, with a combination of inflow and outflow events regulating the process of metal enrichment (Fu et al. Reference Fu, Hou, Yin and Chang2009; Davé et al. Reference Davé, Finlator and Oppenheimer2012; Anglés-Alcázar et al. Reference Anglés-Alcázar, Davé, Özel and Oppenheimer2014). The accreted gas reaches higher densities in the interior of the galaxy, leading to higher star-formation rates and a faster reprocessing of gas, which results in higher metallicities in the bulge and in the inner part of discs. This is followed by a decreasing metallicity towards outer regions populated by younger stars formed from poorly enriched material (e.g. González Delgado et al. Reference González Delgado2015). While outflow activity is potentially capable of transferring the high abundance of metals to the halo or even the IGM (Oppenheimer & Davé Reference Oppenheimer and Davé2006), and subsequent inflows can further recycle them, observations have to be performed to ascertain the history of chemical evolution and the way in which outflows and inflows have shaped it (see also González-Alfonso et al. Reference González-Alfonso2017). Since the spatial distribution contain the imprint of gas inflow and outflow episodes throughout the lifetime of these galaxies, tracing the spatial gradients of heavy element abundances in present day galaxies provides a unique insight into their evolutionary history.
2.2. The evolution of metallicity in galaxies
The ISM of massive galaxies shows a higher content of heavy elements when compared to less massive ones, as was discovered early by Lequeux et al. (Reference Lequeux, Peimbert, Rayo, Serrano and Torres-Peimbert1979). Later, Mannucci et al. (Reference Mannucci, Cresci, Maiolino, Marconi and Gnerucci2010) and Lara-López et al. (Reference Lara-López2010) incorporated and additional dependency on the SFR required to describe the evolution of galaxies up to z ~ 3.7. Thus, the impact of the baryon cycle determines the relation among fundamental properties of galaxies such as the gas metallicity, the stellar mass, and the SFR. This is illustrated in Figure 1, where the mass–metallicity relation is obtained for galaxies in different bins of SFR (Andrews & Martini Reference Andrews and Martini2013). The metallicities in Figure 1 are based on the direct method, i.e. using the weak auroral lines to determine the gas temperature, the latter is one of the main uncertainties of the strong-line method based on the calibration of bright emission lines sensitive to the metallicity (e.g. Tremonti et al. Reference Tremonti2004, see Section 3 for further details). Thereafter, Bothwell et al. (Reference Bothwell, Maiolino, Kennicutt, Cresci, Mannucci, Marconi and Cicone2013) interpreted the dependence on the SFR as a by-product of the molecular gas content, via the Schmidt–Kennicutt relation (Schmidt Reference Schmidt1959; Kennicutt Reference Kennicutt1998). In this scenario, the chemical enrichment is driven by the increase of the specific SFR due to the larger disc gas fractions in galaxies at high-z (Bothwell et al. Reference Bothwell, Maiolino, Peng, Cicone, Griffith and Wagg2016a, Reference Bothwell, Maiolino, Cicone, Peng and Wagg2016b), and can be triggered by the accretion of pristine gas from the cosmic web and/or mergers with metal-poor companions (Hunt et al. Reference Hunt, Dayal, Magrini and Ferrara2016a, Reference Hunt, Dayal, Magrini and Ferrara2016b). On the other hand, outflows of enriched material dominate at low redshift, explaining the correlation with the stellar mass (e.g. Peeples & Shankar Reference Peeples and Shankar2011; Davé, Finlator, & Oppenheimer Reference Davé, Finlator and Oppenheimer2011; Somerville & Davé Reference Somerville and Davé2015).
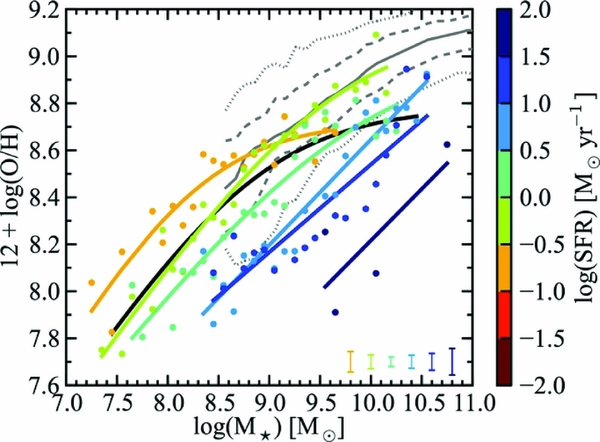
Figure 1. The mass–metallicity relation determined from direct abundance measurements based on optical fine-structure lines for ~200000 star-forming galaxies selected from the Sloan Digital Sky Survey (0.027 < z < 0.25) grouped in different bins of SFR. The colour-coded circles correspond to stacks of galaxies for each bin in SFR (mean error is indicated in the lower right). The coloured solid lines show asymptotic logarithmic fits to this relation for each bin in SFR, and the black-solid line in the centre of the figure shows the global fit. These are compared with the mass–metallicity relation from Tremonti et al. (Reference Tremonti2004), based on the strong-line method (the solid, dashed, and dotted grey lines correspond to the median, 68 and 95% contour of the relation, respectively). Figure adapted from Andrews & Martini (Reference Andrews and Martini2013).
In the present-day picture, the relation between galaxy mass and gas metallicity is a by-product of the internal cycle of matter in galaxies during their evolution with cosmic time (Davé et al. Reference Davé, Finlator and Oppenheimer2012), and it is due to several reasons: (i) starburst wind outflows in low-mass galaxies eject the metal-enriched material to the halo and the IGM due to the shallow gravitational potential well, resulting in a less efficient enrichment compared to massive galaxies (Tremonti et al. Reference Tremonti2004); (ii) the ‘galaxy downsizing’ scenario, i.e. low-metallicity galaxies in the Local Universe are associated with a high specific SFR and are found in low-mass systems, which are still in an early evolutionary stage because they have converted only a small fraction of their gas mass into stars (e.g. Brooks et al. Reference Brooks, Governato, Booth, Willman, Gardner, Wadsley, Stinson and Quinn2007); (iii) dependence of the shape of the initial mass function (IMF) with the galaxy mass (Köppen, Weidner, & Kroupa Reference Köppen, Weidner and Kroupa2007); and (iv) infall of metal-poor gas from the halo and/or the IGM (Finlator & Davé Reference Finlator and Davé2008; Brooks et al. Reference Brooks, Governato, Quinn, Brook and Wadsley2009).
If the same physical processes are in place in the Local Universe and at high-z, then the chemical evolution of galaxies should be governed by a reduced number of fundamental properties. Diverse models of galaxy formation and evolution predict manifold evolutionary patterns of the mass–metallicity relation as a function of redshift. These patterns lead to different properties in the modelled galaxies such as the slope of the mass–metallicity relation and its scaling with redshift, scatter around the mass–metallicity relation due to fluctuations in the baryon cycle activity, and the mass fraction of atomic and molecular gas (e.g. Davé et al. Reference Davé, Rafieferantsoa, Thompson and Hopkins2017). So far, most of the models reproduce the growth of the stellar mass in galaxies over cosmic time, but the global content of heavy elements and the gas fraction are largely unconstrained. Therefore, observational data of galaxies from high-z to the Local Universe are required to test these properties, discriminate among the different cosmological simulations, and understand the physical processes driving the chemical evolution in galaxies.
2.3. The build-up of cosmic dust
Heavy elements produced in the baryon cycle are partially locked into dust grains, and constitute the solid-phase of the ISM (Draine Reference Draine2003; Peimbert & Peimbert Reference Peimbert and Peimbert2010). The dust has a strong influence on the observational properties of galaxies, with a main role in the heating and cooling processes (Spitzer Reference Spitzer1948; Borkowski & Harrington Reference Borkowski and Harrington1991; van Hoof et al. Reference van Hoof, Weingartner, Martin, Volk, Ferland, Ferland and Savin2001), and as catalyst of chemical processes in the ISM (e.g. the formation of H2 driving the molecular chemistry). Dust grains absorb the UV light and re-radiate it in the IR, shielding the dense gas, and by these means triggering the formation of molecular clouds where new stars are born. The grain surfaces and the polycyclic aromatic hydrocarbons (PAHs) participate in a large number of chemical reaction networks in different phases of the ISM (Bakes & Tielens Reference Bakes and Tielens1998), and also provide photoelectric heating of gas in photo-dissociation regions (Draine Reference Draine2011; Bakes & Tielens Reference Bakes and Tielens1994). Moreover, dust cooling is able to alter the shape of the IMF by favouring the cloud fragmentation, thus inhibiting the formation of massive stars and fostering the creation of low-mass stars (Omukai et al. Reference Omukai, Tsuribe, Schneider and Ferrara2005). On the other hand, dust grains suffer from processing and destruction due to intense radiation fields, sputtering (impacts with gas ions), shattering (grain–grain collisions), shocks due to SNe explosions, astration into newly formed stars, and photo-processing by cosmic rays and UV/X-ray fields in the vicinity of AGN.
Little is known on the dust chemistry and its evolution over cosmic time. Even in the Milky Way and its neighbourhood, fundamental aspects in the astrochemistry of dust are not well understood: the dust composition in star-forming regions (Peimbert & Peimbert Reference Peimbert and Peimbert2010), the ISM (e.g. Nieva & Przybilla Reference Nieva and Przybilla2012), and planetary nebulae (PNe; Clegg & Harrington Reference Clegg and Harrington1989; Bernard-Salas et al. Reference Bernard-Salas, Peeters, Sloan, Gutenkunst, Matsuura, Tielens, Zijlstra and Houck2009b); the depletion of elements onto dust grains (e.g. Delgado Inglada et al. Reference Delgado Inglada, Rodríguez, Mampaso and Viironen2009; Simón-Díaz & Stasińska Reference Simón-Díaz and Stasińska2011); the dust-to-gas ratios, grain size distribution, and dust destruction (Mallik & Peimbert Reference Mallik and Peimbert1988; Stasińska & Szczerba Reference Stasińska and Szczerba1999; van Hoof et al. Reference van Hoof2013; Asano et al. Reference Asano, Takeuchi, Hirashita and Nozawa2013b); the physical mechanisms involved in the dust-phase catalysis within the ISM and subsequent enrichment of the gas phase (Dulieu et al. Reference Dulieu, Congiu, Noble, Baouche, Chaabouni, Moudens, Minissale and Cazaux2013). Nevertheless, the dust composition and its properties are critical ingredients to describe the evolution of galaxies (Rémy-Ruyer et al. Reference Rémy-Ruyer2014), while the uncertainties mentioned above escalate significantly for studies of galaxies at high-z (e.g. Popping, Somerville, & Galametz Reference Popping, Somerville and Galametz2017). Currently, models describing the chemical evolution in galaxies (e.g. Asano et al. Reference Asano, Takeuchi, Hirashita and Inoue2013a) rely on dust studies in local metal-poor dwarfs (e.g. Rémy-Ruyer et al. Reference Rémy-Ruyer2015), which are usually adopted as a benchmark case for the ISM in galaxies at high-z. However, there is firm observational evidence suggesting that the dust properties are not universal, e.g. chemical composition, gas-to-dust and dust-to-metal ratios, and grain size distribution (see Zhukovska et al. Reference Zhukovska, Dobbs, Jenkins and Klessen2016, and references therein). The characteristics of dust in the early Universe may be quite different from those seen in local metal-poor dwarfs, thus probing the dust properties in galaxies at high-z is the only way to constrain the solid phase of the ISM in chemical evolution models.
3 METALLICITY TRACERS IN THE INFRARED
An accurate description of the chemical evolution in galaxies requires reliable tracers to quantify the abundances of the different chemical species in the ISM. Specifically, it is essential to use appropriate tracers able to peer into the dust-embedded phase in the evolution of galaxies, which represents the bulk of the star formation and black hole accretion activity (Madau & Dickinson Reference Madau and Dickinson2014; Mancuso et al. Reference Mancuso, Lapi, Shi, Cai, Gonzalez-Nuevo, Béthermin and Danese2016).
So far, the vast majority of studies probing the abundances of heavy elements and their evolution with redshift rely on the determination of oxygen abundances using optical line diagnostics. Among them, one can distinguish two main types of diagnostics, those based on the determination of the electron temperature using the weak auroral lines (the direct method; e.g. Izotov, Thuan, & Lipovetsky Reference Izotov, Thuan and Lipovetsky1994, Reference Izotov, Thuan and Lipovetsky1997; Izotov & Thuan Reference Izotov and Thuan1999; Kennicutt, Bresolin, & Garnett Reference Kennicutt, Bresolin and Garnett2003; Hägele et al. Reference Hägele, Díaz, Terlevich, Terlevich, Pérez-Montero and Cardaci2008), and those based on the calibration of bright emission-line ratios sensitive to the gas metallicity (Pagel et al. Reference Pagel, Edmunds, Blackwell, Chun and Smith1979; McGaugh Reference McGaugh1991; Pilyugin Reference Pilyugin2001a; Pilyugin & Thuan Reference Pilyugin and Thuan2005; Dors & Copetti Reference Dors and Copetti2005). The main limitations that affect optical-based tracers are (i) dust obscuration, which restricts the abundance measurements to the unobscured regions in galaxies; (ii) poor determination of the electron temperature, which is based on temperature-sensitive auroral lines (e.g. [Oiii]λ4363, [Nii]λ5755), typically faint and difficult to detect (Bresolin et al. Reference Bresolin, Schaerer, González Delgado and Stasińska2005; Moustakas et al. Reference Moustakas, Kennicutt, Tremonti, Dale, Smith and Calzetti2010); (iii) systematic discrepancies in the calibration of strong-line abundance diagnostics, based on the brightest collisionally excited lines such as [Oiii]λ4959, 5007, [Nii]λ6548, 6584, [Sii]λ6716, 6731, Hα, and Hβ. Although these calibrations provide reliable abundances in relative terms, they show large systematic discrepancies (up to ~ 0.7dex) in the absolute oxygen abundances derived among the various empirical and theoretical calibrations for the line ratios (see Kewley & Ellison Reference Kewley and Ellison2008, and references therein). This is especially the case at high-z (Kewley, Geller, & Barton Reference Kewley, Geller and Barton2006), where physical conditions in the ISM can be significantly different than those in nearby galaxies. Furthermore, they also show a different turnover in the mass–metallicity relation when compared to direct metallicity determinations (see black- and grey-solid lines in Figure 1; Andrews & Martini Reference Andrews and Martini2013); (iv) temperature fluctuations across the nebula—e.g. produced by variations in the chemical abundances or densities—can lead to an error in the abundance estimates based on optical lines of a factor ~4 (Dors et al. Reference Dors2013). Moreover, except for the case of oxygen which shows strong emission lines for its main chemical species in the optical (e.g. [Oi]λ6300, 6364, [Oii]λ3726, 3729, [Oiii]λ4959, 5007), the rest of element abundances have to rely on uncertain ionisation correction factors to account for the unobserved stages of ionisation. Commonly adopted metallicity calibrations (i.e. indirect methods), based on the ratios of strong emission lines in the optical and UV range are the index R23 ≡ ([Oii]λ3727 + [Oiii]λ4959, 5007)/Hβ (Pilyugin Reference Pilyugin2001b; Pilyugin & Thuan Reference Pilyugin and Thuan2005); the index N2 ≡ [Nii]λ6584/Hα (Pettini & Pagel Reference Pettini and Pagel2004); the index O3N2 ≡ ([Oiii]λ5007/Hβ)/([Nii]λ6584/Hα) (Pettini & Pagel Reference Pettini and Pagel2004); a combination of [Nii]λ6584, Hα, and [Sii]λ6717, 6731 (Dopita et al. Reference Dopita, Kewley, Sutherland and Nicholls2016); in the UV, the index C43= log((Civλ1549 + Ciii]λ1909)/Heiiλ1640) for AGN (Dors et al. Reference Dors, Cardaci, Hägele and Krabbe2014); and a combination of the indices C3O3= log((Civλ1549 + Ciii]λ1909)/[Oiii]λ1664), C34= log((Civλ1549 + Ciii]λ1909)/Hi) (where Hi corresponds to a hydrogen recombination line, e.g. Hβ), and C3C4= log(Ciii]λ1909/Civλ1549) for star-forming regions (Pérez-Montero & Amorín Reference Pérez-Montero and Amorín2017).
3.1. Why IR tracers?
The use of robust metallicity tracers almost independent of the dust extinction, radiation field, and of the gas density are crucial to study the chemical evolution of galaxies. For instance, the metallicity inferred from the dust content of high-z sub-millimetre galaxies (SMG), determined with Herschel far-IR photometry, is more than an order of magnitude higher when compared to gas metallicity measurements based on optical nebular lines (Santini et al. Reference Santini2010). This discrepancy is most probably caused by dust obscuration. Since SMG are compact and dust-rich, most of the ISM is optically thick at visual wavelengths. Thus, the optical nebular lines only probe the outer parts of the star-forming regions, which are probably hardly enriched with heavy elements.
Abundance determinations based on mid- and far-IR lines offer two great advantages when compared to those derived from UV and optical lines: (i) IR lines are almost free from dust extinction; and (ii) they have a small dependency on the electron temperature (e.g. Bernard Salas et al. Reference Bernard-Salas, Pottasch, Beintema and Wesselius2001). The latter could be the origin of a known discrepancy between optical and IR tracers, where IR-based abundances tend to be higher when compared to those obtained using optical tracers (see Vermeij & van der Hulst Reference Vermeij and van der Hulst2002; Dors et al. Reference Dors2013). A comprehensive explanation of this discordance is still lacking, and therefore there is not a consensus in the field on what tracer (optical or IR) is more reliable. However, a possible explanation is given in Dors et al. (Reference Dors2013): temperature variations within the nebula that not resolved spatially in the spectra—e.g. produced by spatial variations in the chemical abundances—can lead to a systematic underestimation of the abundances derived from optical lines using the direct method by a factor ≲ 4 (0.6dex). For instance, this is the case of integrated spectra in galaxies. If confirmed, this result implies that tracers based on IR lines can be much more accurate, since their dependency on the electron temperature is feeble. Unfortunately, there are few galaxies where both methods can be applied and compared. Sensitive IR observations with the SPICA observatory for a sample of galaxies with available optical metallicity estimates would be essential to shed light on this issue and develop new and reliable abundance tracers.
In the Local Universe, SPICA would have access to several ionic fine-structure lines in the rest-frame mid- and far-IR spectra of galaxies. Thus, abundance diagnostics for heavy elements will be mainly based on ratios of these lines, which can be calibrated using photoionisation models such as Cloudy (Ferland et al. Reference Ferland2017) and Mappings Footnote 2 . The weak dependence with density can be easily constrained using density-sensitive ratios such as [Nii]122μm to [Nii]205μm, [Oiii]52μm to [Oiii]88μm, [Siii]18.7μm to [Siii]33.5μm, [Neiii]15.6μm to [Neiii]36.0μm, and [Nev]14.3μm to [Nev]24.3μm (Croxall et al. Reference Croxall2013). Furthermore, the hardness of the radiation field can also be constrained using the line ratios of [Niii]57μm to [Nii]122, 205μm, [Neiii]15.6μm to [Neii]12.8μm, and [Oiv]25.9μm to [Oiii]52, 88μm. On the other hand, the effects on the fine-structure lines produced by the combination of high far-IR optical depths and high ionisation parameters found in luminous and ultraluminous IR galaxies (LIRGs and ULIRGs, respectively; Graciá-Carpio et al. Reference Graciá-Carpio2011, Fischer et al. Reference Fischer, Abel, González-Alfonso, Dudley, Satyapal and van Hoof2014, González-Alfonso et al. Reference González-Alfonso2015) can also be calibrated with photoionisation models (e.g. Abel et al. Reference Abel, Dudley, Fischer, Satyapal and van Hoof2009, Graciá-Carpio et al. Reference Graciá-Carpio2011, Fischer et al. Reference Fischer, Abel, González-Alfonso, Dudley, Satyapal and van Hoof2014).
Besides the gas-phase abundances, a sensitive telescope in the mid- to far-IR range would be able to probe the composition of dust in galaxies at high-z through several solid-state features in the spectrum, such as forsterite (Mg2SiO4; 23, 33, 69μm), water ice at 44 and 62μm, MgS and FeS at ~ 30μm, FeO and SiO2 at around 21μm, iron-bearing crystalline silicates at ~ 55μm (Koike et al. Reference Koike, Chihara, Tsuchiyama, Suto, Sogawa and Okuda2003), fullerenes (C60 and C70), and PAHs (see the companion paper by Kaneda et al. Reference Kaneda2017 in this issue).
So far, the use of IR tracers based on mid- to far-IR spectroscopic observations with Spitzer and Herschel to study the chemical evolution of galaxies was restricted only to very luminous sources, due to sensitivity issues (e.g. Ruiz et al. Reference Ruiz, Risaliti, Nardini, Panessa and Carrera2013; Brisbin et al. Reference Brisbin, Ferkinhoff, Nikola, Parshley, Stacey, Spoon, Hailey-Dunsheath and Verma2015). Future facilities planned for the next decade will not cover this key spectral range. Therefore, their study of the chemical evolution in galaxies will be limited to unobscured regions in galaxies, and will rely on tracers with a strong dependency on the gas temperature (see Section 5).
The unique sensitivity of an IR observatory with the characteristics of SPICA would enable the study of key processes in the baryon cycle that are hidden to optical wavelengths. A description of the SPICA spectrometers, SMI and SAFARI, is given in Roelfsema et al. (Reference Roelfsema2017). Figure 2 shows the predicted spectra for starburst galaxies and AGN out to z = 4, assuming the spectral characteristics of a local starburst galaxy, and an AGN. The simulated spectra in this figure are based on the ISO/SWS + LWS and Spitzer/IRS observations of the starburst galaxy M82 and the Seyfert 2 galaxy NGC 1068. These galaxies were selected due to the availability of high S/N ISO-SWS and -LWS spectra which, combined with the high-spectral resolution Spitzer/IRS observations, allowed us to build spectral templates with a wide coverage in wavelength from 10 to 250μm, similar to the rest-frame range that would be accessible to SPICA. The spectra of both galaxies were scaled to a luminosity of 2 × 10¹²L⊙, and located at z = 1, 2, 3, and 4 (from top to bottom). The different observational modes of SMI and SAFARI would be sensitive enough to provide access to a unique suite of IR lines in the mid- to far-IR rest-frame spectra of starburst galaxies and AGN at the knee of the luminosity function up to z ~ 3.
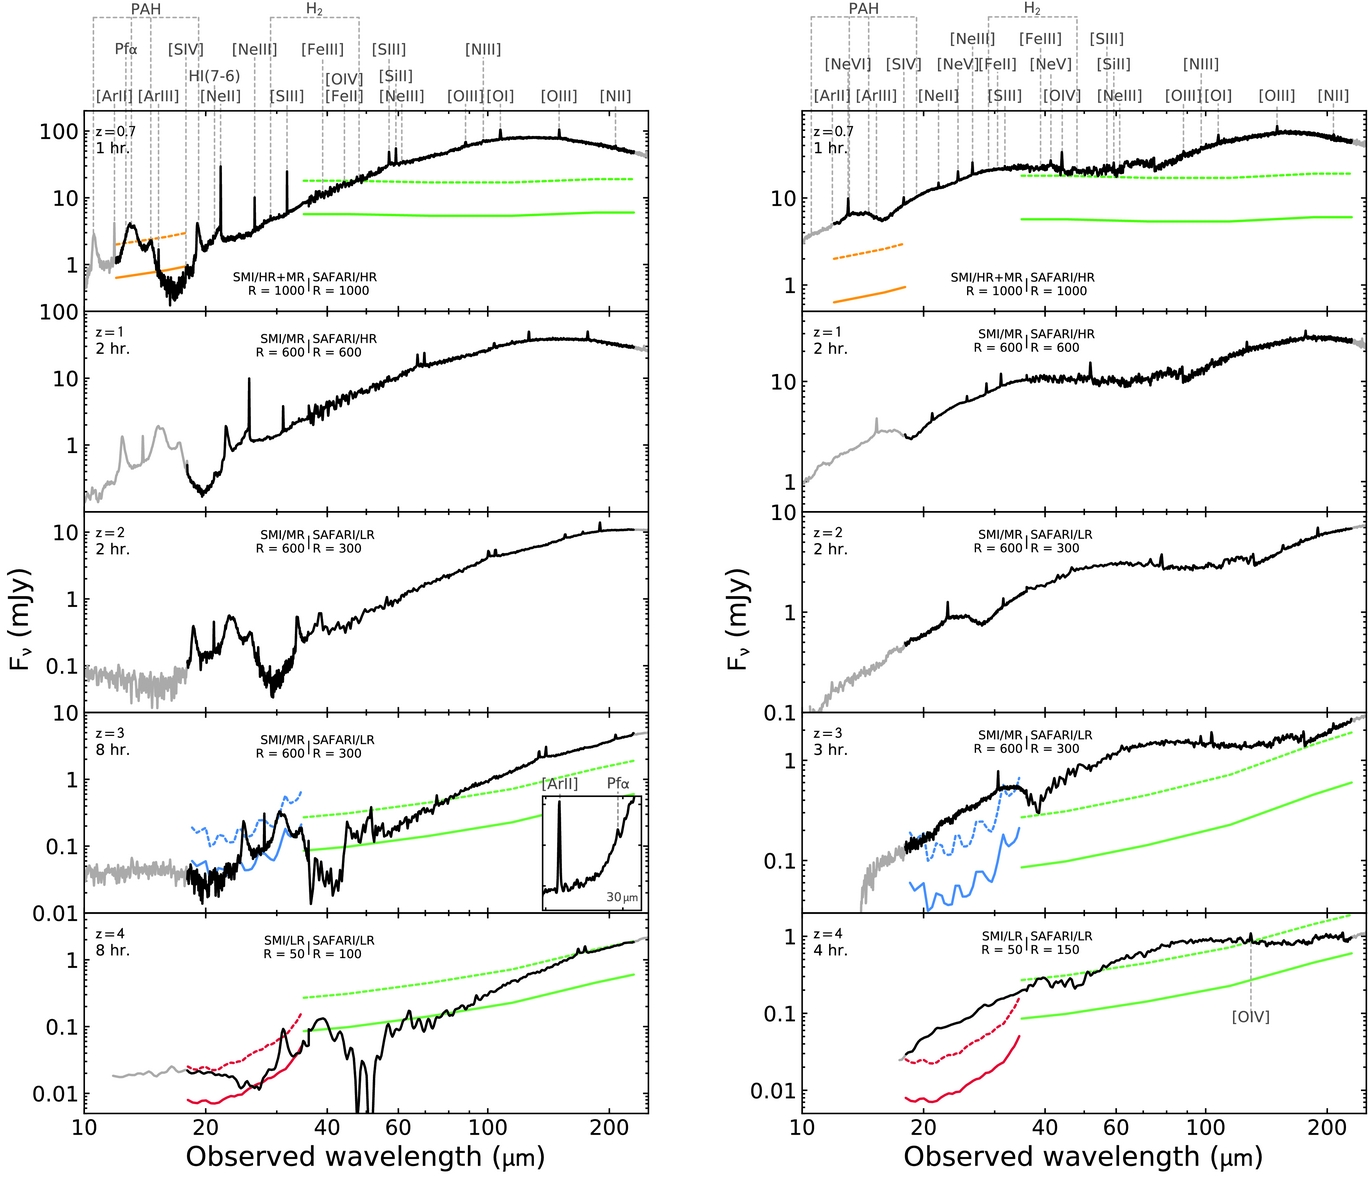
Figure 2. Simulated spectra for a starburst galaxy (left) and an AGN (right) with a luminosity of 2 × 10¹²L⊙ in the z = 1–4 range, assuming the spectral characteristics of M82 and NGC 1068, respectively, observed with ISO/SWS + LWS and Spitzer/IRS. The spectra are simulated at z = 1, 2, 3, and 4, from top to bottom. In each case, white noise was added to the spectra with an amplitude of $1 \sigma / \sqrt{t}$
, t being the exposure time assumed (indicated in the upper-left corner of each panel). Finally, the SMI and SAFARI spectral ranges were binned to the spectral resolution values indicated in each frame. The SPICA 5σ sensitivities for SMI (MR mode in blue, R ~ 1500; LR mode in red, R ~ 100) and SAFARI (in green, HR mode in the upper panels at z = 0.7; LR mode, R ~ 300, in the lower panels) are indicated for integration times of 1 h (dotted lines) and 10 h (solid lines). The Pfund-α would be detected in the 1.5 < z ≲ 3 range (see inset on the left panel at z = 3).
$1 \sigma / \sqrt{t}$
, t being the exposure time assumed (indicated in the upper-left corner of each panel). Finally, the SMI and SAFARI spectral ranges were binned to the spectral resolution values indicated in each frame. The SPICA 5σ sensitivities for SMI (MR mode in blue, R ~ 1500; LR mode in red, R ~ 100) and SAFARI (in green, HR mode in the upper panels at z = 0.7; LR mode, R ~ 300, in the lower panels) are indicated for integration times of 1 h (dotted lines) and 10 h (solid lines). The Pfund-α would be detected in the 1.5 < z ≲ 3 range (see inset on the left panel at z = 3).
In the following sections, we will focus on the observational strategies that SPICA could implement to determine heavy element abundances of galaxies from high-z to the Local Universe. First, we will describe the direct abundance determinations in Section 3.2, followed by the indirect methods in Sections 3.3 and 3.4. The main diagnostics are summarised in Table 1.
Table 1. Direct (upper rows) and indirect (lower rows) metallicity tracers based on the mid- to far-IR lines that could be exploited by SPICA. In the table, ‘[X]’ refers to any of the fine-structure lines found in the range accessible to SPICA (e.g. [S iii]18.7μm, [Ar ii]6.99μm, [Ne ii]12.8μm) whose corresponding ionic stage abundance can be determined from the flux ratio of the [X] line to any of the hydrogen recombination lines. The Huα line is relatively weak and thus is expected to be detected only in nearby galaxies (z ~ 0).

3.2. Direct abundance determinations
A direct determination for the abundances of the main ionic stages of several heavy elements could be obtained using ratios of IR fine-structure lines to hydrogen recombination lines. In the case of SPICA, this would be possible using Pfund-α—at 7.46μm in the rest frame—or Humphreys-α—Hi (7–6) or Huα at 12.37μm. At 1.5 < z ≲ 3, the medium-resolution mode (MR, R ~ 1500) of SMI would be able to cover simultaneously Pfund-α and the argon lines [Arii]6.99μm and [Ariii]8.99μm. For instance, Pfund-α could be detected by SMI/MR in a starburst galaxy with similar spectral characteristics to M82, scaled to 2 × 10¹²L⊙, as shown by the inset in Figure 2 (left panel, at z = 3). Then, the gas metallicity could be estimated from the ratio of argon to hydrogen lines, since argon does not suffer from depletion (Verma et al. Reference Verma, Lutz, Sturm, Sternberg, Genzel and Vacca2003). Since the ionisation potentials of Ar0 and Ar2+ are 15.8eV (> 13.6eV) and 40.7eV (< 54.4eV), respectively, the presence of Ar0 and Ar3+ could be expected. In the case of neutral argon, observations of star-forming regions do not show a significant contribution from this species, suggesting that most of the argon in the nebula is ionised (e.g. Lebouteiller et al. Reference Lebouteiller, Kunth, Lequeux, Lecavelier des Etangs, Désert, Hébrard and Vidal-Madjar2004, Reference Lebouteiller, Kunth, Lequeux, Aloisi, Désert, Hébrard, Lecavelier Des Étangs and Vidal-Madjar2006). This could be explained by a high photoionisation cross-section in the neutral argon (Sofia & Jenkins Reference Sofia and Jenkins1998). On the other hand, Ar2+ has a relatively low photoionisation cross-section for energies below 70eV (Verner et al. Reference Verner, Ferland, Korista and Yakovlev1996), and thus Ar3+ has a minor contribution for most Hii regions (≲ 3%, e.g. Peimbert Reference Peimbert2003; Tsamis et al. Reference Tsamis, Barlow, Liu, Danziger and Storey2003; García-Rojas et al. Reference García-Rojas, Esteban, Peimbert, Costado, Rodríguez, Peimbert and Ruiz2006; Lebouteiller et al. Reference Lebouteiller, Bernard-Salas, Brandl, Whelan, Wu, Charmandaris, Devost and Houck2008), although this could increase significantly when exposed to harder radiation fields in low-metallicity environments (~20%, Peimbert, Peimbert, & Ruiz Reference Peimbert, Peimbert and Ruiz2000). Therefore, the total argon abundance could be derived using an ionisation correction factor to account for the contribution of Ar3+ (e.g. Vermeij & van der Hulst Reference Vermeij and van der Hulst2002; Pérez-Montero et al. Reference Pérez-Montero, Hägele, Contini and Díaz2007; Hägele et al. Reference Hägele, Díaz, Terlevich, Terlevich, Pérez-Montero and Cardaci2008).
In combination with the LR (R ~ 300) of SAFARI, it would be also possible to obtain a direct determination of the neon abundance for star-forming galaxies up to z ~ 3, based on the [Neii]12.8μm and [Neiii]15.6μm lines. Ne2+ has a high ionisation potential (63.5eV) above the helium absorption edge in stars (54.4eV), and consequently Ne3+ does not exist in significant amounts (Bernard-Salas et al. Reference Bernard-Salas2009a; Hägele et al. Reference Hägele, Díaz, Terlevich, Terlevich, Pérez-Montero and Cardaci2008; Dors et al. Reference Dors2013). At the lower end, neutral neon could exist within the Strömgren radius due to its relatively high ionisation potential (21.6eV). However, a further investigation using photoionisation models proved that the expected amount of Ne0 within the nebula is negligible, with an ionisation correction factor below ≲ 1.05 for a wide range of ionisation parameter values (Martín-Hernández et al. Reference Martín-Hernández2002). In the case of sulphur, a minor contribution of S4+ is expected due to the high ionisation potential of S3+ (47.3eV), however S+ has an ionisation potential of 23.3eV and thus it could be present in the nebula. Based on measurements of the sulphur abundance in nearby star-forming regions (Peimbert Reference Peimbert2003; Vermeij & van der Hulst Reference Vermeij and van der Hulst2002; García-Rojas et al. Reference García-Rojas, Esteban, Peimbert, Costado, Rodríguez, Peimbert and Ruiz2006) and photoionisation models (Tsamis & Péquignot Reference Tsamis and Péquignot2005), the expected amount of S+ is less than ~10% of the total sulphur abundance (Lebouteiller et al. Reference Lebouteiller, Bernard-Salas, Brandl, Whelan, Wu, Charmandaris, Devost and Houck2008; Bernard-Salas et al. Reference Bernard-Salas2009a). As in the case of argon, the gas-phase abundance of sulphur could be derived from the [Siii]18.7μm and [Siv]10.5μm lines and the hydrogen recombination lines detected by SMI and SAFARI, using a relatively small ionisation correction factor.
In nearby galaxies, direct abundances could be determined using the Huα line (e.g. Bernard-Salas et al. Reference Bernard-Salas2009a), covered by SMI at high-spectral resolution (HR, R ~ 28000). As mentioned earlier, the weak dependence of the IR lines with the density and the effect of the radiation field hardness could be constrained using the corresponding diagnostics based on ratios of mid- and far-IR lines (e.g. Croxall et al. Reference Croxall2013). Besides argon, neon, and sulphur, we would be able to provide abundances for the dominant ionic species of nitrogen (N+ and N2+) and help in the determination of direct abundances for oxygen (O0, O2+, and O3+), iron (Fe+ and Fe2+), and carbon (C+), based on the spectral range covered by SMI and SAFARI ([Nii]122μm and [Niii]57μm; [Oi]63, 145μm, [Oiii]52, 88μm, and [Oiv]25.9μm; [Feii]17.9, 26.0μm and [Feiii]22.9μm; [Cii]158μm).
3.3. The O3N3 index
One of the main IR diagnostics to measure the metallicity of galaxies is based on the ratio of the [Oiii]52, 88μm to [Niii]57μm lines. These are two key elements in the gas chemistry: oxygen is an alpha-capture primary element produced by massive stars, whereas nitrogen behaves as both a primary and a secondary nucleosynthetic element. As a result, the N/O relative abundance shows a dependence with the star-formation history of the galaxy, and the subsequent global metallicity (Liang et al. Reference Liang, Yin, Hammer, Deng, Flores and Zhang2006; Pilyugin, Grebel, & Kniazev Reference Pilyugin, Grebel and Kniazev2014; Vincenzo et al. Reference Vincenzo, Belfiore, Maiolino, Matteucci and Ventura2016), which could be determined by SPICA (Nagao et al. Reference Nagao, Maiolino, Marconi and Matsuhara2011; Pereira-Santaella et al. Reference Pereira-Santaella, Rigopoulou, Farrah, Lebouteiller and Li2017). O and N have similar ionisation potentials for their first five ionisation stages and, thus, both have very similar ionisation structures almost independent of the ionisation parameter and hardness of the radiation field. Therefore, although ratios of [Oiii] to [Niii] lines only trace the relative abundance of O2+ to N2+, this ratio serves as a very good proxy for the global N/O abundance ratio (see Pérez-Montero & Contini Reference Pérez-Montero and Contini2009 for a calibration using the optical [Nii]λ6584/[Oii]λ3727 line ratio. The [Oiii] lines at 52 and 88μm, whose ratio can be used as a density tracer for the ionised gas in the ~102–103cm−3 range, are combined to produce a tracer for the gas metallicity with a weak dependency on the density. This tracer is based on the ratio of (2.2 ×[Oiii]88μm + [Oiii]52μm) to [Niii]57μm (hereafter the O3N3 index), as shown by the top panel in Figure 3, it can be applied to both starburst galaxies and AGN, almost unaffected by the temperature, the extinction, the density, and the hardness of the radiation field (for further details, see Pereira-Santaella et al. Reference Pereira-Santaella, Rigopoulou, Farrah, Lebouteiller and Li2017).
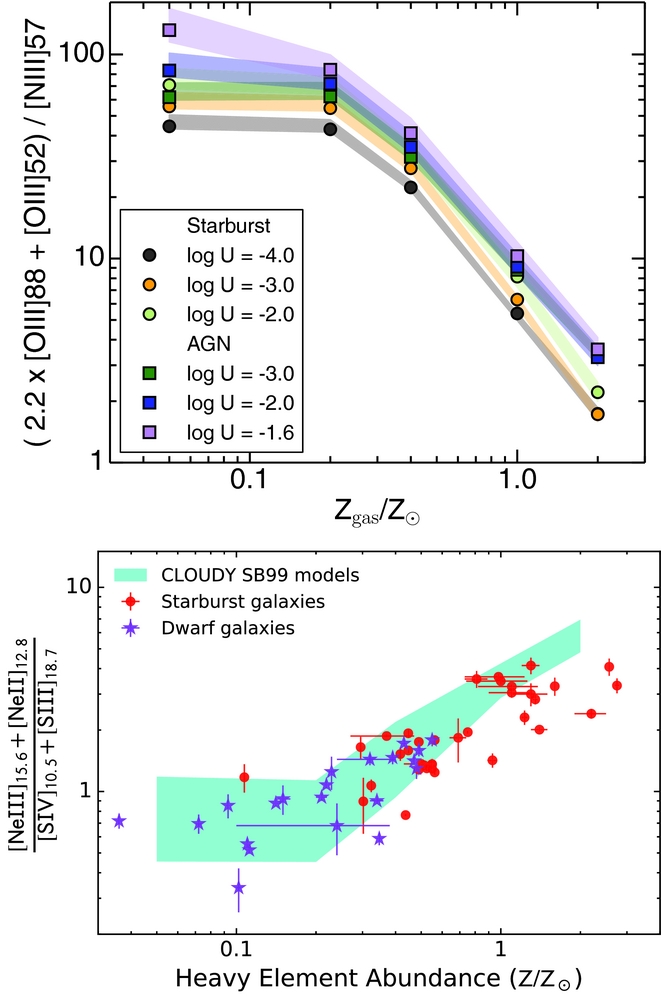
Figure 3. Top: AGN and starburst models for the metallicity sensitive (2.2 ×[Oiii]88μm+[Oiii]52μm)/[Niii]57μm line ratio as a function of the gas-phase metallicity. For each metallicity bin, those models with the same ionisation parameter but different densities are grouped and their median ratio is indicated by a circle (square) for the starburst (AGN) models. The shaded area represents the scatter due to the gas density dependence of this ratio for a given ionisation parameter. Figure from Pereira-Santaella et al. (Reference Pereira-Santaella, Rigopoulou, Farrah, Lebouteiller and Li2017). Bottom: the ([Neii]12.8μm + [Neiii]15.6μm) to ([Siii]18.7μm + [Siv]10.5μm) line ratio (i.e. the Ne23S34 index) from Spitzer/IRS observations of starburst galaxies in the Local Universe vs. indirect gas-phase metallicity determined from strong optical lines (Moustakas et al. Reference Moustakas, Kennicutt, Tremonti, Dale, Smith and Calzetti2010; Pilyugin et al. Reference Pilyugin, Grebel and Kniazev2014). The Cloudy simulations including sulphur stagnation above Z > 1/5Z⊙ are in agreement with the observed increase of the line ratio with increasing metallicity for Z ≳ 0.2Z⊙ (figure adapted from Fernández-Ontiveros et al. Reference Fernández-Ontiveros, Spinoglio, Pereira-Santaella, Malkan, Andreani and Dasyra2016). Below ≲ 0.2Z⊙, direct abundances can be estimated using, e.g. the ratio of [Arii]6.99μm and [Ariii]8.99μm to the Pfund-α line for galaxies at 1.5 < z ≲ 3 (see Section 3.2).
Gas metallicities can be determined using the diagnostic shown in Figure 3 up to z ~ 1.6, where the [Oiii]88μm line would still fall within the spectral range of SAFARI (34–230μm). A diagnostic based on the [Oiii]52μm/[Niii]57μm ratio (see Nagao et al. Reference Nagao, Maiolino, Marconi and Matsuhara2011) is also a metallicity tracer up to z ~ 3 if the density is constrained through other line ratios, e.g. from the [Siii]18.7, 33.5μm or the [Neiii]15.6, 36.0μm lines. As shown in Figure 2, a telescope like SPICA would be sensitive enough to detect these lines in a few hours of observing time in typical starburst galaxies and AGN with luminosities close to the knee of the luminosity function at z ~ 3.
3.4. The Ne23S34 index
Above z ≳ 0.15 and 0.7, the [Siv]10.5μm line would enter in the SMI/HR and MR ranges, respectively, enabling an additional indirect abundance diagnostic—based on the calibration of metallicity-sensitive line ratios—using the ([Neii]12.8μm + [Neiii]15.6μm) to ([Siii]18.7μm + [Siv]10.5μm) line ratio (hereafter the Ne23S34 index; lower panel in Figure 3; see Fernández-Ontiveros et al. Reference Fernández-Ontiveros, Spinoglio, Pereira-Santaella, Malkan, Andreani and Dasyra2016 for further details). The chemical species of Ne+ and Ne2+ on one hand, and S2+ and S3+ on the other, are the most important stages of ionisation for neon and sulphur, respectively, in starburst galaxies and AGN. However, the stagnation of the sulphur abundance, possibly caused by depletion of sulphur onto dust grains (Verma et al. Reference Verma, Lutz, Sturm, Sternberg, Genzel and Vacca2003; Dors et al. Reference Dors, Pérez-Montero, Hägele, Cardaci and Krabbe2016; Vidal et al. Reference Vidal, Loison, Jaziri, Ruaud, Gratier and Wakelam2017), prevent the rise of the sulphur line intensities with increasing metallicity. Thus, the total [Siv]10.5μm + [Siii]18.7μm remains almost constant, while the [Neiii]15.6μm + [Neii]12.8μm increases with the neon abundance, which is not depleted onto dust grains.
The bottom panel in Figure 3 shows a calibration of this metallicity sensitive ratio obtained from Spitzer/IRS spectra in the high-resolution mode (R ~ 600) vs. gas-metallicities obtained from indirect optical tracers for a sample of unobscured local starburst and dwarf galaxies (Moustakas et al. Reference Moustakas, Kennicutt, Tremonti, Dale, Smith and Calzetti2010, Pilyugin et al. Reference Pilyugin, Grebel and Kniazev2014). The blue shaded area corresponds to photoionisation models obtained with Cloudy simulations (Ferland et al. Reference Ferland2017) for a starburst galaxy, assuming a constant sulphur abundance above Z = 0.2Z⊙, while the neon abundance increases linearly with the overall gas metallicity (see Fernández-Ontiveros et al. Reference Fernández-Ontiveros, Spinoglio, Pereira-Santaella, Malkan, Andreani and Dasyra2016 for a full description of these models). Both the theoretical predictions and the measurements of unobscured starburst and dwarf galaxies are in agreement, since the trend shown by the models with sulphur abundance stagnation reproduces the behaviour of the observed line ratios. Since [Neiii] and [Neii] are the most important stages of ionisation, the neon abundances determined with this method will be almost independent of ionisation correction factors.
All the lines used in this diagnostic would be covered by SMI and SAFARI for galaxies at 0.15 < z < 3. The weakest line in starburst galaxies with solar metallicities is [Siv]10.5μm (left panel in Figure 2), although it is expected to become stronger with decreasing metallicity, as shown by the mid-IR spectra of low-metallicity dwarf galaxies in the Local Universe (e.g. Madden et al. Reference Madden, Galliano, Jones and Sauvage2006, Cormier et al. Reference Cormier2015). Therefore, high-z galaxies with sub-solar metallicities are expected to show stronger [Siv]10.5μm relative to other mid-IR fine-structure lines when compared to the spectrum of the starburst galaxy in Figure 2. A different depletion pattern as that implied by Figure 3 is not expected at high-z, since the range of metallicities probed by this diagram covers the range of values expected for galaxies at z ≲ 4 (e.g. Davé et al. Reference Davé, Rafieferantsoa, Thompson and Hopkins2017). Still, this scenario could be explored using observations of the dust spectral features in the mid- to far-IR spectra of galaxies at high-z (see Section 4.3). At very low metallicities, studies based on galaxies in the Local Universe predict a constant N/O abundance ratio due to the primary origin of nitrogen in massive stars (van Zee, Salzer, & Haynes Reference van Zee, Salzer and Haynes1998), while sulphur does not show a significant abundance stagnation (Dors et al. Reference Dors, Pérez-Montero, Hägele, Cardaci and Krabbe2016). Thus, both indirect tracers O3N3 and Ne23S34 show a flat behaviour below ≲ 0.2Z⊙ in Figure 3. SPICA would be able to probe if this scenario holds at high-z. For instance, enhanced N/O abundances have been reported at z ~ 2 with regard to those of Local galaxies at similar gas-phase metallicities, possibly due to the high specific SFR at high-z (see discussion in Masters et al. Reference Masters2014; Masters, Faisst, & Capak Reference Masters, Faisst and Capak2016). On the other hand, direct abundance estimates for several ionic species can be obtained for neon, sulphur, oxygen, nitrogen, iron, and carbon below 0.2Z⊙ in galaxies at 1.5 < z ≲ 3, from ratios of the mid- and far-IR fine-structure lines of these elements to the Pfund-α line, covered by SMI/MR and SAFARI/LR (see Section 3.2; Figure 2).
4 SPICA AND THE BUILD-UP OF METALS AND DUST
We discuss here the role that SPICA would play to address the science topics described in Section 2—i.e. the assembly of galaxies, the evolution of metallicity in galaxies, and the buil-up of cosmic dust—using the tracers for heavy element abundances and dust composition described in Section 3.
4.1. The assembly of galaxies
The potential of an observatory like SPICA to provide high-sensitivity IR spectral mapping of galaxies in the Local Universe, able to peer into their most obscured regions, would play an essential role to understand how galaxies were assembled. In the low-resolution mode, SPICA would be an extremely efficient mapping machine, reaching line luminosity noise levels of a few 10−19Wm−2 over a square arcmin in less than a minute of observing time and over the entire wavelength range. Moreover, the 2.5m mirror of SPICA would provide a diffraction-limited angular resolution of ~2 to 32 arcsec in the 20–350μm range, which corresponds to 100pc–1.5kpc at 10Mpc, respectively. For example, this angular resolution would be sufficient to resolve individual molecular clouds throughout galaxies in the Local Group (Milky Way, M31, M33, IC10, LMC, NGC 6822, SMC, and WLM, in order of decreasing metallicity). Metallicity determinations based on the O3N3 index could be obtained at ~7 arcsec resolution (~ 0.3kpc at 10Mpc), i.e. a fraction of about 1/100 of the diameter for a galaxy located at 10Mpc with the size of the Milky Way. SPICA would be able to map a typical nearby spiral galaxy (~ 25arcmin2) with both SMI and SAFARI at medium to high-spectral resolution in about ~20 h (see van der Tak et al. Reference van der Tak2017).
The sensitivity and efficiency of an observatory like SPICA would allow us to quickly map large areas of nearby objects at the diffraction limit of the 2.5-m mirror above ≳ 20μm. For instance, when compared with the Herschel/PACS spectral maps for NGC 891 (at 9.6Mpc Hughes et al. Reference Hughes2015), SPICA would provide (i) about 100 times better sensitivity, thus revealing the outer galaxy regions with lower surface brightness (~ 10−11Wm−2sr−1, 5σ, 1h. compared to ~ 5 × 10⁻⁹Wm−2sr−1 for the [Oiii]88μm line with PACS); (ii) better spatial sampling (~ 0.5kpc/pixel in PACS); and (iii) with a much larger efficiency to cover the full extension of NGC 891 (~ 7.7arcmin2) for the whole 12–230μm spectral range in about 8h. PACS measured small spectral windows centred on the [Oi]63, 145μm, [Oiii]88μm, [Nii]122μm, and [Cii]158μm lines, covering half of this galaxy in a total of ~12 h.
These capabilities would allow SPICA to trace the spatial distribution of heavy elements in ISM of nearby galaxies. The metal budget at different radii would be compared to the stellar metallicities, which can be derived from optical and near-IR spectroscopic studies (e.g. Coccato et al. Reference Coccato, Morelli, Pizzella, Corsini, Buson and Dalla Bontà2013; Belfiore, Maiolino, & Bothwell Reference Belfiore, Maiolino and Bothwell2016), and chemical evolution models. This approach would allow to estimate the average outflow loading factors over the galaxies lifetime—i.e. the ratio between the star formation and the mass outflow rates—which is an essential step to constrain the episodes of matter cycling, and ultimately to understand how nearby galaxies were assembled (see Belfiore et al. Reference Belfiore, Maiolino and Bothwell2016; González-Alfonso et al. Reference González-Alfonso2017). Therefore, a detailed study of the spatial distribution of heavy element abundances in nearby galaxies would be a unique probe of the past history in the evolution of these galaxies.
4.2. The evolution of metallicity in galaxies
SPICA would be able to trace the global content of metals in galaxies from z ~ 3 till the present time. To accomplish this, future studies based on SPICA observations would dispose of heavy element abundances for galaxies up to z ~ 3, obtained from tracers with a feeble response to both extinction and temperature; e.g. using direct measurements of the main ionic species based on ratios of IR fine-structure lines to Pfund-α or Huα and ionisation correction factors (see Section 3.2; Figure 2); and/or indirect methods based on ratios of strong IR fine-structure lines such as those involved in the O3N3 and the Ne23S34 indices (Sections 3.3 and 3.4, respectively; Figure 3). A spectroscopic survey designed to observe thousands of galaxies at z < 3—e.g. covering a wide range in luminosity, galaxy type—would allow to obtain a statistically valid assessment of the metallicity evolution in galaxies. SPICA would be able to accomplish such a survey in ~4000 h of observing time.
Once the metallicities are measured using IR tracers, a global view of the baryon cycle could be derived by including the two remaining ingredients, i.e. the stellar mass and the total gas content of these galaxies. The latter would rely mainly on future and present facilities. For instance, the stellar mass can be obtained from near- and mid-IR photometric surveys available nowadays (e.g. with AKARI, Ishihara et al. Reference Ishihara2010; WISE, Wright et al. Reference Wright2010; Spitzer, Ashby et al. Reference Ashby2013), plus future catalogues assembled by the extremely large telescopes (ELTs)—the European-ELTFootnote 3 , the Thirty Meter Telescope (Sanders Reference Sanders2013), and the Giant Magellan Telescope (Shectman & Johns Reference Shectman, Johns, Stepp, Gilmozzi and Hall2010), Euclid (Maciaszek et al. Reference Maciaszek, MacEwen, Fazio, Lystrup, Batalha, Siegler and Tong2016), the Wide Field Infrared Survey Telescope (WFIRST; Spergel et al. Reference Spergel2013), and available James Webb Space Telescope (JWST; Gardner et al. Reference Gardner2006) observations at the time. On the other hand, the molecular gas content can be derived from follow-up observations of these sources with the Atacama Large Millimeter/submillimeter Array (ALMA; Wootten & Thompson Reference Wootten and Thompson2009) and the NOrthern Extended Millimeter Array (NOEMAFootnote 4 ) in the CO and [Ci]371, 609μm transitions, assuming a conversion factorFootnote 5 from CO or Ci to H2 (e.g. Papadopoulos & Greve Reference Papadopoulos and Greve2004). Alternatively, a proxy for the molecular gas content could be inferred from the SPICA spectra using IR transitions sensitive to the SFR such as the neon lines (Ho & Keto Reference Ho and Keto2007), or from the modelling of the 24–60μm rest-frame continuum which is also sensitive to the SFR (Ciesla et al. Reference Ciesla2014; van der Tak et al. Reference van der Tak2017). To remove the possible AGN contamination, the relative AGN/starburst contribution could be derived from the ratio of [Oiv]25.9μm to either [Oiii]52, 88μm or the total [Neii]12.8μm + [Neiii]15.6μm (Spinoglio et al. Reference Spinoglio, Pereira-Santaella, Dasyra, Calzoletti, Malkan, Tommasin and Busquet2015; Fernández-Ontiveros et al. Reference Fernández-Ontiveros, Spinoglio, Pereira-Santaella, Malkan, Andreani and Dasyra2016). Finally, the atomic gas content could be estimated from observations in the Hi line, e.g. using the Square Kilometer Array (SKA; Dewdney et al. Reference Dewdney, Hall, Schilizzi and Lazio2009), which will be already operational by the mid-2020s, though fully developed at the end of the decade.
4.3. The build-up of cosmic dust
The unique sensitivity of a cryogenic telescope with the characteristics of SPICA would enable the study of the dust composition based on several spectral features in the mid- to far-IR range (Section 3.1; van der Tak et al. Reference van der Tak2017), largely improving the work based on Spitzer and Herschel spectroscopic observations (e.g. Spoon et al. Reference Spoon2006; Matsuura et al. Reference Matsuura2015). A whole new suite of solid-state features can be used to investigate the main sources of dust in the ISM of galaxies at high-z. Among the different sources that contribute to the dust reservoir in galaxies one can find: evolved stars, producing crystalline silicates (Molster et al. Reference Molster1999; Molster, Waters, & Tielens Reference Molster, Waters and Tielens2002), dolomite and calcite (Kemper et al. Reference Kemper, Jäger, Waters, Henning, Molster, Barlow, Lim and de Koter2002), and complex carbon molecules such as C60 and C70 (Cami et al. Reference Cami, Bernard-Salas, Peeters and Malek2010); post-AGB stars show a rich IR spectrum, as shown by Matsuura et al. (Reference Matsuura2014), with features at 15.8 and 21μm (associated with PAHs), and 30μm (ascribed to MgS); supernovae remnants (SNR) may also be a significant source of dust at high-z, e.g. Cassiopeia A shows a prominent 21μm feature associated with FeO and possibly SiO2 (Rho et al. Reference Rho2008).
In nearby galaxies, medium and high-resolution spectroscopy with SMI and SAFARI would be able to resolve the emission of SNR from the surrounding ISM at ~ 1Mpc (assuming a SNR size of ~ 60pc; Elwood, Murphy, & Diaz Reference Elwood, Murphy and Diaz2017) and investigate the properties and composition of the surviving dust after the pass of the reverse shock. Only far-IR follow-up observations of SNR in the Local Universe can probe the dust composition and size distribution produced by these sources. Specifically, future observations of SN 1987A would be of particular interest to constrain current models of dust condensation efficiency after the passage of the reverse shock. A detailed discussion on the role of SPICA in the study of dust properties in nearby galaxies can be found in the companion paper by van der Tak et al. (Reference van der Tak2017).
Focusing on studies at high-z, a cryogenic IR observatory like SPICA would be sensitive enough to distinguish among different shapes in the rest-frame mid-IR spectrum of galaxies associated with differences in the chemical composition of dust. The predicted shape of the mid- to far-IR spectra for three quasars with different dust compositions, from the results of Xie et al. (Reference Xie, Li and Hao2017), are shown in Figure 4 scaled to a luminosity of 2 × 10¹²L⊙. The dust composition determines the central wavelength, width, and relative intensity of the two silicate bands at 9.7 and 18μm. Thus, a detailed modelling of the continuum emission and the dust emission and absorption features in this range is able to probe the dust composition (e.g. Spoon et al. Reference Spoon2006). The quasar spectra shown in Figure 4 are dominated by astronomical silicate (PG 1004+130, in red), amorphous olivine (PG 1351+640, in yellow), and amorphous pyroxene (PG 2214+139, in pink). Therefore, the access to dust features in the rest-frame mid- to far-IR range with SPICA would allow us to explore, for the first time, the composition of dust in galaxies at the peak of the star formation and SMBH accretion activity (1 < z < 3). At farther distances, z ≳ 4, very little is known on the dust produced by metal-free SNe (Nozawa et al. Reference Nozawa, Kozasa, Umeda, Maeda and Nomoto2003; Schneider, Ferrara, & Salvaterra Reference Schneider, Ferrara and Salvaterra2004), which could be investigated through mid-IR bands such as those produced by magnetite (Fe3O4), as discussed in a forthcoming study by Egami et al. (in preparation).
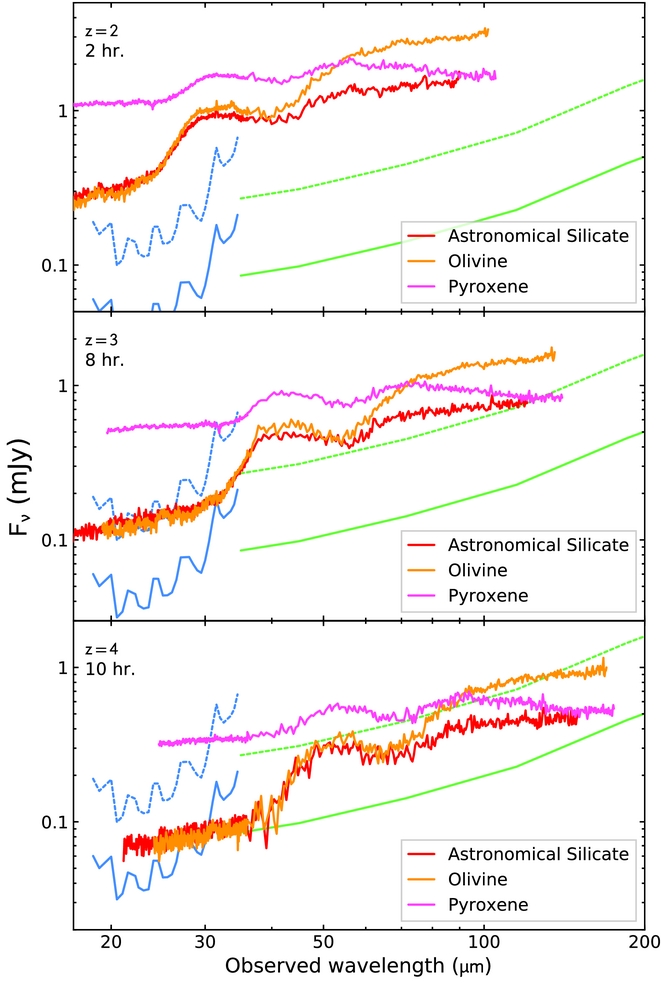
Figure 4. Differences in the Spitzer/IRS spectrum of three quasars associated to different silicate compositions (see Xie, Li, & Hao Reference Xie, Li and Hao2017): PG 1004+130 (astronomical silicate, in red colour), PG 1351+640 (amorphous olivine, in yellow), and PG 2214+139 (amorphous pyroxene, in pink). In this simulation, the spectra have been scaled to a luminosity of 1012L⊙, and located at z = 2 (top panel, 2 h of integration time), z = 3 (central panel, 8 h), and z = 4 (bottom panel). The SPICA 5σ sensitivities for SMI/MR (in blue) and SAFARI/LR (in green) are indicated for integration times of 1 h (dotted lines) and 10 h (solid lines).
Finally, other agents involved in the baryon cycle can have a strong influence in the dust content and composition. For instance, outflows originated by AGN and star-formation activity can remove dust from the ISM, while inflows from the halo and the IGM surrounding the galaxy can alter the dust content and composition (Ciesla et al. Reference Ciesla2015; González-Alfonso et al. Reference González-Alfonso2017). Only an IR observatory with the characteristics of SPICA could determine the impact of these processes in the ISM chemistry.
5 SYNERGIES WITH FUTURE FACILITIES
SPICA is planned for the late 2020s, during a lively period for multi-wavelength astronomy and galaxy evolution studies in particular. However, the observations that would be provided by SPICA are not accessible to any of the future generation of ground-based ELTs nor to JWST. These facilities will have access to the rest-frame optical and near-IR spectra of high-z galaxies (z ≳ 1) with a limited access to the mid-IR range (λ ≲ 7μm at z = 3). Therefore, the use of IR tracers based on JWST and ELTs observations will be restricted to galaxies in the Local and nearby (z < 0.5) Universe.
At the time SPICA will fly, the catalogues delivered by Euclid and WFIRST in the near-IR, by the Advanced Telescope for High ENergy Astrophysics (Athena+; Nandra et al. Reference Nandra2013) in the X-ray range, will be already available, containing a vast number of sources at 1 < z < 3. Together with the galaxies that would be eventually discovered by a spectrophotometric survey with SMI in the mid-IR (see Gruppioni et al. Reference Gruppioni2017), these catalogues would be useful to define a sample of galaxies to study the chemical evolution over cosmic time. This sample would be observed with mid- to high-resolution spectroscopy using SMI and SAFARI. From these catalogues, SPICA would be able to identify candidates to perform follow-up spectroscopic observations in the mid- to far-IR rest-frame range with medium resolution (R ≳ 300) SAFARI and SMI. These observations could be the basis for the study of the chemical evolution of galaxies (see Section 4.2). Of particular interest in this field are the synergies of SMI and SAFARI spectroscopy with the Mid-InfraRed Instrument (MIRI) on-board JWST. The latter could provide abundance determinations for the main ionic species of several elements (see Section 3.1) in galaxies at 1 < z ≲ 3 based on the combination of Brα (4.051μm in the rest-frame), Paα (1.875μm), and Paβ (1.282μm) with JWST and the fine-structure lines of the chemical species in the mid- to far-IR range provided by SPICA. On the other hand, far-IR lines such as [Nii]57μm and [Niii]122μm would provide an abundance estimate for the main ionisation stages of nitrogen, when coupled with the hydrogen recombination lines in the near-IR provided by JWST.
The synergy between SPICA and Athena+ would allow us to address the problem of the ‘missing metals’ in galaxies at high-z. When compared to the estimates based on the cosmic star-formation history, current observations of galaxy populations at z ~ 2.5 are missing about half of the heavy element abundances expected (Bouché et al. Reference Bouché, Lehnert, Aguirre, Péroux and Bergeron2007; Gallazzi et al. Reference Gallazzi, Brinchmann, Charlot and White2008). SPICA would reveal the metal content of the dust-embedded star formation, which is missing in optically based abundance measurements (Santini et al. Reference Santini2010). Still, a large fraction of metals are possibly locked in the hot intracluster gas (Ferrara, Scannapieco, & Bergeron Reference Ferrara, Scannapieco and Bergeron2005; Davé & Oppenheimer Reference Davé and Oppenheimer2007), which is chemically enriched with the gas removed from galaxies by processes such as outflows—driven by star formation or AGN—or ram-pressure stripping. Athena+ will be able to measure the abundances and distribution of metals in clusters from the core to the boundary of the virial regions (Nandra et al. Reference Nandra2013). Furthermore, the study of the dust composition in galaxies using IR spectroscopy with SPICA could be complemented with the dust mineralogy obtained with Athena+ from the analysis of X-ray absorption edges produced by chemical elements trapped into dust grains (e.g. Lee & Ravel Reference Lee and Ravel2005; Hoffman & Draine Reference Hoffman and Draine2016; Palmeri et al. Reference Palmeri, Quinet, Mendoza, Bautista, Witthoeft and Kallman2016). Thus, the combination of these two observatories would provide an accurate measurement of the metal budget in galaxies and the ICM from z ~ 3 till the present time.
Additionally, chemical evolution models could be constrained by including the content of the molecular and neutral gas with the help of ALMA and SKA, respectively, as mentioned in Section 4.2. The latter will be of particular interest to understand the matter cycle and the build-up and evolution of the metallicity relations found from high-z galaxies to the Local Universe (see Section 2.2). On the other hand, the combined work of SPICA and ALMA could follow the highly successful synergy between Spitzer and Herschel at low-z to cover both sides of the dust thermal emission. These facilities would provide dust masses and temperatures for distant galaxies (see Gruppioni et al. Reference Gruppioni2017), as Herschel did on nearby galaxies and a few of the brighter galaxies at high-z (e.g. Magdis et al. Reference Magdis2012).
6 SUMMARY
One of the major challenges in astronomy for the next ~20 yrs is to understand the cycle of matter within galaxies and identify the physical mechanisms driving their evolution. This task can only be addressed from a multi-wavelength point of view, and thus will require the use of a sensitive IR spectroscopic observatory combined with the main observatories available in the next decades including JWST, the ELTs, Athena+, ALMA, NOEMA, SKA, but also the survey capabilities of, e.g. Euclid and WFIRST. The contribution of SPICA would be essential to study the chemical evolution of galaxies, which is one of the most important manifestations of the baryon cycle activity in galaxies. The past history of gas accretion, star formation, nuclear activity, and gas outflows leaves an imprint on the composition and content of heavy elements and dust in the ISM of galaxies. Thus, metals and dust are relics through which one can reconstruct the evolutionary path that galaxies have followed from their formation to the present time.
The 2.5-m actively cooled mirror of SPICA (< 8K) would reach a unique sensitivity allowing the observation of the whole suite of lines and dust features in the rest-frame mid- and far-IR range, from the faintest regions in nearby galaxies to the knee of the luminosity function at the peak of star formation and black hole accretion activity (1 < z < 3). SPICA would play a major role to unveil the dark side of galaxy evolution, since the bulk of star formation and black hole accretion can only be attained at long IR wavelengths (Spinoglio et al. Reference Spinoglio2017). While JWST will probe the external parts of high-z galaxies through rest-frame optical/UV spectra, and ALMA will study the cold gas reservoir, the contribution of SPICA would be essential to provide an insight into the warm gas in the dust-enshrouded regions of galaxies. No other facility with similar capabilities is currently planned. Therefore, rest-frame mid- to far-IR spectroscopy is essential to understand the physical processes at the engine of the matter cycle in galaxies.
Only a deep survey of spectroscopic observations with a sensitive IR observatory like SPICA would reveal the chemical enrichment process for galaxies in the last ~ 11Gyr. When combined with present and forthcoming first-line facilities in the decade of the 2020s, this spectroscopic survey would allow us to determine the evolutionary path followed by galaxies from the peak of star formation and SMBH accretion activity till the present time, and ultimately understand both the sequence of physical mechanisms involved in the matter cycle and how they drive the evolution of galaxies over cosmic time.
In this work, we evaluate the feasibility of the main observational strategies foreseen to derive heavy element abundances and trace the dust composition in galaxies accessible to SPICA, from high-z to the Local Universe. IR diagnostics offer a huge advantage over optical/UV line ratios, since IR line intensities show a feeble response to both extinction by dust and gas temperature. Under the light of these tools, we also explore the potential contribution of an observatory with the characteristics of SPICA to address some of the main questions in the field of galaxy evolution that will be unanswered in the late 2020s: how are galaxies assembled? How is the build-up of metals and dust? And how does the ISM composition evolve with redshift? The use of IR diagnostics applied to large spectroscopic samples would yield a unique view of the chemical evolution in galaxies, a key contribution to understand the picture provided by future studies based on JWST, ALMA, and ELTs observations in the 2020s.
ACKNOWLEDGEMENTS
This paper is dedicated to the memory of Bruce Swinyard, who initiated the SPICA project in Europe, but unfortunately died on 2015 May 22 at the age of 52. He was ISO-LWS calibration scientist, Herschel-SPIRE instrument scientist, first European PI of SPICA and first design lead of SAFARI.
The SAFARI Consortium and the full SPICA Team are acknowledged, without their work this mission project would not have been possible. J.A.F.O. acknowledges financial support from the Spanish Ministry of Economy and Competitiveness (MINECO) under grant number MEC-AYA2015-53753-P.


