


1 INTRODUCTION
The galaxy NGC 6744 (discovered in 1823; Dunlop Reference Dunlop1828) is thought to be one of the most Milky Way-like spiral galaxies in our immediate vicinity, with flocculent arms and an elongated core. NGC 6744 is classified as an intermediate spiral SAB(r)bc type galaxy and is located in the Pavo-Indus cloud (de Vaucouleurs Reference de Vaucouleurs1975). It sits in a star-rich field, hosts a central ring structure (de Vaucouleurs Reference de Vaucouleurs1963) and is inclined at 50° ± 4° (Ryder, Walsh, & Malin Reference Ryder, Walsh and Malin1999) to our line of sight. The only prominent companion of NGC 6744 is an irregular dwarf galaxy NGC 6744A (Ryder et al. Reference Ryder, Walsh and Malin1999) similar to the Milky Way’s companions, the Magellanic Clouds.
Tully et al. (Reference Tully2013) estimated a distance to NGC 6744 to be 9.2 ± 0.4 Mpc, using the ‘tip of the red giant branch’ (TRGB) method (see Lee, Freedman, & Madore Reference Lee, Freedman and Madore1993). To more easily compare our results with those of previous studies, we adopt the distance of 9.5 ± 0.6 Mpc to NGC 6744 as derived by Kankare et al. (Reference Kankare2014), so the apparent optical size of 20 arcmin×12.9 arcmin corresponds to 55 ×35 kpc.
Previous studies of NGC 6744 include an investigation of the H i disk (Ryder Reference Ryder1995; Ryder et al. Reference Ryder, Walsh and Malin1999), H ii regions in the optical range (λ = 3700–6800Å; Talent Reference Talent1982; Ryder Reference Ryder1995), and the galaxy’s optical shape and size (de Vaucouleurs Reference de Vaucouleurs1963). Hα based star-formation rate (SFR) indicators suggest a rate of 3.3–6.8 M⊙yr−1 (Botticella et al. Reference Botticella, Smartt, Kennicutt, Cappellaro, Sereno and Lee2012; Ryder & Dopita Reference Ryder and Dopita1994). An X-ray study by Fabbiano, Kim, & Trinchieri (Reference Fabbiano, Kim and Trinchieri1992) analysed an Einstein Imaging Proportional Counter image of NGC 6744 (see Figure 7) and identified weak emission.
NGC 6744 is an ideal target for studying the structure, composition, and evolutionary tracks of objects such as supernova remnants (SNRs) and H ii regions, and comparing them to their counterparts in the Milky Way. The NGC 6744 objects, though at various evolutionary phases, can be approximated to be at the same distance to us. This is not the case in the Milky Way where such distances often have large associated fractional errors. NGC 6744 is therefore a useful analogue to our own Galaxy when it comes to studying objects such as SNRs and H ii regions.
In 2005, the type Ic supernova SN2005at was discovered in NGC 6744 at optical wavebands by Martin et al. (Reference Martin, Yamaoka, Monard and Africa2005), classified by Schmidt & Salvo (Reference Schmidt and Salvo2005), and studied extensively by Kankare et al. (Reference Kankare2014). Co-discovery optical imagesFootnote 1 give a magnitude of 14.3, while Martin et al. (Reference Martin, Yamaoka, Monard and Africa2005) measured a magnitude of 16 at the discovery epoch (2005 March 15). Light curve fitting (Kankare et al. Reference Kankare2014) suggests that the magnitude would have peaked at mR ~14. The discovery of SN2005at prompted a wide range of multi-frequency observations towards NGC 6744, which allow us to study the galaxy in detail across the electromagnetic spectrum.
This paper is a continuation of our studies on nearby galaxies including the LMC (Hughes et al. Reference Hughes, Staveley-Smith, Kim, Wolleben and Filipović2007), SMC (Filipović et al. Reference Filipović, Payne, Reid, Danforth, Staveley-Smith, Jones and White2005; Wong et al. Reference Wong, Filipovic, Crawford, de Horta, Galvin, Draskovic and Payne2011a, Reference Wong2011b; Crawford et al. Reference Crawford, Filipovic, de Horta, Wong, Tothill, Draskovic, Collier and Galvin2011; Haberl et al. Reference Haberl2012; Wong et al. Reference Wong, Filipovic, Crawford, Tothill, De Horta and Galvin2012; Sturm et al. Reference Sturm2013a), NGC 300 (Payne et al. Reference Payne, Filipović, Pannuti, Jones, Duric, White and Carpano2004; Millar et al. Reference Millar, White, Filipović, Payne, Crawford, Pannuti and Staggs2011; Galvin et al. Reference Galvin2012b; Millar, White, & Filipovic Reference Millar, White and Filipovic2012), NGC 55 (O’Brien et al. Reference O’Brien2013), M 31 (Galvin et al. Reference Galvin, Filipovic, Crawford, Tothill, Wong and De Horta2012a; Galvin & Filipovic Reference Galvin and Filipovic2014), NGC 7793 (Pannuti et al. Reference Pannuti, Schlegel, Filipović, Payne, Petre, Harrus, Staggs and Lacey2011; Dopita et al. Reference Dopita, Payne, Filipović and Pannuti2012; Galvin et al. Reference Galvin2014), and NGC 45 (Pannuti et al. Reference Pannuti2015). We use archival X-ray data from the Chandra X-ray Observatory (Weisskopf et al. Reference Weisskopf, Tananbaum, Van Speybroeck, O’Dell, Truemper and Aschenbach2000) and infrared images obtained with the Wide-field Infrared Survey Explorer (WISE; Wright et al. Reference Wright2010). We examine all available archival radio-continuum observations carried out with the Australia Telescope Compact Array (ATCA; Frater, Brooks, & Whiteoak Reference Frater, Brooks and Whiteoak1992) and the Murchison Widefield Array (MWA; Tingay et al. Reference Tingay2013). We combine archived ATCA data to create new images with high angular resolution and excellent sensitivity. In Section 2, we describe the observational data and reduction techniques. In Section 3, we present our results and discussion and in Section 4, we summarise our findings.
2 OBSERVATIONAL DATA
2.1. X-ray data
The X-ray data were obtained by the Chandra X-ray Observatory Advanced CCD Imaging Spectrometer (ACIS; PI: Garmire et al. Reference Garmire, Bautz, Ford, Nousek, Ricker, Truemper and Tananbaum2003, observation ID 15384) on 2014 May 5 with an effective exposure time 52.79 ks. The Chandra data cover only a fraction of NGC 6744’s optical extent (see Figure 1); the 20 arcmin major axis of NGC 6744 exceeds the 16 arcmin ACIS-I field of view.

Figure 1. Five ACIS-I CCD chip footprints overlaid on the optical DSS2 image of NGC 6744. The 6th CCD was omitted because of instrument noise. The left image shows X-ray broad-band detected sources in yellow and the right image shows a distribution of detected radio sources reported in this paper. The red cross represents the centre of NGC 6744, the aimpoint is the green square and the nominal aimpoint is the blue square in the centre of the image. North is up and east is to the left.
X-ray data reduction used the Chandra Interactive Analysis of Observations (CIAO; Fruscione et al. Reference Fruscione, Silve and Doxsey2006) version 4.8 package with CALDB version 4.7.2. Exposure-corrected images and exposure maps were created from events files using the task chandra_repro. Images in five energy bands were created using the fluximage task. There was no need for background flare filtering as the images had little background flaring. The five bands considered in this paper are the following: (1) broad band with energies 0.5–7.0 keV and effective energy 2.3 keV; (2) ultrasoft band with energies 0.2–0.5 keV and effective energy 0.4 keV; (3) soft band with energies 0.5–1.2 keV and effective energy 0.92 keV; (4) medium band with energies 1.2–2.0 keV and effective energy 1.56 keV; and (5) the hard band with energies 2.0–7.0 keV and effective energy 3.8 keV. As the characterisation of the ACIS response is not well defined below ~0.5 keV (Prigozhin et al. Reference Prigozhin, Rasmussen, Bautz, Ricker, Hoover and Walker1998), we have excluded the ultrasoft band from our analysis.
Using the task mkpsfmap, the exposure-corrected images were used to produce a point spread function (PSF) map that provides information on the PSF at each pixel in the image. The PSF map along with the exposure-corrected images were then fed through the wavdetect tool in CIAO to search for significant correlations with Mexican-hat wavelets of different scales. We found 117 sources using wavelet scales of 1.0, 2.0, 4.0, 8.0; in both the xscale and yscale and fluxscales of 1, 2, 3, 4 with a limiting statistical significance of 3σ. The great advantage of this technique was that it could separate closely-spaced point sources allowing the identification of many different sources in the field of view. Once the images were obtained, a catalogue was compiled and hardness ratios (HR) were calculated for each point source. This ratio can give an estimate of a source’s X-ray spectral energy distribution to see if it is dominated by thermal or non-thermal process. It is calculated as a normalised difference of the exposure-corrected integrated flux between two energy bands where E is the X-ray intensity:
 $$\begin{equation}
H\!R_1& =& \frac{E_{\mathrm{Med}}-E_{\mathrm{Soft}}}{E_{\mathrm{Med}}+E_{\mathrm{Soft}}}, \\
\end{equation}$$
$$\begin{equation}
H\!R_1& =& \frac{E_{\mathrm{Med}}-E_{\mathrm{Soft}}}{E_{\mathrm{Med}}+E_{\mathrm{Soft}}}, \\
\end{equation}$$
 $$\begin{equation}
H\!R_2& =& \frac{E_{\mathrm{Hard}}-E_{\mathrm{Med}}}{E_{\mathrm{Hard}}+E_{\mathrm{Med}}}.
\end{equation}$$
$$\begin{equation}
H\!R_2& =& \frac{E_{\mathrm{Hard}}-E_{\mathrm{Med}}}{E_{\mathrm{Hard}}+E_{\mathrm{Med}}}.
\end{equation}$$
We calculated two hardness ratios (HR 1 and HR 2), between medium and soft bands and between hard and medium bands, respectively. Broad-band fluxes were estimated using a power law model with a photon index Γ = 1.7 and column density N H of 0.061× 10²²atomscm−2 (via Fabbiano et al. Reference Fabbiano, Kim and Trinchieri1992) to convert count rates to fluxes using Sherpa (Freeman, Doe, & Siemiginowska Reference Freeman, Doe, Siemiginowska, Starck and Murtagh2001). For the remaining three bands; soft, medium and hard, the flux was estimated from flux-corrected images. Although the HRs are reliable, the absolute fluxes are not.
2.2. Radio data
The λ = 20, 13, 6, and 3 cm (ν = 1.4, 2.1, 5, and 9 GHz) radio data were obtained from the Australia Telescope Online Archive (ATOA).Footnote 2 We used all available ATOA radio-continuum observations of NGC 6744 (for details, see Table 1).
Table 1. ATCA data used in this project, identified by original project ID.
Each row lists a separate image/data (or combinations of data from different project IDs), its frequency, bandwidth (BW), array, observing date, synthesised beam, and root mean square (r.m.s) values (1σ). All images were created with a robust (natural) weighting of 2.
Two of the seven selected ATCA projects, C184 and C892, were found to have poor (u, v) coverage, resulting in poor images, even after combining compatible projects and implementing joint deconvolution; these data were discarded. The five remaining projects consist of one (C2697) Compact Array Broadband Backend (CABB; Wilson et al. Reference Wilson2011) observation and four pre-CABB observations (CX082, C514, C287, and C389). Projects C514 and C287 are made up of numerous pointings, whereas the others are single pointing observations. The projects obtained from the ATCA pre-CABB epoch have central frequencies of 1.38, 2.37, 4.79, and 8.64 GHz, and bandwidth of 128 MHz with 32 channels each. The 2.1 GHz CABB data-set have 2 GHz bandwidth, resulting in significantly better sensitivity. The (u, v) data for each frequency band and epoch are automatically flagged for outliers using the pgflag (Offringa et al. Reference Offringa, de Bruyn, Biehl, Zaroubi, Bernardi and Pandey2010) task and calibrated using standard calibration procedures in the MIRIAD (Sault, Teuben, & Wright Reference Sault, Teuben, Wright, Shaw, Payne and Hayes1995) package. The missing short spacings from all these ATCA radio images impair detection of large scale structure in the galaxy.Footnote 3
A natural weighting scheme is used to produce an image with the lowest root mean square (r.m.s.), while sacrificing angular resolution. A second set of images is also created with a robust parameter of −2, corresponding to uniform weighting. However, the higher angular resolution still does not resolve many sources and therefore gives very little additional morphological information. As suggested by Filipovic et al. (Reference Filipovic, Haynes, White and Jones1998), variable sources could exhibit different flux densities at different epochs (as well as at different frequencies) and therefore could lead to misleading spectral index estimates. Based on a number of radio catalogues that we produced in other nearby galaxies, we expect that not many of our sources may be affected by this process.
For the projects C514/C389 and CX082/C287 with numerous pointings, joint deconvolution was implemented using the MIRIAD clean task. Images were made individually for each project to ensure adequate flagging and calibration. Then for data-sets with the same frequency, joint deconvolution was implemented to combine images. Images from the pre-CABB projects are also made without the sixth antenna as they had a sparse (u, v) coverage. The details for the resulting images from these data-sets are provided at the bottom part of Table 1.
2.2.1. SN2005at in ATCA radio images
Kankare et al. (Reference Kankare2014) reported detecting SN2005at at ~9σ in their radio observations (ATCA project CX082, observed 2005 March 30 for ~2 h) at 1.38 and 2.37 GHz, with four active antennae yielding six baselines. We reconstruct images from these particular observations, obtained from the ATOA archive, following Kankare et al. (Reference Kankare2014). We use the same four antennas (CA01, CA02, CA05, and CA06) with a robust parameter of 1.5. The reconstructed images are of poor quality due to a lack of (u, v) coverage and have a similar noise level (0.15–0.17 mJy beam−1) as in Kankare et al. (Reference Kankare2014). Although the peak flux density estimated from our images at the location of SN2005at is slightly above 5σ (0.826 mJy beam−1) at 1.38 GHz (but 3.9σ, 0.658 mJy beam−1 at 2.37 GHz), we have little confidence in the detection of SN2005at due to the very poor image quality where a lot of the sidelobe and artefact patterns are obvious. This source does not appear in our other images. Also, we did combine the data from CX082 with C287 that was observed several years before the SN event, and this could cause any detection in CX082 to be averaged down below the noise level. We do not use the CX082 observations (alone) any further in this study.
The radio brightness of SNe such as SN2005at (type Ic; stripped envelope SNe) would be expected to increase only in the first few hundred days since its discovery (Romero-Cañizales et al. Reference Romero-Cañizales2014). However, while somewhat untypical and different to SN2005at, SN1987A (Ng et al. Reference Ng, Zanardo, Potter, Staveley-Smith, Gaensler, Manchester and Tzioumis2013) or the very young SNR G1.9+1.3 (De Horta et al. Reference De Horta2014) are still increasing its radio flux density. In subsequent, more sensitive ATCA-CABB observations, SN2005at was not detected.
2.2.2. GLEAM data
We also examine radio continuum data from the Galactic and Extragalactic All-Sky Murchison Widefield Array (GLEAM; Tingay et al. Reference Tingay2013; Wayth et al. Reference Wayth2015) in our analysis. The GLEAM survey provides low-frequency (72–231 MHz) low angular resolution (5 –1.7 arcmin) radio images with excellent surface brightness and large-angular-scale sensitivity.Footnote 4 Here, we use Extragalactic GLEAM Catalogue imagesFootnote 5 (EGC; Hurley-Walker et al. Reference Hurley-Walker2017) at four frequency bands, of which three have 30 MHz bandwidth and are centred on 88, 118, and 154 MHz, and one has 60 MHz bandwidth centred on 200 MHz (see Figure 2). The r.m.s. noise levels of the images are: 19 mJy beam−1 at 200 MHz, 24 mJy beam−1 at 154 MHz, 26 mJy beam−1 at 118 MHz, and 57 mJy beam−1 at 88 MHz. The details of calibration and imaging procedure of the GLEAM data are described in Hurley-Walker et al. (Reference Hurley-Walker2017).

Figure 2. WISE RGB bands W4+W2+W1 image overlaid with MWA 200 MHz image contours. The MWA contours (white) are 4–10σ with spacings of 1σ and the 200 MHz beam is shown in the lower left.
2.3. Infrared data
The WISE telescope surveyed the entire sky at wavelengths of 3.4, 4.6, 12, and 22 μm (WISE bands W1–W4, respectively; Wright et al. Reference Wright2010; Jarrett et al. Reference Jarrett2017), in which the photometric bands were chosen to be sensitive to both stellar light and interstellar medium processes (Jarrett et al. Reference Jarrett2011). The near-IR bands W1 and W2, tracing the evolved stellar population, have been used to measure the underlying stellar mass. The mid-IR molecular-PAH emission W3 band and warm-dust W4 band have been used to measure star-formation (SF) activity. The mosaic images presented here are produced using the icore software package (Masci Reference Masci2013) that resamples the stack of raw, single-frame images to 1 arcsec pixels. This is done by using a ‘drizzle’ technique, achieving native resolutions of 5.9, 6.5, 7.0, and 12.4 arcsec at 3.4, 4.6, 12, and 22 μm, respectively. This represents a ~30% improvement from the public release ‘Atlas’ images that are smoothed for optimal point source detection (Jarrett et al. Reference Jarrett2012).
Native-resolution mosaic images of NGC 6744 in W1–W4 are shown in Figures 3 and 4, where the colour image represents a RGB-combined W3, W2, and W1 multi-λ window. The evolved stellar population is notably seen in the nucleus and bulge regions (appearing blue/cyan in colour), while the SF regions are concentrated in the arms (appearing orange/red in colour). At the distance of NGC 6744, the physical pixel scale is 46 pc, while the resolved scale is about 270 pc, which is larger than giant molecular clouds, but clearly portraying the SF complexes where the gas is concentrated.
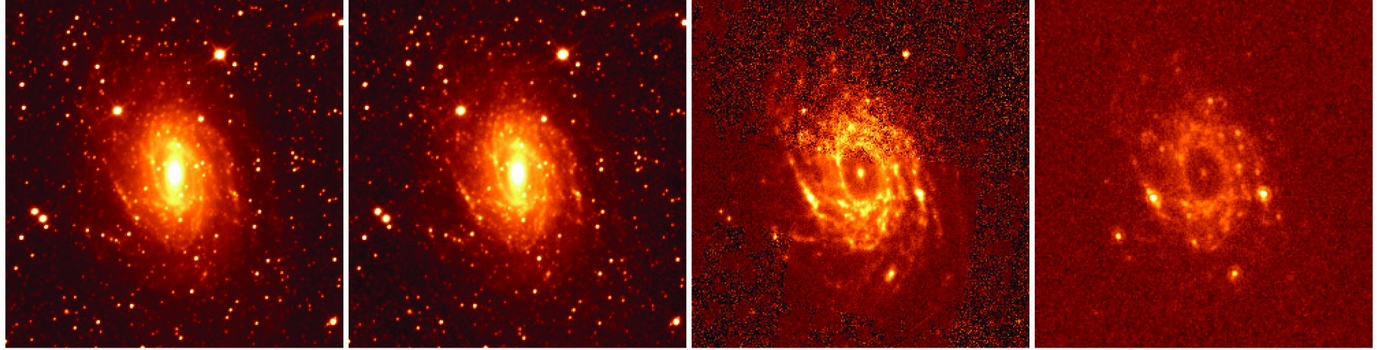
Figure 3. WISE imaging of NGC 6744. The panels show the four bands of WISE (left to right: W1, W2, W3, and W4). Each panel has an angular size of 16.6 arcmin.

Figure 4. WISE 3-colour (W1+W2+W3) image of NGC 6744. Left panel shows the images before star subtraction, and the right panel after. The ellipse represents the W1 isophote at the 1σ noise level, and has a diameter of 18.3 arcmin (where 1 arcsec is 46 pc; 1 arcmin is 2.76 kpc).
3 RESULTS AND DISCUSSION
3.1. Discrete sources in NGC 6744
3.1.1. X-ray sources
We detect a total of 117 sources across all four X-ray bands (see Table 2).Footnote 6 We estimate the minimum detectable flux of the X-ray sources to be 8.23× 10⁻¹⁶ ergs s−1 cm−2 using the broad X-ray band, and the luminosity to be 8.89× 1036 ergs s−1.
Table 2. X-ray source catalogue sample.
The luminosity estimates are accurate to ~30%. The count rate in Column 8 corresponds to the broad band. For sources with two intensity values (excluding broad band), we invoked upper limits on the soft, medium, and hard bands (6.070, 3.200, and 4.370 photons s−1 cm−2, respectively) for the remaining intensity to get a hardness ratio. HR 1 is derived from equation (2) with typical errors of 23%, while HR 2 is derived from equation (1) with errors of 25%. Source J190946-635129 is the central black hole. The complete catalogue is available in the electronic version only.
Table 2 lists the positions and intensities of the sources along with the luminosities and HRs. We detect four off-centre sources (J190845-634817, J191104-634611, J191107-634823, J191109-635258) along with the slightly off-centre central source (J191013-635404) that were previously detected by Fabbiano et al. (Reference Fabbiano, Kim and Trinchieri1992) using Einstein observations. We also search for foreground sources in the field of NGC 6744 by cross-checking the positions of the X-ray catalog with SIMBAD. Using a search radius of 12 arcsec, we found one result—the K0-type star 190449.9−635729 (Pocock et al. Reference Pocock, Penston, Pettini and Blades1984).
3.1.2. Radio-continuum sources
In Table 3, we present a sample of our combined radio catalogue.Footnote 7 We extract radio sources from each image using the source extraction package Python Blob Detection and Source Measurement (PyBDSM; Mohan & Rafferty Reference Mohan and Rafferty2015) and use local r.m.s values that vary across the image. For all detected sources, we list the position and integrated flux density at each given frequency. We estimate that the uncertainty in flux density measurements is below 10%. Our most sensitive and among the highest-resolution radio-continuum images is the 2.1 GHz (λ=13 cm) C2697 CABB data-set (r.m.s of 0.010 mJy beam−1 and FWHM of 7.51 arcsec×4.41 arcsec). From this image, a total of 280 unique radio sources are identified, and catalogued in Table 3. However, SN2005at, at RA(J2000)=19h09m53.6s, Dec.(J2000) = –63°49arcmin24.1arcsec (Martin et al. Reference Martin, Yamaoka, Monard and Africa2005) could not be detected in any other of our radio images down to a 2σ level (see Section 2.2.1).
Table 3. A sample list of radio point sources in the NGC 6744 field at λ= 20, 13, 6, and 3 cm.
Column 8 is the spectral index for all flux density measurements of a source that had three or more flux density values. The last column is based on the classification scheme outlined in Section 3.1.3. Sources that are strong candidates for their respective classification are presented in upper case, while less robust classifications are presented in lower case. Sources marked with an asterisk are outside of the galaxy ellipse defined as 20 arcmin × 12.9 arcmin. The estimated uncertainty in flux density is below 10%.
3.1.3. Source classification
Radio continuum sources found towards NGC 6744 are likely to fall into three classes: H ii regions and SNRs within NGC 6744; and background radio sources. We initially classify our sources into these categories based on simple criteria:
1. Sources detected in both radio and IR are taken to be H ii regions;
2. Sources detected in both radio and X-rays are taken to be SNRs;
3. Sources outside the optical extent of NGC 6744 are taken to be exclusively background sources. However, we also expect that some of the sources listed here might be associated with NGC 6744, while some that are within the defined area of NGC 6744 could be of a background nature.
Following Sturm et al. (Reference Sturm2013b) cross-matching the SMC radio and the X-ray data, we use the most accurate position based on the PSF maps of the X-ray images. We set a search radius of 10 arcsec between the X-ray and all radio positions in order to match the radio catalogues from different frequencies to each other. The only exception was matching the 2.1 GHz data to the 1.4 GHz pre-CABB data, for which we use 30 arcsec, due to the poor resolution of the 1.4 GHz image. From 117 X-ray and 280 radio catalogued sources, we find only nine sources detected in both radio and X-rays, namely J191042-634553, J191107-634826, J190916-634033, J190925-634329, J190908-634638, J190946-635128, J190935-635241, J190919-635329, and J190840-633810. Three of these nine sources are outside the optical extent of NGC 6744, while six are considered as SNRs and SNR candidates. Moreover, we find 44 sources in common to radio and IR surveys. Depending on their characteristics and position relative to the NGC 6744, we classify them as either H ii regions (17), background sources (25) or in two other cases as central black hole (Section 3.1.4) and SNR (J190908-634638; see Section 3.1.5).
We estimate radio spectral indices for 10 sources detected in more than two radio bands and also in X-ray. We emphasise that the radio images used in estimating spectral index are not of the same resolution, and as such, for extended sources, the varying angular resolution may cause the spectrum to be less smooth than the true one or steeper at higher frequencies. It is well established that the radio spectral index (where S∝να) overlaps between different groups of sources and as such cannot be exclusively used for source classification. However, radio sources with steep spectral index of α < −0.9 are more likely to be background sources and those with flatter spectral indices (α < −0.5) slightly favour an H ii classification. In between two, SNRs tend to have α = −0.5 ± 0.3. However, background sources that we expect to be a dominant population in our catalogues exhibit a wider range of spectral indices. We do not expect to find any pulsars (which are usually steep spectrum sources) and Pulsar Wind Nebulae (flat spectrum) in NGC 6744 as they would emit at levels below the detection limit based on our observations from other nearby galaxies where no such sources could be detected (e.g., O’Brien et al. Reference O’Brien2013).
We visually inspected and classified the sources in the radio, X-ray, and IR images and classified sources according to their morphology from the best available resolution band, spectral index, and HR similar to Filipovic et al. (Reference Filipovic, Haynes, White and Jones1998).
Using these criteria, we classify all sources found in this study into these three groups: there are 254 background sources of which 229 are outside of the galaxy (marked in Table 3 as ‘BKG⋆’), 14 are likely background objects in the vicinity of NGC 6744 (marked in Table 3 as ‘BKG’), and additional 11 are classified as likely background objects (marked in Table 3 as ‘bkg’). We also find two highly probable SNRs and five SNR candidates based on the strength of X-ray emission (marked in Table 3 as ‘snr’), discussed further in Section 3.1.5. Finally, we classify 17 discrete sources as likely H ii regions (Section 3.1.6) and one as AGN (central NGC 6744 black hole; Section 3.1.4). Radio source J190953-635059 is the only source with an inverted spectrum of α = 0.32, and it has no X-ray or IR detection. We tentatively classify this source as a background.
3.1.4. Central black hole (AGN) source
We identify a central radio and X-ray source as detected by Einstein at RA(J2000)=19h09m46.3s, Dec.(J2000)=–63°51arcmin28.00arcsec (source J190946-635128 in Table 3) in our 2.1 GHz radio-continuum image as well as in X-ray images (source J190946-635129 in Table 2). Veron-Cetty & Veron (Reference Veron-Cetty and Veron1986) listed NGC 6744 as hosting an AGN using optical spectroscopy.Footnote 8 The similarity of NGC 6744 to the Milky Way suggests that this source (see Figure 5) might be similar to the one in the centre of our Galaxy — Sagittarius A⋆ (Sgr A⋆; Genzel et al. Reference Genzel, Eckart, Ott and Eisenhauer1997)
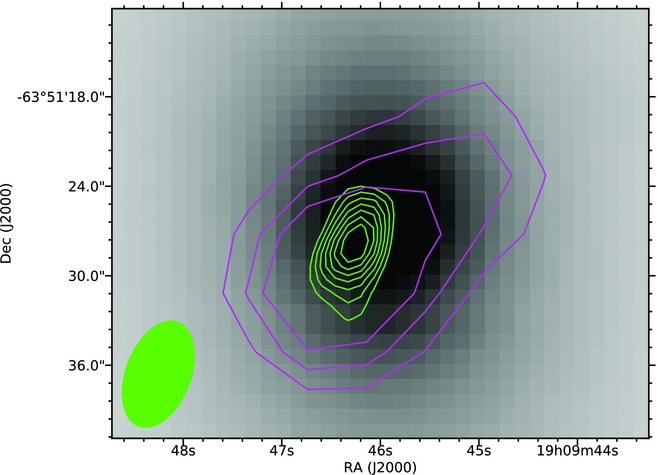
Figure 5. NGC 6744 central source J190946-635128. WISE band 1 image (grey scale) overlaid with radio ATCA 2.1 GHz (project C2697; green contours from 5σ to 11σ with increments of 1σ; σ= 0.01 mJy beam−1) and X-ray Chandra broad-band (magenta; ID 15384; contours are 1.5× 10⁻⁷ cts s−1 to 2.5× 10⁻⁷ cts s−1 with increments of 5× 10⁻⁸ cts s−1). The beam size is shown in the lower left corner.
We measure the total flux density of the proposed NGC 6744 AGN at 2.1 GHz to be 0.126 mJy. At this flux density level, and assuming a flat spectral index (Falcke & Markoff Reference Falcke and Markoff2013), other ATCA observations (such as C389 or CX082) should also detect this central source. However, no other radio continuum detection of this source could be found, probably from a combination of reasons which include (but are not limited to) smaller bandwidth, poorer (u, v) coverage, steeper spectral index or intrinsic source variability.
Assuming that the spectral index is similar to Sgr A⋆ (Falcke et al. Reference Falcke, Goss, Matsuo, Teuben, Zhao and Zylka1998; Falcke & Markoff Reference Falcke and Markoff2013, α ~ 0),Footnote 9 we estimate that the total bolometric luminosity over the radio spectrum (10 MHz–100 GHz) is ~1.3 × 1036 ergs s−1.Footnote 10 This would be an order of magnitude larger than our Milky Way’s central supermassive black hole for which the bolometric radio luminosity is estimated to be ~1035 ergs s−1 (Falcke & Markoff Reference Falcke and Markoff2013).
The X-ray counterpart of the nucleus did not have sufficient counts for a spectral analysis. The X-ray luminosity of NGC 6744’s supermassive black hole (9.26× 1037 ergs s−1) is orders of magnitude larger than that of Sgr A* (2.0× 1033 ergs s−1; Baganoff et al. Reference Baganoff2001) but comparable to NGC 821 (6× 1038 ergs s−1; Pellegrini et al. Reference Pellegrini, Baldi, Kim, Fabbiano, Soria, Siemiginowska and Elvis2007). This is not surprising as Sgr A* at both wavebands has long been known to be underluminous, with luminosity several orders of magnitude lower than the Eddington luminosity (Baganoff et al. Reference Baganoff2003; Falcke & Markoff Reference Falcke and Markoff2013). In X-ray images, this source is slightly extended along the NW–SE line suggesting possible jet outflows. However, our Chandra images are sensitive to about 1 arcsec (46 pc at the distance of NGC 6744), which implies that we cannot rule out an association with the other nearby and X-ray luminous sources such as X-ray binaries.
3.1.5. SNRs
We use the criteria established in Section 3.1.3 and classify seven objects as NGC 6744 SNR candidates. We also use WISE IR images to search for sources with both radio and X-ray emission within the boundaries of NGC 6744. We add this as a new criterion as we expect that these radio-X-ray-IR detections are most likely to be intrinsic and non-thermal sources, i.e., SNRs. We find only two such sources that we classify as the most likely SNRs (see Figure 6). One of these two sources (J190908-634638) is a very luminous X-ray source—comparable to young Galactic or Magellanic Clouds SNRs (Roper et al. Reference Roper, McEntaffer, DeRoo, Filipovic, Wong and Crawford2015; Maggi et al. Reference Maggi2016). However, if this source is a young energetic SNR, then its size would not be larger than a few parsec. The other source (SNR J190919-635329; Figure 6 (bottom)) shows only very weak WISE (IR) emission that is further hampered by the local confusion.
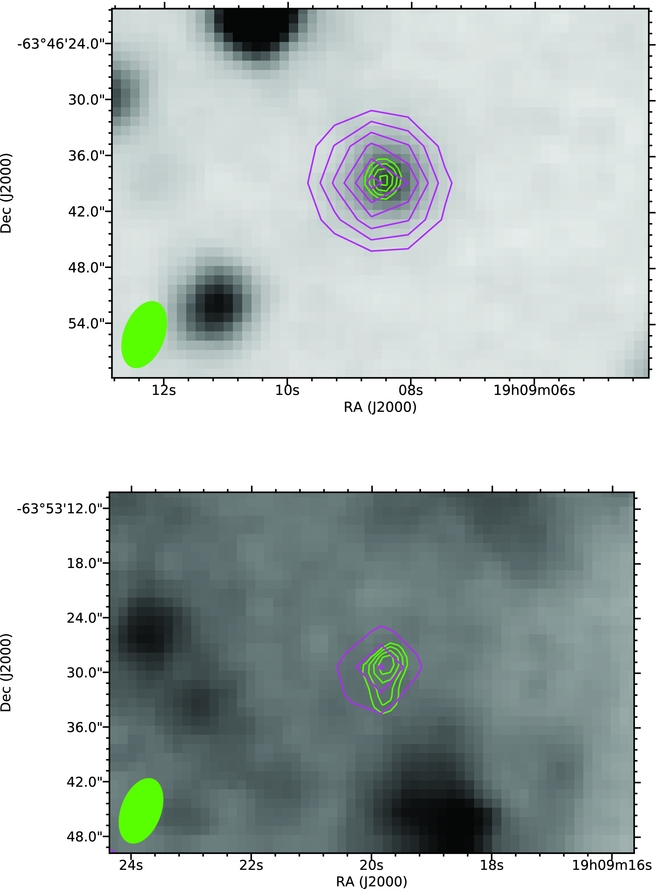
Figure 6. SNRs in NGC 6744. A WISE band 1 image overlaid with radio ATCA 2.1 GHz (green) and X-ray Chandra broad-band (magenta). Top: SNR J190908-634638 with radio contours from 5σ to 8σ and spacings 1σ. The X-ray contours are from 5× 10⁻⁷ to 1.75× 10⁻⁶ cts s−1 with spacings 2.5× 10⁻⁷ cts s−1. Bottom: SNR J190919-635329 with radio contours from 5σ to 8σ with spacings 1σ. The X-ray contours are from 1.5× 10⁻⁷ to 2.5× 10⁻⁷ cts s−1 with spacings 5× 10⁻⁸ cts s−1. The beam is shown in the lower left corner of each image.
There are also additional five sources that are of lower confidence in terms of the SNR classification as they are close to the galaxy boundary. With each source’s X-ray to radio detection, we consider these objects more likely to be SNR candidates than background sources. All seven SNRs and SNR candidates are listed in Table 4.
Table 4. Parameters of the two likely SNRs and five SNR candidates in NGC 6744.
The first two listed sources are objects with a high SNR classification confidence, while the last five are SNRs with lower confidence due to being close to the galaxy boundaries. The associated error in the diameter is ~15 pc (2.1 GHz image were deconvolved to allow for the beam size). The surface brightness is estimated using typical SNR spectral index of α = −0.55 (Filipovic et al. Reference Filipovic, Haynes, White and Jones1998; Bozzetto et al. Reference Bozzetto2017).
3.1.6. H ii regions
There are 17 radio sources seen in our radio images as concentrations of gas (and stars) in the outer arms of NGC 6744 (see Table 5). These sources are also detected as strong point sources in all of the WISE images. Two of these sources are clearly in the spiral arms of NGC 6744 and are shown in Figure 7. However, we do not detect the H ii region reported by Talent (Reference Talent1982) at RA(J2000)=19h10m18s, Dec.(J2000)=–63°54 arcmin 29 arcsec. Also, we compared our H ii region detections with those found by Ryder (Reference Ryder1995) by re-analysing his Hα image. We found only 10 radio counterparts out of the 22 listed H ii regions in Ryder (Reference Ryder1995) and show their properties in Table 6. However, we note that Ryder (Reference Ryder1995) selected these 22 H ii regions for spectroscopy to determine abundances. Apart from J190958-635405, another six radio H ii regions not selected/listed in Ryder (Reference Ryder1995) can be also detected in that Hα image.

Figure 7. Prominent H ii regions in the spiral arms of NGC 6744 with WISE band 1 image overlaid with radio ATCA 2.1 GHz (green) (project C2697; 3σ to 13σ with spacings 1σ) and X-ray Chandra broad-band (magenta) (ID 15384; 1.5× 10⁻⁷ to 9× 10⁻⁷ cts s−1 with spacings 5× 10⁻⁸ cts s−1) contours. The synthesised beam is shown in the lower left corner of each image in green.
Table 5. Seventeen radio continuum NGC 6744 Hii regions found in this study.
We list their positions, integrated flux densities and spectral indices where available.
Table 6. Twenty-two Hii regions in NGC 6744 found by Ryder (Reference Ryder1995) in Hα.
We estimate positions using the original Hα image. Sources are matched to our radio catalog where applicable.
For 3 of these 17 H ii regions, we estimate radio spectral indices and find the values were slightly steeper than expected. However, they are still within the range –0.5 to +0.4. Interestingly, most of the bright IR sources within the NGC 6744 are not detected in radio continuum. This is most likely because of our radio data sensitivity. However, as mentioned above, several radio features of the spiral arms are coincident with the IR counterparts.
3.2. Infrared emission
As described in Jarrett et al. (Reference Jarrett2013), the source (NGC 6744) characterisation consists of foreground star subtraction, background statistics, axis ratio and position angle determination at the 3σ isophotal level, integrated flux, and surface brightness measurements. The elliptical isophote shown in Figure 4 corresponds to the 1σ (RMS) isophote in the W1 (3.4 μm), which has a major axis diameter of 18.3 arcmin, equal to 50.4 kpc in physical size. This ellipse nicely matches D25 (the isophote of the 25.0 B magnitude per square arcsecond brightness level). The integrated flux down to this isophotal level is 1.98, 1.11, 3.59, and 4.20 Jy (with 1–2% formal uncertainties), respectively, for W1, W2, W3, and W4. The WISE flux density conversion values are 309.68, 170.66, 29.05, and 7.871 Jy, respectively, for W1, W2, W3, and W4.Footnote 11 Extended emission below the single-pixel noise level is measured by fitting a double-Sersic to the axi-symmetric radial profile, which results in additional 3% to 15% emission, giving the ‘total’ flux of the source: 1.99, 1.14, 4.23, and 4.64 Jy, respectively.
Using the colour and integrated flux measurements, we derive the stellar mass and SF properties. Following the procedure of Cluver et al. (Reference Cluver2014), the W1 stellar mass-to-light ratio is estimated from the W1–W2 = 0.02 mag colour using integrated magnitudes of 5.488 and 5.466 mag for W1 and W2, respectively, giving a value of 0.59. Calculating the W1 inband luminosity from the total flux, assuming a distance of 9.5 Mpc, and applying the M/L ratio, leads to a stellar mass log(M/M⊙) = 10.82±0.14. The SF activity is derived from the W3 and W4 spectral luminosity (νL ν), where the stellar continuum has been subtracted based on the emission in the W1 band, and the total IR luminosity (L TIR) SFR relation from Cluver et al. Reference Cluver2017. The resulting SFR is 4.7 M⊙yr−1 based on the W3 (12 μm) and 2.8 M⊙yr−1 based on the W4 (22 μm). The former includes contributions from PAH, nebular emission, and warm dust, while the latter includes the warm dust continuum. This ‘infrared’ SFR depends on the obscuration of dust to the young and massive (UV-emitting) stellar population, but note that it is very similar to the SFR based on emission from H ii regions, which is re-assuring for both infrared and Hα estimates (stated previously in Section 1).
Combining the two derived measures, the specific star formation rate (sSFR per Gyr) is then –10.18 to –10.37 yr−1. The NGC 6744 stellar mass and SFR are consistent with the predicted value based on the Galaxy SFR-M ‘sequence’ that gauges the growth and evolution of galaxies (see Figure 13(a) in Jarrett et al. Reference Jarrett2017). In terms of the specific SFR, which normalises the SFR across the mass spectrum (i.e., the sequence slope), the growth of NGC 6744 is larger than that of late-type spirals (e.g., Milky Way and M 31), but considerably less than starburst galaxies (e.g., M 82), and not unlike that of the late-type barred M 83, which has significant SF activity along the bar-ends (see Jarrett et al. Reference Jarrett2013); and (Figure 13(b) in Jarrett et al. Reference Jarrett2017). NGC 6744 is still building its disk and bulge population, undergoing SF feedback processes, such as supernovae, that help to regulate its growth.
3.3. Large-scale emission
A low-frequency MWA image of NGC 6744 (from the GLEAM survey, Wayth et al. Reference Wayth2015) is compared to the 3-band WISE image in Figure 2; a low-frequency spectral index image, based on all four wide MWA bands centred on 88, 118, 154, and 200 MHz, is shown in Figure 8. The synchrotron-dominated 200 MHz emission is elongated NE–SW, and has a greater extent than the N–S elongated IR emission. The northeast end is dominated by a strong (most likely background) source as well as a similar extension to the southeast. It therefore appears that the large-scale synchrotron emission from NGC 6744 is somewhat more extended than, and roughly aligned with, the IR emission from its disk.
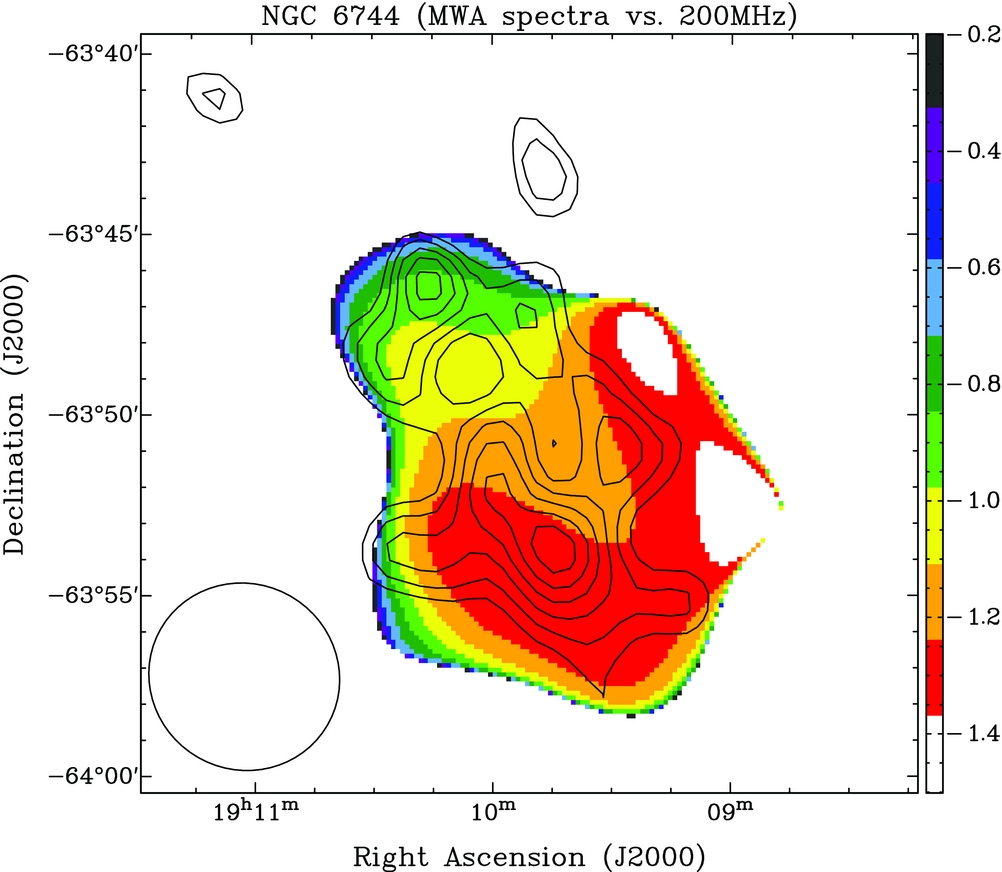
Figure 8. MWA spectral index map, which is made of four MWA wide bands (88–200 MHz) overlaid with 200 MHz contours. Contours are 4–10σ with spacings of 1σ (where 1σ= 0.019 Jy beam−1). The synthesised beam size of the lowest MWA band (88 MHz) is shown in the lower left corner (5 arcmin×5 arcmin). The colour bar indicates the spectral index value and is dimensionless.
Figure 8 shows a spectral index gradient along the elongation axis of the synchrotron emission. The spectral index is steeper in the SW region and shallower in the NE (α ~ −0.7). While the errors associated with the spectral index are large (~0.4) and the index is calculated over a frequency range limited to lower frequencies, we still find this ‘bipolar’ spectral index very unusual and further study at other radio frequencies are needed.
4 CONCLUSION
We present a catalogue of the 387 discrete X-ray and radio sources in NGC 6744 that are shown here for the first time. Our multi-frequency analysis of the available observations have led to the following results:
• We find a central source that we associate with a supermassive black hole (AGN). It is detected in both X-ray and radio, though very faint, with possible jet flows spanning in the SE to NW direction. We estimate the bolometric radio luminosity as ~1.3 × 1036 ergs s−1, which is an order of magnitude stronger compared to the Milky Way’s central black hole (~1035 ergs s−1). Similarly, the X-ray luminosity of the central source is a few orders of magnitude larger in NGC 6744 than in our Galaxy as expected based on previous studies.
• We find a total of 117 X-ray sources including one foreground star that are identified here for the first time. Also, we find 280 radio sources from which 254 sources are categorised as background objects. Of these, we identified nine sources in common between X-ray and radio as well as only two common to all three wavebands. We find the minimum detectable flux of the X-ray sources as 8.23× 10⁻¹⁶ ergs s−1 cm−2.
• We confirm two sources as likely SNRs, and identify a further five SNR candidates. Given the unusually large fluxes recorded by Chandra at a distance of 9.5 Mpc, we suggest that the SNRs are particularly bright. However, the new SNRs are not as bright as the well known Galactic precedent, SNR Cassiopeia A (Keohane, Rudnick, & Anderson Reference Keohane, Rudnick and Anderson1996; Reynoso Reference Reynoso2007).
• We find 17 H ii regions, with two clearly in the spiral arms of the NGC 6744. WISE data show relatively cool material in the outer spiral arms of the galaxy. This 22-μm dominated emission is likely to arise from the warm dust in the vicinity of H ii regions.
• From WISE data, we estimate the SFR to be 2.8–4.7 M⊙~yr − 1. This value along with the stellar mass of NGC 6744 are consistent with the SFR and population evolutionary growth predicted for an intermediate disk galaxy (e.g., see Jarrett et al. Reference Jarrett2013). For all the apparent similarities between NGC 6744 and our Milky Way, the global SFR in NGC 6744 is 2–3 times greater than that of the Milky Way.
ACKNOWLEDGEMENTS
The ATCA is part of the Australia Telescope National Facility that is funded by the Commonwealth of Australia for operation as a National Facility managed by CSIRO. This research has made use of data obtained from the Chandra Data Archive and the Chandra Source Catalog and software provided by the Chandra X-ray Center (CXC) in the application packages CIAO, ChIPS, and Sherpa. ADK acknowledges the financial support from the ARC Centre of Excellence for All-Sky Astrophysics (CAASTRO) through project number CE110001020. We thank an anonymous referee for their thorough review and highly appreciate their comments and suggestions, which significantly contributed to improving the quality of our paper. We thank Stuart Ryder for providing the Hα image from his earlier study (Ryder Reference Ryder1995). MZP acknowledges support from the Ministry of Education, Science and Technological Development of the Republic of Serbia through project No. 176005.


