


1 INTRODUCTION
High-mass stars (M > 8 M⊙) dominate the energy input and chemical enrichment of galaxies. Thus, the processes by which they form are a key component in determining the global properties and evolution of galaxies. Although controversy remains about how high-mass stars ultimately acquire their mass, either locally via ‘monolithic collapse’ or from afar via ‘competitive accretion’ (see McKee & Ostriker Reference McKee and Ostriker2007; Zinnecker & Yorke Reference Zinnecker and Yorke2007), all theories agree that a high-mass star begins its life in a dense core, which collapses and fragments to form one or more stars. (Since high-mass stars form in clusters, it is important to distinguish between molecular ‘clumps’ that give rise to clusters and molecular ‘cores’ that give rise to individual stars or close binary stellar pairs. In this paper we refer to ‘clumps’ as objects with size scales ~1 pc and masses ⪆200 M⊙. Clumps are expected to give rise to clusters or groups of stars. We refer to ‘cores’ as objects with size scales ⪅0.1 pc and masses of
⪅100 M⊙ that will form individual stars or close binary pairs.) The dense core accretes material, and when fusion in the high-mass star begins, it enters the main-sequence phase while still accreting. Eventually, the luminous, hot high-mass star terminates further star formation by disrupting the core through ionisation and outflows/stellar winds. These later, warmer phases are observable hot molecular cores (HMCs) and Ultra-compact (UC) $\mathrm{H\,{\scriptstyle {II}}}$
regions.
$\mathrm{H\,{\scriptstyle {II}}}$
regions.
Despite these long-standing theoretical expectations, the evolution of a high-mass star remains poorly understood, primarily because the processes are difficult to observe. Compared with low-mass stars, high-mass stars have much shorter formation timescales, a much sparser Galactic distribution, and an enormous disruptive effect on their natal clouds. Observations now clearly demonstrate that high-mass stars indeed form exclusively in dense clumps. Consequently, new observational studies that characterise their physical and chemical evolution are sorely needed for further progress. We aim to provide an important new legacy database for the study of high-mass star formation by conducting the Millimetre Astronomy Legacy Team 90 GHz (MALT90) survey, a large molecular line survey of high-mass star-forming regions with the Australia Telescope National Facility (ATNF) Mopra Telescope.
In this paper we provide an overview of the MALT90 survey and describe the motivation, telescope and observing modes, molecular lines selected, identification of suitable high-mass star-forming clumps, the data reduction procedure, and data release. With its unprecedented large sample of clumps, MALT90 is an important new database that will support numerous scientific investigations for years to come. Here we highlight just a few early science results.
2 THE SURVEY
2.1 Motivation
In order to better understand the formation of high-mass stars, it is important to identify and characterise a sample of high-mass star-forming clumps in all stages of protostellar evolution. Fortunately, recent Galactic plane surveys of the millimetre, sub-millimetre, far-infrared, and mid-infrared continuum emissions have identified a large number of these high-mass star-forming clumps, e.g. GLIMPSE (3–8 μm, Benjamin et al. Reference Benjamin2003; Churchwell et al. Reference Churchwell2009), MIPSGAL (24 μm, Carey et al. Reference Carey, Noriega-Crespo and Mizuno2009), HiGAL (70–500 μm, Molinari et al. Reference Molinari2010), ATLASGAL (870 μm, Schuller et al. Reference Schuller2009), and BGPS (1.1 mm, Aguirre et al. Reference Aguirre2011). Combined, these surveys enable us to identify and characterise a large number of clumps in all stages of the proposed evolutionary sequence for high-mass star formation.
While these continuum surveys provide estimates of the dust temperatures and column densities, they have several significant limitations. First, because the emission is blended along the line of sight, it is sometimes difficult to separate emission from unrelated clumps. Moreover, continuum surveys alone cannot be used to infer distances, kinematics, or the chemical state of the material. Fortunately, these limitations of dust continuum surveys can be overcome with complementary molecular line surveys. By observing molecules with high critical densities that unambiguously trace dense gas, we can cleanly separate high-density, star-forming clumps from more diffuse, unrelated giant molecular clouds. Also, by realising that different molecular clouds have different radial velocities, we can separate clumps that happen to lie along the same line of sight. Molecular line velocities also provide kinematic distances that delineate the clumps’ Galactic distributions, and combined with the continuum data, allow estimates of the clump masses and luminosities. Finally, by measuring line profiles and the intensities of multiple molecular species, the clumps’ kinematic and chemical state can be inferred. Thus, with MALT90 we aim to determine these parameters for a large sample of clumps identified from dust continuum surveys and in doing so characterise high-mass star-forming clumps and study their physical and chemical evolution.
With MALT90 our goal is to answer several important open questions: What are the statistical properties (masses, temperatures, densities, luminosities, chemical states, and rotation rates) of these clumps? How do these properties evolve? What is their Galactic distribution and relation to spiral arms? Can we identify rare, but important, ‘transition objects’ that represent cores in very brief evolutionary phases? How do the properties of individual star-forming clumps relate to the large-scale properties of star-forming galaxies?
2.2 Feasibility
To ascertain the feasibility of such a large survey, it is critical to establish the typical line strengths, source sizes, line profiles, and detection rates of the clumps revealed by the various finder charts, and based on these characteristics, to choose observing parameters that maximise the survey's scientific usefulness. With this in mind, we conducted a MALT90 pilot survey (Foster et al. Reference Foster2011) to test the feasibility of MALT90 and to establish the optimal observing parameters.
The pilot observations provided critical information that guided many of our choices for MALT90, in particular that (1) Mopra has adequate sensitivity and speed to detect and map molecular line emission from thousands of high-mass star-forming clumps in a reasonable time, (2) the ATLASGAL 870 μm continuum survey provides the best source list as it detects both cold and warm clumps, a highly desirable characteristic for studying clump evolution, (3) mapping is desirable due to the complex and varying morphologies of the different molecular lines, and (4) high spectral resolution is desirable due to the broad, complex line profiles often detected towards these types of clumps.
2.3 The Mopra telescope
A large molecular line survey requires an efficient telescope with good sensitivity and mapping speed such as Mopra telescope. The Mopra radio telescope is part of the Australia Telescope National Facility that is funded by the Commonwealth of Australia for operation as a National Facility managed by the Commonwealth Scientific and Industrial Research Organisation (CSIRO). Mopra is a 22-m diameter telescope situated close to the Siding Spring observatory site near Coonabarabran, New South Wales, Australia. It is the largest single-dish telescope operating at 3 mm in the Southern Hemisphere. Moreover, it is equipped with a sensitive, tuner-less, dual-polarisation, MMIC receiver and a broad-bandwidth, flexible backend (the Mopra Spectrometer, MOPS)Footnote 2 that allows for the processing of an 8-GHz wide bandwidth. MOPS can operate in two modes, a ‘wideband' mode that produces an 8-GHz spectrum anywhere within the 3-mm band, and a ‘zoom’ mode that simultaneously produces 16 spectra, each with a bandwidth of 137.5 MHz and with fixed central frequencies selected by the user. At 90 GHz, the spectral resolution is 3.3 km s−1 in wideband mode and 0.11 km s−1 in zoom mode. For typical observing conditions, the system temperature near 90 GHz is ~200 K. The antenna's main-beam efficiency at 90 GHz is 0.49 (Ladd et al. Reference Ladd, Purcell, Wong and Robertson2005). Because of its ability to detect multiple spectral lines over a broad range of frequencies, Mopra has been used extensively to conduct spectral surveys of star-forming regions. Of particular note are the pioneering studies of Purcell et al. (Reference Purcell2006, Reference Purcell, Longmore, Burton, Walsh, Minier, Cunningham and Balasubramanyam2009) that conducted spectral surveys before substantial improvements allowed more efficient observations.
Using the On-the-Fly (OTF) mode, the Mopra telescope can also efficiently image the spatial distribution of spectral lines by scanning the telescope back and forth across the sky in a raster pattern, and collecting data as it scans. Because the ‘off’ position used for sky-subtraction is shared for all positions in a raster row, the time for slewing is minimised and the time for on-source integration is maximised in the OTF mode. Redundancy is achieved by oversampling the beam in the scan direction (collecting data every 2 s) and overlapping subsequent rows. Thus, the maps are not only efficient, but also of high quality. As such, Mopra is an excellent survey instrument that can simultaneously image 16 spectral lines at high spectral resolution. For MALT90 we use Mopra in the OTF mode with MOPS in the zoom mode configured to a central frequency of ~90 GHz.
2.4 Line selection
We choose the 90 GHz portion of the spectrum because it is rich in diagnostic lines. Many molecules with large dipole moments have rotational transitions to their ground or their first rotationally excited states near 90 GHz. Since these transitions have large Einstein A coefficients, they require high densities for excitation (typically n >105 cm−3). Such high densities are found in dense star-forming clumps, but not in the far more diffuse giant molecule clouds typically traced by CO. Thus, the 90 GHz lines from high dipole moment molecules are unambiguous probes of the dense regions that will give rise to the stars. Diffuse gas from unrelated giant molecular clouds in their vicinity or along the line of sight simply have insufficient density to excite these lines.
Also, since the high dipole moment molecular lines near 90 GHz span a large range of excitation energies (from ~5 to 200 K) and critical densities (from ~105 to 106 cm−3), they indicate distinct physical conditions within cores. Furthermore, because the chemistry evolves dramatically from simple species in cold clumps to quite complicated species in hot regions, the 90 GHz lines also probe distinct stages of chemical evolution. Finally, because the molecular line observations supply velocities, they provide kinematic information (e.g. rotation, infall, turbulence, and outflows) that continuum surveys cannot. Indeed, by comparing the observed LSR velocities with a model of Galactic rotation, kinematic distances to the star-forming clumps can be estimated.
The most important diagnostic lines in the 86–93 GHz spectrum are the density tracing, bright, ground state transitions of the abundant molecular species: N2H+ (1–0), HCO+ (1–0), HCN (1–0), and HNC (1–0). After CO and its isotopologues, these are among the brightest molecular lines in the 3-mm band. These lines can be used to reveal the physical and chemical states of the gas. For instance, N2H+ is thought to be chemically robust in colder gas because its precursor molecule N2 resists freezing onto dust grains, and HNC is enhanced in very cold gas (e.g. Bergin & Tafalla Reference Bergin and Tafalla2007). In addition to these high-density tracers, we have also selected some rarer molecular lines with isotopic substitutions that are usually optically thin, such as 13CS, 13C34S, H13CO+, and H13CN. These lines can be used to estimate optical depths and hence column densities. They are particularly useful to understand self-absorbed line profiles in the optically thick main lines, for they reveal the true systemic velocity and the velocity of the peak column density for each clump.
Another group of selected molecules requires high densities and temperatures for their formation and/or excitation. These molecules, CH3CN, HC3N, HC13CCN, and HNCO, are typically detected only towards warm, dense hot clumps associated with the protostars and $\mathrm{H\,{\scriptstyle {II}}}$
regions. Thus, they can be used as an independent check on the evolutionary state. We also include three diagnostic lines that arise only under specific conditions. The first is the H41α recombination line, which arises only in dense
$\mathrm{H\,{\scriptstyle {II}}}$
regions. Thus, they can be used as an independent check on the evolutionary state. We also include three diagnostic lines that arise only under specific conditions. The first is the H41α recombination line, which arises only in dense $\mathrm{H\,{\scriptstyle {II}}}$
regions. The second, SiO (2–1), is formed when SiO is formed from silicate-bearing grains that are destroyed by shocks. Consequently, SiO lines are unambiguous tracers of shocks; usually these arise from protostellar or stellar outflows. Finally, the C2H lines near 87 GHz are thought to be distinct chemical tracers of the ionised/molecular gas interface regions called photodissociation regions or PDRs. Strong C2H emission thus signals that a high-mass protostar has left the protostellar and entered the
$\mathrm{H\,{\scriptstyle {II}}}$
regions. The second, SiO (2–1), is formed when SiO is formed from silicate-bearing grains that are destroyed by shocks. Consequently, SiO lines are unambiguous tracers of shocks; usually these arise from protostellar or stellar outflows. Finally, the C2H lines near 87 GHz are thought to be distinct chemical tracers of the ionised/molecular gas interface regions called photodissociation regions or PDRs. Strong C2H emission thus signals that a high-mass protostar has left the protostellar and entered the $\mathrm{H\,{\scriptstyle {II}}}$
region phase.
$\mathrm{H\,{\scriptstyle {II}}}$
region phase.
We note that molecular chemistry is often complex, and the molecular tracers described above may not be unambiguous tracers in all situations. For example, HNCO, in addition to probing hot cores, may also be enhanced in shocks (Rodríguez-Fernández et al. Reference Rodríguez-Fernández, Tafalla, Gueth and Bachiller2010). Moreover, C2H has been found to trace both early (protostellar) and late (PDR) stages of high-mass star formation (Beuther et al. Reference Beuther, Semenov, Henning and Linz2008). Indeed, Sanhueza et al. (Reference Sanhueza2013) find compact C2H emission from a very cold infrared dark cloud with no obvious PDR. Moreover, HC3N and C2H emit strongly in the cold, low-mass, star-forming cores in Taurus (e.g. Pratap et al. Reference Pratap, Dickens, Snell, Miralles, Bergin, Irvine and Schloerb1997). With its large sample of clumps and the variety of its observed lines, MALT90 can help determine exactly what the various molecular species are tracing chemically.
2.5 Identifying star-forming clumps
Due to the small solid angle occupied by star-forming clumps emitting strongly at 90 GHz, and the relative faintness of these lines compared with CO lines, a blind, fully sampled survey of several square degrees or more of the Galactic plane is impractical. Thus, to survey significant numbers of star-forming clumps efficiently, we use the APEX Telescope Large Survey of the Galaxy (ATLASGAL) 870 μm survey (Schuller et al. Reference Schuller2009), the first complete sub-millimetre inner Galactic plane survey, to select dense, star-forming clumps. ATLASGAL is ideal for this purpose because it detects both cold prestellar clumps and warm clumps that already contain protostars, $\mathrm{H\,{\scriptstyle {II}}}$
regions, and hot cores. From the ATLASGAL sources, we restrict our range of Galactic longitudes to −60° to +20°.
$\mathrm{H\,{\scriptstyle {II}}}$
regions, and hot cores. From the ATLASGAL sources, we restrict our range of Galactic longitudes to −60° to +20°.
To estimate the completeness of the MALT90 survey to high-mass star-forming clumps, we must first estimate the maximum distance at which ATLASGAL can detect such a clump. Since high-mass stars form in clusters, the highest mass clumps detected by ATLASGAL will form not single stars, but rather star clusters. We estimate the mass of the most massive star formed in a cluster as follows. First, we assume that clumps will convert their mass into stars with an efficiency of ~30% (e.g. Alves, Lombardi, & Lada Reference Alves, Lombardi and Lada2007). Although this efficiency is estimated for low-mass star-forming regions, we assume that the same efficiency also applies to high-mass regions. Next, we apply the empirical relationship between cluster mass and the mass M* of the most massive star, M*~1.2M 0.45 cluster (Larson Reference Larson2003). Using this procedure, we find that clumps with masses Mclump >200 M⊙ are likely to form a high-mass star with M*>8 M⊙.
Due to the high sensitivity of the ATLASGAL survey, such Mclump
>200 M⊙ high-mass star-forming clumps can be detected at fairly large distances in the Galaxy. Making the usual assumptions about dust temperature, dust emissivity, and gas-to-dust mass ratios, one can estimate the mass of dense clumps from sub-millimetre continuum data to within factors of a few. Schuller et al. (Reference Schuller2009) estimate that, for cold dust with $T_{\text{dust}} = 10$
K, the ATLASGAL 5σ 870 μm flux sensitivity of 0.25 Jy corresponds to a clump mass of 200 M⊙ at a distance of 10 kpc. Thus, ATLASGAL detects all cold, high-mass star-forming clumps out to a distance of 10 kpc.
$T_{\text{dust}} = 10$
K, the ATLASGAL 5σ 870 μm flux sensitivity of 0.25 Jy corresponds to a clump mass of 200 M⊙ at a distance of 10 kpc. Thus, ATLASGAL detects all cold, high-mass star-forming clumps out to a distance of 10 kpc.
This 0.25 Jy flux limit is appropriate for cold dust clumps. Once a high-mass protostellar clump leaves its prestellar phase, however, the dust will become heated and more luminous in the sub-millimetre. Thus, for the same mass, a clump containing a protostar or $\mathrm{H\,{\scriptstyle {II}}}$
region would have a correspondingly higher flux. For instance, as the dust temperature increases from 10 K to 20 K, the 870 μm flux increases by a factor of ~2 for the same mass clump. In other words, the warmer high-mass star-forming clumps will be more luminous, or, equivalently, will be seen at even larger distances. We used the flux limit of 0.25 Jy to select the clumps to observe for MALT90.
$\mathrm{H\,{\scriptstyle {II}}}$
region would have a correspondingly higher flux. For instance, as the dust temperature increases from 10 K to 20 K, the 870 μm flux increases by a factor of ~2 for the same mass clump. In other words, the warmer high-mass star-forming clumps will be more luminous, or, equivalently, will be seen at even larger distances. We used the flux limit of 0.25 Jy to select the clumps to observe for MALT90.
2.6 Clump classification
Although ATLASGAL is an excellent finding chart for dense clumps, it contains a heterogeneous mix of warm and cold clumps spanning a wide range of masses. In order to adequately sample high-mass star-forming dense clumps in both the colder prestellar phase and the warmer protostellar and $\mathrm{H\,{\scriptstyle {II}}}$
region phases, it is necessary to classify the evolutionary state of the star-formation activity taking place within the clumps. Fortunately, the Spitzer infrared surveys GLIMPSE and MIPSGAL allow us to broadly separate the clumps into the various evolutionary states based on their IR characteristics. We use these data to categorise the clumps into four distinct evolutionary groups (see Figure 1):
$\mathrm{H\,{\scriptstyle {II}}}$
region phases, it is necessary to classify the evolutionary state of the star-formation activity taking place within the clumps. Fortunately, the Spitzer infrared surveys GLIMPSE and MIPSGAL allow us to broadly separate the clumps into the various evolutionary states based on their IR characteristics. We use these data to categorise the clumps into four distinct evolutionary groups (see Figure 1):
-
• Prestellar: Since they are cold and very dense, prestellar cores will be infrared dark in the GLIMPSE 3.6–8.0 μm and MIPSGAL 24 μm images.
-
• Protostellar: Accretion onto a protostar is signalled by warm dust. Thus, an embedded 24 μm point source in MIPSGAL indicates an embedded, accreting protostar (Chambers et al. Reference Chambers, Jackson, Rathborne and Simon2009). These are often also associated with extended, green emission in GLIMPSE 3.6–8.0 μm three-colour images from an excess of 4.5 μm emission (‘green fuzzies’). This emission likely traces shocked gas due to outflows in the immediate vicinity of a newly forming star.
-
• $\mathrm{H\,{\scriptstyle {II}}}$
region: When the
$\mathrm{H\,{\scriptstyle {II}}}$
region forms, the surrounding gas and dust are heated and the infrared emission associated with the core will be bright in both GLIMPSE and MIPSGAL images. Moreover the PAH feature that dominates the Spitzer 8 μm band is typically bright due to fluorescent excitation. The morphologies of
$\mathrm{H\,{\scriptstyle {II}}}$
regions range from compact to extended, with some displaying bubble-like morphologies.
$\mathrm{H\,{\scriptstyle {II}}}$
region: When the
$\mathrm{H\,{\scriptstyle {II}}}$
region forms, the surrounding gas and dust are heated and the infrared emission associated with the core will be bright in both GLIMPSE and MIPSGAL images. Moreover the PAH feature that dominates the Spitzer 8 μm band is typically bright due to fluorescent excitation. The morphologies of
$\mathrm{H\,{\scriptstyle {II}}}$
regions range from compact to extended, with some displaying bubble-like morphologies. -
• PDR: The UV radiation from a recently formed high-mass star will produce a photodissociation region (PDR) at the molecular/ionised gas interface. The PDR will be extended and emit strongly in the GLIMPSE 8 μm images. Moreover, extended 24 μm emission indicative of hot dust will also be present. In practice, we classify sources as PDRs when they have very extended 8 μm morphologies and no readily identifiable compact
$\mathrm{H\,{\scriptstyle {II}}}$
region.


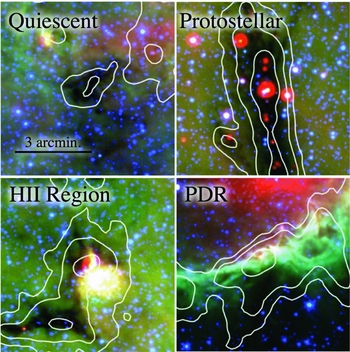
Figure 1. The evolutionary classification scheme of clumps based on Spitzer images. See text for a complete description. The images show Spitzer images from the GLIMPSE and MIPSGAL surveys. In each image the blue, green, and red colours correspond to 3.6 μm, 8.0 μm, and 24 μm, respectively. The white contours indicate 870 μm emission from the ATLASGAL survey (Schuller et al. Reference Schuller2009).
With several thousand compact sources identified within the ATLASGAL survey (e.g. Contreras et al. Reference Contreras2013) and the limited observing time allotted to the MALT90 survey, we chose to observe randomly selected sources from the ATLASGAL compact source catalog. An ATLASGAL source was first classified using the above method before being placed within the queue of sources to be observed. For a particular time within any given observing shift, sources were selected from this queue based on their classification, peak flux, and elevation. Our aim was to observe a large sample of clumps at all flux levels and in each of the various evolutionary stages.
2.7 Observing procedure
Because the MALT90 survey aims to map and characterise a large number of sources and compare their physical and chemical properties, all clumps were observed using the same mapping parameters and in the same molecular transitions. The survey parameters are listed in Table 2.
The observations were conducted over three Austral winter observing seasons: 2010 July 11 to 2010 September 21, 2011 May 7 to 2011 September 29, and 2012 June 29 to 2012 October 31. Over these three seasons more than 2 000 h of observing time was assigned to the MALT90 project in blocks of time we shall call ‘sessions’. Each session was about 14-h long for the first two years and 11 h for the third year. To begin each session the telescope pointing was checked using a SiO maser with an accurately determined position (Indermuehle et al., Reference Indermuehle, Edwards, Brooks and Urquhart2013), followed by a short position-switched observation of a bright $\mathrm{H\,{\scriptstyle {II}}}$
region (almost always G300.968+01.145). Because the G300.968+0.1.145
$\mathrm{H\,{\scriptstyle {II}}}$
region (almost always G300.968+01.145). Because the G300.968+0.1.145 $\mathrm{H\,{\scriptstyle {II}}}$
region contains strong emission from most of the selected molecular transitions, these data were used to check quickly that the telescope, receiver, and backend had been configured correctly. Moreover, since the source was observed at the beginning of almost every observing session, the repeatability of these measurements provides an important assessment of the system reliability, performance, and stability. Based on these repeated observations of G300.968+01.145, Foster et al. (Reference Foster2013) conclude that the accuracy of telescope pointing is a function of elevation and that the system gain varies over the course of each season, with both source elevation and the time of day contributing to the gain variations. Nevertheless, these variations are small, and the pointing is accurate to 8 arcsec and system gain is repeatable to within about 30%. At frequencies near 90 GHz the Mopra beam size is 38 arcsec FWHM.
$\mathrm{H\,{\scriptstyle {II}}}$
region contains strong emission from most of the selected molecular transitions, these data were used to check quickly that the telescope, receiver, and backend had been configured correctly. Moreover, since the source was observed at the beginning of almost every observing session, the repeatability of these measurements provides an important assessment of the system reliability, performance, and stability. Based on these repeated observations of G300.968+01.145, Foster et al. (Reference Foster2013) conclude that the accuracy of telescope pointing is a function of elevation and that the system gain varies over the course of each season, with both source elevation and the time of day contributing to the gain variations. Nevertheless, these variations are small, and the pointing is accurate to 8 arcsec and system gain is repeatable to within about 30%. At frequencies near 90 GHz the Mopra beam size is 38 arcsec FWHM.
Once the observer confirmed that the brightest lines in G300.968+01.145 were detected and that their intensities and profiles were similar to a previous ‘template’ observation, the observer proceeded to observe the session's first target clump. Before mapping the first clump, the telescope pointing was checked on a nearby SiO maser (Indermuehle et al., Reference Indermuehle, Edwards, Brooks and Urquhart2013), typically within 30°. Once the pointing was confirmed, or, if necessary, adjusted, the source mapping commenced. This procedure (a pointing check followed by mapping) was repeated for subsequent sources. At any given time during the shift, a source was selected to be observed based on its elevation. A restriction of 35° < El < 70° was implemented to avoid regions where the telescope pointing model is less reliable and the scanning less efficient.
We obtained two 3′ × 3′ maps around each ATLASGAL clump. Each map was obtained using OTF mode, scanning in Galactic coordinates. To facilitate the removal of any striping or baseline variations in the maps that result from fluctuations in the sky opacity, two maps were obtained for each clump by scanning in orthogonal directions: one in Galactic Latitude and the other in Galactic Longitude. Each map took ~31 min to complete. At the end of each scanning row a reference position was observed. For each map, the reference position was offset from the clump position +1° in Galactic Latitude for sources with b>0 and −1° for sources with b < 0. The system temperature was determined by measuring the emission from an ambient and a cold ‘paddle’ every 15 min (twice per map).
For all observations, the ‘zoom mode’ of the MOPS spectrometer was configured to a central frequency of 89.690 GHz. The zoom mode allows the simultaneous observation of 16 individual IFs within a range of 8 GHz. Each IF was 137.5 MHz wide, with 4 096 spectral channels, corresponding to a velocity resolution of 0.11 km s−1. We selected 16 IFs to include the specific lines listed in Table 1.
Table 1. Spectral lines in the MALT90 survey.

Over all the observing seasons MALT90 completed 2 014 maps that covered over 2 014 ATLASGAL sources (some maps contain more than one ATLASGAL source). Roughly equal numbers of prestellar clumps, protostellar clumps, $\mathrm{H\,{\scriptstyle {II}}}$
regions, and PDRs were observed.
$\mathrm{H\,{\scriptstyle {II}}}$
regions, and PDRs were observed.
2.8 Data reduction
The data reduction for each map was performed using an automated python-based pipeline (using the ATNF packages asap, livedata, and gridzilla). To minimise artefacts due to noise spikes and baseline ripples in the spectrum of the reference position, we modified Livedata to smooth the reference spectrum with an 11-channel Hanning smooth before each reference subtraction. This procedure is valid because baseline variations are slowly varying in frequency. After removal of the bandpass shape with the smoothed reference-position spectrum, the individual on-source spectra were co-added and gridded onto a uniform 9 arcsec grid. To improve pixel-to-pixel variation and to eliminate gaps in the maps, we applied a 12 arcsec Gaussian spatial smooth to the data. This degrades the angular resolution from about 36 arcsec to 38 arcsec. The orthogonal maps were then combined using a system temperature weighting to produce a single data cube per source for each of the 16 IFs. After gridding, the integration time per pixel in the maps is equivalent to ~30 s.
Given that the typical system temperatures during the observations were 180–300 K, the typical rms noise is ~T* A = 0.25 K per 0.11 km s−1 channel. A histogram of the measured rms noise in T* A is presented in Figure 2. All spectra are presented on the antenna temperature (T* A ) scale, corrected to the top of the atmosphere. To convert to main-beam brightness temperatures, one should divide the antenna temperatures by the main-beam efficiency of 0.49 (Ladd et al. Reference Ladd, Purcell, Wong and Robertson2005). For extended sources >80 arcsec, sources begin to couple to the inner error beam. In this case a more appropriate efficiency would be 0.65 (Ladd et. al Reference Ladd, Purcell, Wong and Robertson2005).

Figure 2. Histogram of the measured rms noise in T* A per channel for the first three years of MALT90 (2 014 sources). The typical rms noise is ~T* A = 0.25 K per 0.11 km s−1 channel.
2.9 Data release
The MALT90 data set is an important new database that will support numerous scientific investigations for years to come. To support these community efforts, the MALT90 data are freely available in annual data releases. MALT90 data were released with the support of the ATNF (http://atoa.atnf.csiro.au/MALT90) shortly after each of the observing season finished and data quality checks were complete. We have built a fully automated data reduction pipeline, taking data straight from the telescope and producing publication quality images and processed cubes. Currently released data products include the raw data, processed data cubes, and moment maps. We will also make available (via the MALT90 web page, http://malt90.bu.edu/) a large database containing additional custom products such as N2H+ opacities, line parameters determined from Gaussian fits to detected lines, and derived kinematic distances.
3 SCIENCE WITH MALT90
The MALT90 data set represents a vast database for which numerous scientific investigations can be conducted. Our choice of ATLASGAL as the basic finding chart has proven to be a good one; MALT90 detected every ATLASGAL core in at least one 90 GHz molecular line. The brightest four lines, HCN, HNC, N2H+, and HCO+, are typically detected towards all clumps, and other key diagnostic lines, e.g. hot core tracers or isotopic lines, are usually detected towards the warmest, most luminous clumps. There are numerous MALT90 scientific investigations underway; here we present preliminary results from only a few.
3.1 Determining distances and Galactic structure
Distance is a key parameter to understanding the properties of high-mass star-forming dense clumps. Without distances, it is impossible to estimate such important physical quantities as mass, luminosity, and Galactic distribution. Consequently, one of the prime science goals for MALT90 is to determine distances to each of the target clumps. Fortunately, by measuring the molecular line velocities in the MALT90 data, kinematic distances to the molecular clumps can be estimated. Because distances to the emission detected via dust continuum surveys such as the ATLASGAL, BGPS, and HiGAL are unknown, MALT90 can overcome this limitation by providing distances to thousands of clumps. The accuracy of kinematic distances depends on the accuracy of the rotation curve, the degree to which non-circular motions contribute to the measured LSR velocities, and the resolution of the near/far kinematic distance ambiguity (Whitaker, S., Jackson, J.M., Rathborne, J.M., Longmore, S.N., and Foster, J., Reference Foster2013, in prep.). Nevertheless, the kinematic distance method remains the only practical means to estimate distances to thousands of star-forming regions.
Once the distances are determined, the Galactic distribution can be obtained. Since high-mass stars form in spiral arms, but typically move <100 pc from their birthplaces during their short lifetimes, high-mass star-forming clumps should delineate the Milky Way's spiral structure. Thus, MALT90 should prove to be a valuable data set for determining Galactic structure. A detailed analysis of the distances to the MALT90 targets and their Galactic distribution will be presented by Whitaker et al. (in preparation). Here we present a preliminary analysis of the data from the first and second years.
Table 2. Parameters of the MALT90 survey.

Radial velocities have been extracted for MALT90 clumps observed in the first and second seasons (Figure 3). To determine a systemic velocity for a MALT90 source, we calculated the integrated-intensity-weighted mean of the velocities from Gaussian fits to the most prominent peaks in the HCO+, HNC, N2H+, and HCN spectra averaged over the centre nine pixels of the map. To reduce sensitivity to fitting difficulties, if at least two other lines had significant detections then the HCN velocity was excluded from the calculation due to complications of self-absorption and overlapping hyperfine lines. Details can be found in Whitaker et al. (in preparation).

Figure 3. A longitude-velocity diagram of the MALT90 region. The grey scale is the CO (1-0) data from Dame et al. (Reference Dame, Hartmann and Thaddeus2001). Crosses represent the position and velocity derived from averaging the central nine pixels of each MALT90 map. Velocities are determined from integrated-intensity weighted fits of HCN, HCO+, N2H+, and HNC (1-0) (Whitaker et al., in preparation).
A comparison of these velocities with CO data from the CfA-Columbia survey (Dame, Hartmann, & Thaddeus Reference Dame, Hartmann and Thaddeus2001) shows that the dense clumps are largely confined to the brightest CO emission features, such as the ‘molecular ring’. Nevertheless, the distribution of dense clump velocities differs significantly from the CO spectrum averaged over the surveyed region (Figure 4). The distribution of the dense clumps’ velocities has sharp peaks near −5, −40, and −52 km s−1, whereas the CO spectrum is much smoother. The simplest interpretation is that the dense clumps are confined to spiral arms, but the CO is more widespread throughout the Galactic disk.

Figure 4. A histogram of the number of MALT90 sources that have a particular LSR velocity. The black spectrum in the background represents the CO (1-0) spectrum obtained by averaging together all positions in the Columbia-CFA CO survey (Dame et al. Reference Dame, Hartmann and Thaddeus2001) in the MALT90 region. The sharp concentration of sources at particular LSR velocities indicate Galactic spiral arm structure (Whitaker et al., in preparation).
3.2 Chemical variation
A second key goal of the MALT90 survey is to investigate the chemical evolution of dense clumps. Chemical models of clumps suggest that the abundances of different molecular species change dramatically with time, and thus can potentially indicate the clump's evolutionary phase (e.g. Sanhueza et al. Reference Sanhueza2012). An analysis of the first year's MALT90 data finds significant chemical evolution of the star-forming clumps (Hoq et al. Reference Hoq2013). A particularly surprising result shows interesting variations in the N2H+ abundances. For some sources, the HCO+, HCN, and HNC(1-0) lines are strong, but the N2H+ (1-0) line is significantly weaker. For others, however, the N2H+ (1-0) line is strong, but the HCO+, HCN, and HNC (1-0) lines are weaker. Two examples of these chemically anomalous sources are shown in Figures 5 and 6. Although optical depth effects may account for these apparently chemically extreme sources, in at least some cases it is clear that the chemical abundances among these four molecular species vary significantly. The reader is referred to Hoq et al. (Reference Hoq2013) for details. Barnes et al. (Reference Barnes, Ryder, O'Dougherty, Alvarez, Delgado-Navarro, Hopkins and Tan2013) have also found significant HCO+/N2H+ variation in high-mass star-forming regions that they attribute to evolutionary effects as the clumps form massive stars.
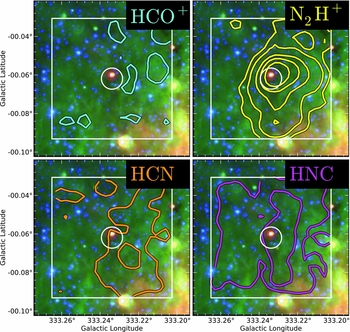
Figure 5. MALT90 images of the ATLASGAL continuum source G333.234-00.062. The colour images are GLIMPSE/MIPSGAL 3-colour images with blue = 3.6 μm, green = 8.0 μm, and red = 24 μm. The contours represent integrated intensity molecular line emission from MALT90, with HCO+ (1-0) in cyan (upper left), N2H+ (1-0) in yellow (upper right), HCN (1-0) in orange (lower left), and HNC (1-0) in pink (lower right). Contour levels are drawn at signal-to-noise levels of 1.5, 3, 7, 11, and 17. This is an example of a source with strong N2H+ emission, but weak or absent HCO+, HCN, and HNC emissions. Since the maps were taken simultaneously, the variations in intensity are real and not due to calibration errors. The circle represents the Mopra FWHM beam.

Figure 6. MALT90 images of the ATLASGAL continuum source G353.229+00.675. The colour images are GLIMPSE/MIPSGAL 3-colour images with blue = 3.6 μm, green = 8.0 μm, and red = 24 μm. The contours represent integrated intensity molecular line emission from MALT90, with HCO+ (1-0) in cyan (upper left), N2H+ (1-0) in yellow (upper right), HCN (1-0) in orange (lower left), and HNC (1-0) in pink (lower right). Contour levels are drawn at signal-to-noise levels of 1.5, 3, 7, 11, and 17. This is an example of a source with weak or absent N2H+ emission, but strong HCO+, HCN, and HNC emissions. Since the maps were taken simultaneously, the variations in intensity are real and not due to calibration errors. The circle represents the Mopra FWHM beam.
3.3 Comparison with extragalactic observations
Understanding Galactic high-mass star formation is critical for interpreting observations of galaxies. Luminous high-mass stars dominate the stellar population observable at large distances. Moreover, the early universe was characterised by intense high-mass star formation (e.g. Hughes et al. Reference Hughes1998). Star formation in external galaxies is often characterised by the ‘Kennicutt-Schmidt law’ (Schmidt Reference Schmidt1959; Kennicutt Reference Kennicutt1998), an empirical correlation between the surface gas-mass density of a galaxy and the local star formation rate, typically averaged over at least 100 pc scales. On several kpc scales, comparable to the size of galactic disks, a correlation is found between the far-IR luminosity (a measure of star formation rate) and the luminosity of CO line emission (a measure of molecular gas content). Gao & Solomon (Reference Gao and Solomon2004) found an even better correlation between IR luminosity and HCN luminosity. Because HCN has a higher dipole moment than CO, it requires denser gas (n(H 2)>3 × 104 cm−3) to excite its J = 1 − 0 transition. Gao & Solomon (Reference Gao and Solomon2004) propose that the better correlation with HCN than with CO arises because star formation occurs only in the dense gas, which HCN traces better than CO. More diffuse gas traced by CO does not directly participate in star formation, and thus is more poorly correlated with FIR emission. We aim to understand the physical origin for this HCN-IR correlation by studying it in individual dense clumps with MALT90. We can then hope to understand the basis for the HCN-IR correlation, and under what conditions and size scales it should be expected to hold. Since the Schmidt-Kennicutt law is the usual prescription for star formation in cosmological simulations, it is important to understand its origin and applicability.
Recent studies have extended this extragalactic relationship down to the scales of molecular clumps. Wu et al. (Reference Wu, Evans, Shirley and Knez2010) mapped 50 dense clumps (mostly $\mathrm{H\,{\scriptstyle {II}}}$
regions) in HCN and verified that the Gao & Solomon extragalactic HCN-IR relation also holds for the clumps. Their data hint at a deviation from the linear relation at the lowest luminosities, but this portion of the relation is poorly sampled. The Census of High- and Medium-mass Protostars survey (CHaMP; Barnes et al. Reference Barnes2011) provides measurements for an additional 303 dense clumps (Ma, Tan, & Barnes Reference Ma, Tan and Barnes2012). This larger sample also falls on roughly the same relationship as the extragalactic sample, although again there is a deviation at low luminosity.
$\mathrm{H\,{\scriptstyle {II}}}$
regions) in HCN and verified that the Gao & Solomon extragalactic HCN-IR relation also holds for the clumps. Their data hint at a deviation from the linear relation at the lowest luminosities, but this portion of the relation is poorly sampled. The Census of High- and Medium-mass Protostars survey (CHaMP; Barnes et al. Reference Barnes2011) provides measurements for an additional 303 dense clumps (Ma, Tan, & Barnes Reference Ma, Tan and Barnes2012). This larger sample also falls on roughly the same relationship as the extragalactic sample, although again there is a deviation at low luminosity.
MALT90 provides a valuable addition to the number of Galactic dense clumps mapped in HCN. In the first two seasons’ data there are 265 MALT90 clumps with solid detections in IRAS. Using this set of clumps we derived HCN luminosities and IR luminosities using the prescription of Gao & Solomon (Reference Gao and Solomon2004). Figure 7 shows the HCN versus FIR luminosities for the MALT90 clumps. The MALT90 results confirm that, for these sources, the extragalactic HCN-IR relation holds over 10 orders of magnitude, and extends to individual dense clumps. The simplest interpretation is that the basic units of star formation are dense clumps, which have a characteristic HCN/IR ratio. Hence, galaxies, which contain a large number of clumps, will have the same HCN/IR ratio, and the global HCN and IR luminosities simply reflect the total number of clumps contained by the galaxy.
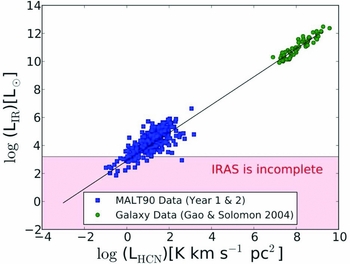
Figure 7. A plot of HCN luminosity versus far-infrared continuum luminosity. The points at the upper right (green) are for a sample of galaxies reported in Gao & Solomon (Reference Gao and Solomon2004). The points at the lower left (blue) are for individual clumps observed with MALT90. We include only those clumps that correspond to a catalogued IRAS source. The analysis for both the clumps and the galaxies is identical. The line shows the fit from Gao & Solomon (Reference Gao and Solomon2004).
This simple interpretation must be verified, however, and numerous caveats bear investigation. For example, IRAS lacks the sensitivity and angular resolution required to detect IR luminosities below 150 L⊙ for the typical MALT90 clump distance of 5 kpc. Indeed, towards many of our less luminous HCN clumps there are no IRAS sources detected. These sources are not plotted in Figure 7. Fortunately, the increased sensitivity of the Herschel HiGAL survey will allow us to derive more accurate bolometric luminosities for the fainter sources. In fact, at low luminosities we expect a deviation from the linear HCN-IR relationship, because many of our cold prestellar clumps are detected in HCN but have no protostars detected by Spitzer. There is also some evidence that the HCN-IR relationship is not constant in extragalactic systems. For instance, the giant molecular clouds in M33 have significantly less HCN than would be expected from the Gao & Solomon relation (Rosolowsky, Pineda, & Gao Reference Rosolowsky, Pineda and Gao2011).
In the future, we will investigate the HCN-IR correlation as a function of evolutionary state and of bolometric luminosity. We will also investigate whether other molecules such as HNC, N2H+, or HCO+ show a tighter correlation, and whether the correlation improves when HiGAL bolometric luminosities are used. If so, these molecules may be more useful probes of the dense gas and star-formation content of external galaxies. Our ultimate goal is to understand why the extragalactic HCN-IR relationship exists, and how to interpret these global measurements in the context of clump properties.
3.4 The Link to ALMA
MALT90 will be valuable not only in its own right, but also as the definitive finding chart of high-mass clumps to identify key ALMA targets. With its unprecedented large sample of clumps, MALT90 can also identify rare, extreme objects that demand ALMA's unique capabilities. While previously identified as unusual, the clump G0.25+0.02, which has the potential to form a massive Arches-like cluster but shows little star formation, has recently gained attention as it may be unique in the Galaxy (Longmore et al. Reference Longmore2012). MALT90 and APEX maps of the kinematics and morphology of its dense gas reveal that it is externally heated, centrally condensed, and that it has already begun to fragment (Rathborne, J.M., et al., in prep.). Indeed, recent ALMA cycle 0 observations reveal several tens of small, dense fragments (~0.1 pc, 106 cm−3) consistent with this idea (Rathborne, J.M., et al., in prep.).
The clumps identified by ATLASGAL and observed by MALT90 are key laboratories to study clump fragmentation and to test the theories of monolithic collapse and competitive accretion at high angular resolution. Because of the large sample sizes, MALT90 should uncover several examples of rare ‘transition objects’ that bridge the gap between the major stages in clump evolution. Most likely, MALT90 will discover additional clumps with surprising and unanticipated properties that will need ALMA to explain. Assuming that the line emission contains structures on scales smaller than the Mopra beam, ALMA will be able image any core detected in MALT90 at 1 arcsec with excellent signal-to-noise.
4 SUMMARY
MALT90 is a large survey that has obtained small maps in 16 molecular lines near 90 GHz towards more than ~2 000 dense clumps across the Galaxy. The superior capabilities of the Mopra Telescope, coupled with the identification of huge numbers of dense clumps from recent Galactic plane surveys, now allow, for the first time, a large-scale molecular line survey of thousands of dense molecular clumps.
The primary goal of MALT90 is to characterise the physical and chemical evolution of dense, high-mass star-forming clumps. The clumps were selected from the ATLASGAL point source catalog based on their IR emission so that roughly equal numbers of prestellar clumps, protostellar clumps, $\mathrm{H\,{\scriptstyle {II}}}$
regions, and PDRs were observed. Because the maps have excellent spatial (38 arcsec) and spectral (0.11 km s−1) resolution, the data reveal a wealth of information about the clump's morphologies, chemistry, and kinematics.
$\mathrm{H\,{\scriptstyle {II}}}$
regions, and PDRs were observed. Because the maps have excellent spatial (38 arcsec) and spectral (0.11 km s−1) resolution, the data reveal a wealth of information about the clump's morphologies, chemistry, and kinematics.
We have described the motivation, telescope and observing modes, molecular lines selected, identification of suitable high-mass star-forming clumps, the data reduction procedure, and data release for the MALT90 survey. Moreover, we have highlighted a few preliminary science results from the survey although many more are expected in the coming years. All raw data and processed cubes and moment maps for the sources observed as part of MALT90 are publicly available through the Australia Telescope Online Archive (ATOA; http://atoa.atnf.csiro.au/).
MALT90 is the largest database of molecular line emission towards high-mass star-forming clumps and, thus, will provide a valuable data set for studies of these regions. Moreover, the survey also provides a definitive source list for future ALMA observations of high-mass star-forming dense clumps.
ACKNOWLEDGEMENTS
JMJ gratefully acknowledges support from the US NSF grant AST-1211844. NL's postdoctoral fellowship is supported by a CONICYT/FONDECYT postdoctorado, under project no. 3130540. NL acknowledges partial support from the ALMA-CONICYT Fund for the Development of Chilean Astronomy Project 31090013. NL, LB, GG, and DM gratefully acknowledge support from the Center of Excellence in Astrophysics and Associated Technologies (PFB-06) and Centro de Astrofísica FONDAP 15010003.


