In recent years, the EU has highlighted the importance of encouraging healthier and safer living among the population. Related to this, the European Food Safety Authority has a central role in promoting and coordinating standardized data collection and harmonized risk assessment methodologies as a basis to ensure safe food consumption and healthy diets in Europe( 1 ). Food consumption data from dietary surveys are available in most European countries; however, data obtained at national level cannot be directly compared due to differences in how information is collected. In February 2010, members of the European Food Safety Authority’s Advisory Forum signed a declaration supporting the establishment of a pan-European food consumption survey( 2 ). The EU-Menu project is one of the results of recognizing the need for having harmonized and accurate data collection on food consumption across Europe, allowing improvement of the consistency and reliability of exposure assessments.
In 2002, the EU-funded European Food Consumption Survey Method (EFCOSUM) project published recommendations on methods for monitoring European food consumption in national representative samples of adults( Reference Brussaard, Lowik and Steingrimsdottir 3 ). More recently, the European Food Consumption Validation (EFCOVAL) project (http://www.efcoval.eu) was funded as a continuation of the EFCOSUM project with the main purposes to develop further and validate a European food consumption survey method using standardized repeated 24 h dietary recall, applying the EPIC-SOFT( Reference Slimani, Ferrari and Ocke 4 ) software as a tool for assessing dietary intake in European countries. The EFCOSUM group highlighted that estimation of the portion size consumed is one of the sources of error in collecting food intake data( Reference Biro, Hulshof and Ovesen 5 ). Weighing of the served portion is considered the most accurate method for measuring food intake. However, this method has some disadvantages such as being time consuming, costly and requiring a high level of cooperation from respondents( Reference Rutishauser 6 ). An alternative to weighing the food portion size is to use a variety of visual aids to help participants estimate the amounts of food consumed more accurately during dietary recall interview. These quantification methods include household measures, abstract shapes and food photographs, among others( Reference Byrd-Bredbenner and Schwartz 7 – Reference Venter, MacIntyre and Vorster 9 ). Being easily adaptable to local conditions, cheap, reproducible and transportable are the main advantages of food photographs, in comparison to other portion size estimation tools( Reference Huybregts, Roberfroid and Lachat 10 ), and the benefits of using photographs to help individuals estimating portion sizes are reported in several studies( Reference Frobisher and Maxwell 11 – Reference Martin, Nicklas and Gunturk 14 ). Three individual psychological elements can affect the reported portion size: perception, conceptualization and memory( Reference Nelson, Atkinson and Darbyshire 15 ). Perception involves the ability of a subject to relate the real quantity of a presented food to an amount depicted in a photograph. Conceptualization concerns a subject’s ability to make a mental construct of an amount of previously consumed food and to relate that to a portion displayed on a photograph. Memory affects the precision and validity of the conceptualization.
Photo series for food portion estimation should be validated before being included in a picture book. Despite several validation methods having been described in the literature, no gold standard method to validate food picture books has been established( Reference Cypel, Guenther and Petot 8 , Reference Subar, Crafts and Zimmerman 13 , Reference Nelson and Haraldsdottir 16 – Reference Bouchoucha, Akrout and Bellali 20 ).
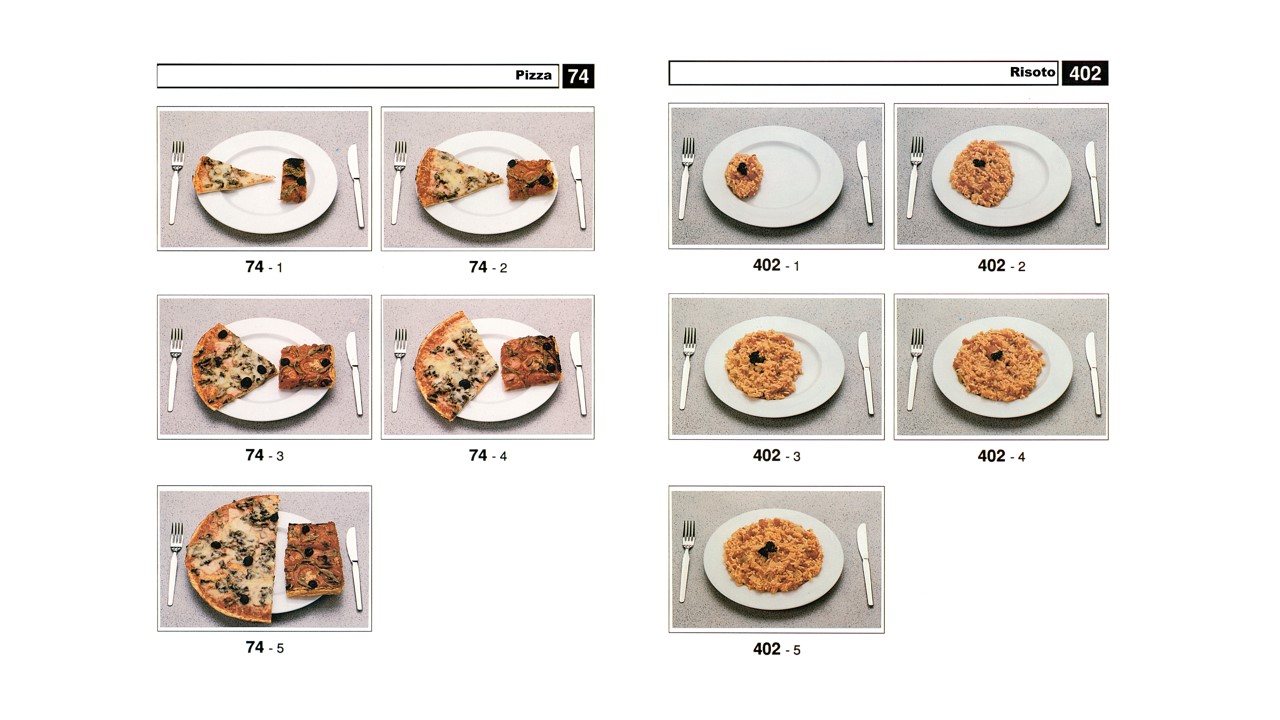
The present study was performed within the Pilot study in the view of a Pan-European dietary survey – Adolescents, adults and elderly (PILOT-PANEU) project( Reference Ambrus, Horváth and Farka 21 ). The project’s goals were to develop, test and evaluate the applicability of tools and procedures for conducting a dietary survey. The PANEU partners collected 24 h dietary recall data within a pilot survey and developed country-specific picture books for assisting estimation of the food consumption amount, by selecting up to eighty photo series out of the 140 from the original EPIC-Soft picture book( Reference Van Kappel, Amoyel and Slimani 22 ). Each country could add new photo series if needed. The picture book was developed in the context of the European Prospective Investigation into Cancer and Nutrition (EPIC) study in 1994/95( Reference Van Kappel, Amoyel and Slimani 22 ). The foods and portions included were selected using data from ten European countries involved in the EPIC study. Data used to develop the picture book, including the portions, were based on pilot studies developed at the beginning of the EPIC study. For example, pilot data were used to choose the lower and higher weight extremes for each series of photos, based on the daily consumption( Reference Kaaks, Slimani and Riboli 23 ).
The aim of the present study was to validate the EPIC-Soft picture book for portion size estimation among adolescents, adults and elderly. Two approaches were addressed: (i) ‘perception’, where prepared food portions on standard plates were estimated using EPIC-Soft food photo series; and (ii) ‘memory’, using the same photos series to estimate the food portions self-served (and in most of the cases also consumed) one hour before the estimation.
Methods
Subjects
As previously described( Reference Ambrus, Horváth and Farka 21 ), five PANEU countries were involved in the validation study: Bulgaria, Finland, Germany, Hungary and Portugal. Participants were invited by the most convenient way in each country. We aimed to include adolescents, adults and elderly. For recruitment, researchers’ networks were used (e.g. friends, social networks, office intranet). Each invited person was asked to bring persons (friends or relatives) to participate in the study. To recruit adolescents, schools were also involved. In Bulgaria, participants were schoolchildren from the 19th High School of Sofia, university students from the Department of Hygiene, Medical Ecology and Nutrition at the Medical University of Sofia, employees from the National Centre of Public Health and Analyses, and individuals from the lists of general practitioners from the city of Sofia. In Finland, volunteers from a working unit at the Division of Welfare and Health Promotion were invited to participate. The invitation also addressed the children or adolescents belonging to the family of the staff. In Germany, participants were recruited via personal contact, posters and leaflets in the canteen of the Federal Institute for Risk Assessment; adolescents from schools in the vicinity, from the ‘Girls and Boys Day’ of the Federal Institute for Risk Assessment and from Berliner Schüler Unternehmen were also recruited. In Hungary, participants were invited from the Budapest Business School and from the Hungarian Food Safety Office staff. Adolescents were also recruited from a general school. In Portugal, volunteers were recruited by an email sent to students, professors and workers on a mailing list of the University of Minho. They were invited to participate and were asked to bring friends and family of different age groups to their own.
Sample size was calculated through the equation proposed by Nelson and Haraldsdottir( Reference Nelson and Haraldsdottir 16 ). To detect a difference of 25 % with a significance of 5 %, power of 80 % and assuming a CV of 50 %, a minimum of thirty-two independent portion estimates (individuals carrying out the estimation) were calculated for the perception method and sixty-four for the memory method. The final sample size by country was: Bulgaria (n 103), Finland (n 34), Germany (n 69), Hungary (n 62) and Portugal (n 77).
Picture book
For validation purposes, twenty-three food items associated to twenty-three photo series (approximately 25 % of the photos in the picture book) were allocated to the five participating countries to reduce the number of validations needed. Food items were allocated to each country according to their degree of association with the country’s typical gastronomy and by checking food items listed in the Food Propensity Questionnaire developed by the PILOT-PANEU project. Each partner validated seven photo series (most of them were tested in two countries), corresponding to seven food items. For the portion estimation based on perception, three portion sizes from each food series were randomly selected. For the portion estimation based on memory, the same food items were grouped into two meals. The weight in grams of the portions for each photo series can be seen in the online supplementary material, Supplemental Table 1. A validation protocol, registration form and record sheets were developed to assure comparable data collection in the five countries.
Procedures for validation
In Bulgaria, Finland and Portugal the food portions were estimated by using a scale( 24 ) presenting the options 1–6, each number corresponding to a portion in the EPIC-Soft picture book. The scale had a middle point between adjacent portions (e.g. 3·5 represents a portion between the 3rd and 4th portion) and the option of choosing a portion lower or higher than the smallest or biggest portion of the photo series, respectively. In Germany and Hungary the participants used a decimal scale between adjacent food portions, as described before( Reference Szenczi-Cseh, Horváth and Ambrus 25 ). The scale was extended with five decimals below the smallest quantity and five decimals above the biggest portion.
Perception test
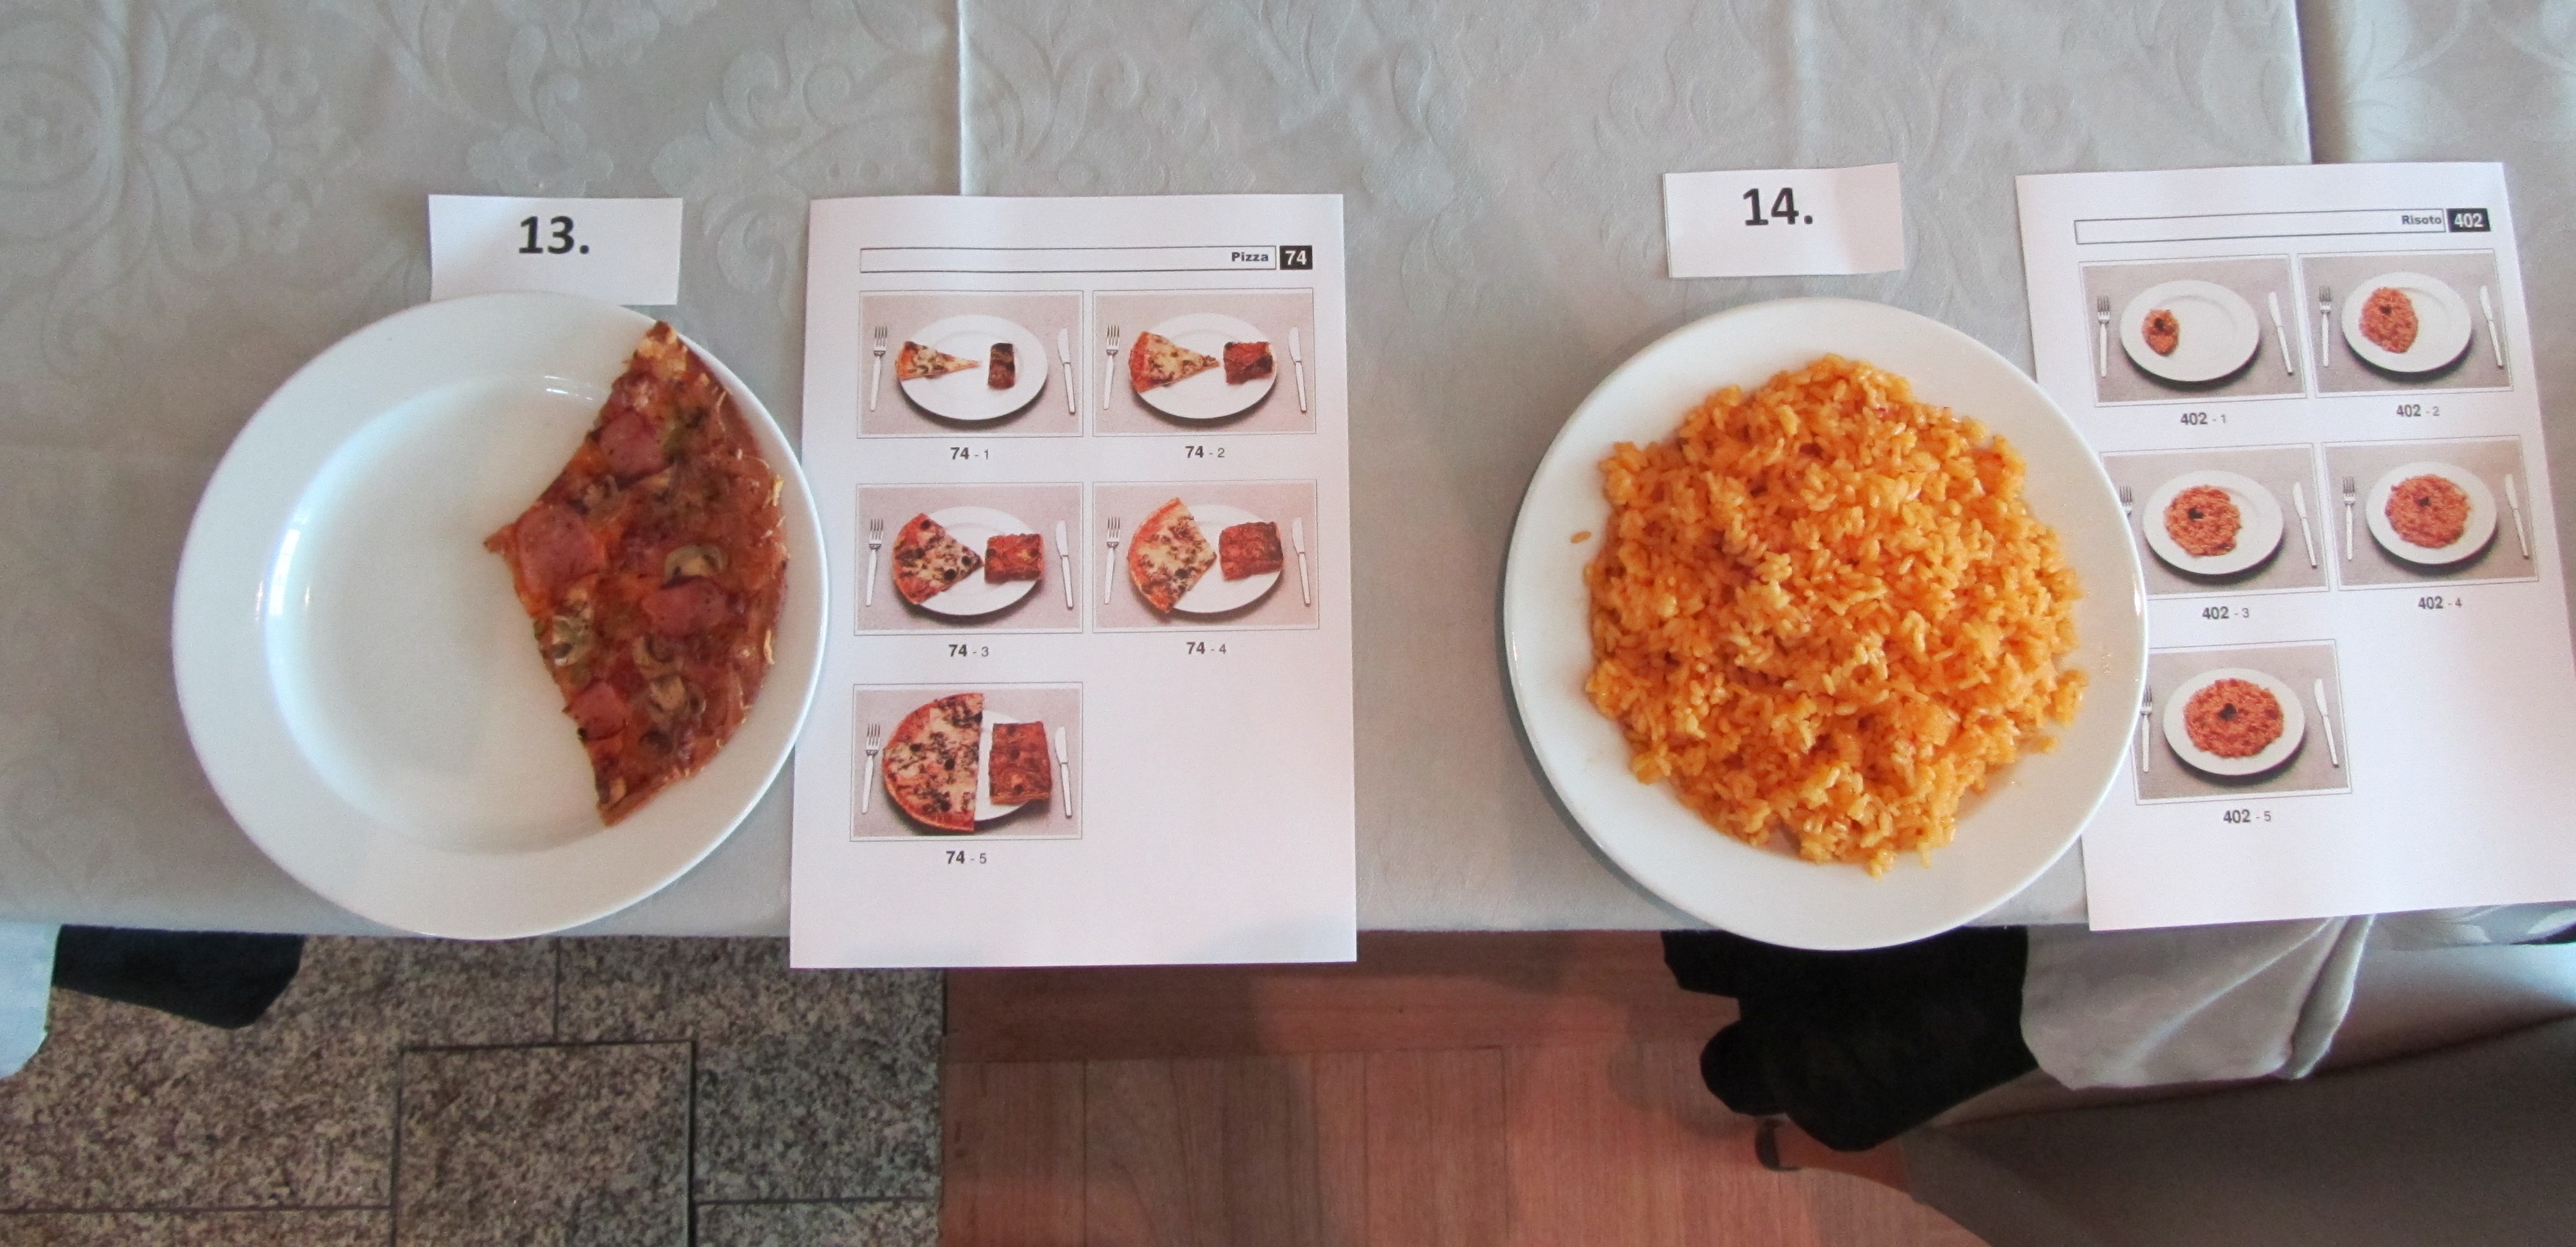
Weighed food servings were presented to subjects who were asked to compare them with food portions shown in photo series and mark the results on a record sheet. Each food portion was served on a white plate of 26 cm diameter according to the International Agency for Research on Cancer’s guidelines for the preparation of the EPIC-Soft picture book( Reference Crispim, Nicolas and Freisling 26 ). The twenty-one portions were randomly distributed on a table, except in the case of Hungary, which placed the three test portions together. The respective printed photo series were placed on the table next to the food item (see online supplementary material, Supplemental Figures 1 and 2). For each food item, the weight of the food serving was set in advance and was kept constant throughout the study. For the photo series that presented two or more different formats of the same food (‘cheese, pieces’, ‘pizza’, ‘mushrooms’, ‘grapes’ and ‘omelette/scrambled eggs’), only one format was displayed on the plate. For the photo series for ‘fish fillets’ and ‘fish slices’, the foods displayed were not exactly the same (e.g. the size of the fish was different).
Memory test
The memory method tests were conducted in Germany, Hungary and Portugal. The food items validated through this method were the same ones used in the perception method. Participants were instructed to serve themselves the amount of food that they would normally consume. The served food was weighed using a digital weighing scale and recorded by the study researchers. After that, the participants were involved in different activities for about an hour, followed by estimation of the amount of food served with the help of the same picture series that were used for the perception method, and marked on the record form.
Statistical analyses
Perception method
To test components of variance in the reported portions we performed mixed-effects models( Reference McGraw and Wong 27 ). By calculating the variance components, it is possible to determine which factors explain the difference between observers. The components of the model were the specific portion size shown to the participant in each country (designated by ‘plate’), the observer (participant) and the type of food. Because among different foods, different portions were shown to participants, the mixed-effect models were also adjusted for the mean of the portions shown to the participants for each food.
To assess validity of the study, the mean difference between the portion reported by the participant and the real portion of the presented food servings was calculated (reported portion minus shown portion). To test if the differences were acceptable, the mean and sd were calculated, as well as the percentage of observers who selected the correct, adjacent or distant picture. The differences were considered acceptable if the mean difference between reported and shown portions was equal to or lower than 0·5 and if the sd was equal to or lower than 1. The portion was classified has being overestimated (or underestimated) if the mean difference was higher than 0·5 (or lower than −0·5) and if the sd was equal to or lower than 1. If the difference had an sd higher than 1 portion, the estimation was considered ‘not precise’. To assess agreement in the reported portions among observers, for each food, the intraclass correlation coefficient (ICC) by observer and the respective standard deviation of measurement error (SDME) were calculated.
Memory method
To test the components of variance in the memory study we also performed mixed-effects models, adjusted for the mean portion of each food served by the participants. The variance components were the observer (participant) and the type of food included in the study. To test the validity in the memory study, the mean and sd of the reported and served food portions were calculated, as well as the difference between the reported and served portions. To test if the differences were statistically significant, the paired Wilcoxon test was used. The ICC and the respective SDME were also calculated to assess the agreement between the reported portions and true pictures, for each food.
All statistical analyses were performed using the statistical software package IBM SPSS Statistics version 19.0 and the software R version 2.12.1.
Criteria for classification of bias
To analyse the mean difference between the real portions and reported portions, the following criteria were defined: differences lower than 0·25 portion indicate no bias; differences between 0·25 and 0·5 portion indicate low bias; differences between 0·5 and 1·0 portion indicate moderate bias; and differences higher than 1·0 portion indicate large bias. Guidelines for interpreting ICC statistics suggest that values of 0·81–1·00 indicate almost perfect agreement, 0·61–0·80 substantial agreement, 0·41–0·60 moderate agreement, 0·21–0·40 fair agreement, and values less than 0·21 indicate a poor or slight agreement( Reference Landis and Koch 28 ). If SDME is lower than 0·5 portion it indicates no error, if it is between 0·5 and 1·0 portion it indicates moderate error, and if it is higher than 1·0 portion it indicates large error.
Results
Participant characteristics
Table 1 shows the characteristics of the whole sample participating in the validation study. A total of 345 individuals (59 % female) participated in the perception study and 208 individuals (58 % female) participated in the memory study. The mean age of participants was 34 years, ranging from 8 to 77 years. About 70 % of participants had high education.
Table 1 Characteristics of the sample (all countries), by age and sex groups

* Nine participants with missing information on age.
† The level of education was asked only of participants aged ≥18 years.
The weight in grams of the food shown (perception study) or served (memory study) as well as weight estimated by the participants can be checked in the online supplementary material (Supplemental Table 2).
Perception study
Table 2 presents the percentage of participants choosing the correct, adjacent or distant picture when comparing reported and shown portions. The percentage of participants choosing the correct picture varied from 18 % for pieces of cheese to almost all for estimations of ratatouille (96 %). Between 0 and 30 % of the participants chose a distant picture (difference of more than 1 portion for each food).
Table 2 Percentage of participants choosing the correct, adjacent or distant picture when comparing food portions with photo series (perception study)
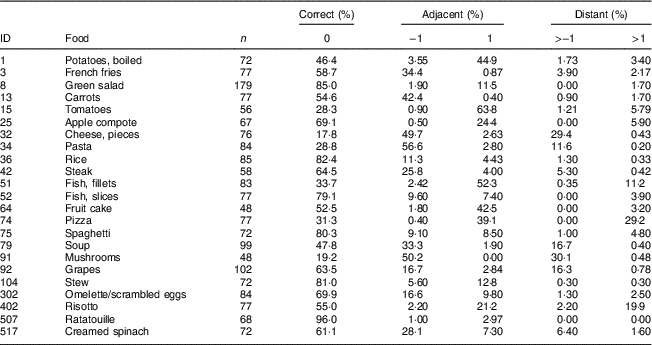
ID, identification number of each photo series in the EPIC-Soft picture book.
Sources of variance in reported portions
Table 3 presents the components explaining the variance found in the reported portion. The main source of variance in the measurement was the plate (the specific portion size shown to the participant in each country; 67·8 %). The results suggested a small systematic higher or lower estimate for some foods even after adjusting for the mean portion shown for each food (5·3 %). The SDME (=0·611) can be classified as moderate. The interaction between food and observer explained a small part (3·8 %) of the total variance.
Table 3 Components of variance in the reported portion after adjusting for the mean portion shown in each food (perception study)

SDME, standard deviation of measurement error.
* Variance of each component divided by the total variance.
Validity: agreement between shown and reported portions
Overall, the agreement between the portions shown and reported was substantial (ICC=0·805). Table 4 describes the portions shown and reported, the respective difference and the agreement among observers by food. For several foods, differences between reported and shown mean portions (underestimation and overestimation) were detected. For the majority of foods, the observer ICC (agreement among observers) was substantial or excellent and the SDME for each food ranged from 0·5 to 1·0 (moderate error). The pictures evaluated were considered acceptable and precise enough (no or small bias) to estimate portion size for green salad, apple compote, rice, steak, slices of fish, spaghetti, stew, omelette/scrambled eggs and ratatouille. Photo series depicting French fries, carrots, pieces of cheese, pasta, soup, mushrooms, grapes and creamed spinach were all underestimated. On the other hand, pictures showing boiled potatoes, tomatoes, fish fillets, fruit cake, pizza and risotto were all overestimated. Although boiled potatoes, French fries, carrots, tomatoes, fruit cake, soup, grapes, risotto and creamed spinach showed a moderate bias, a moderate to almost perfect agreement among observers was described. With the exceptions of the picture series of green salad, carrots, pieces of cheese, pasta, fish filets, fish slices, pizza, mushrooms and omelette/scrambled eggs, the agreement among observers was substantial to almost perfect (0·61 < ICC < 1·00). Additionally, except for pictures of grapes, all picture series that had the same portion of food presented in different formats (e.g. round and square pizza slice) presented low agreement among observers.
Table 4 Shown and reported food portions, the respective difference and the agreement among observers by food (perception study)

ID, identification number of each photo series in the EPIC-Soft picture book; ICC, intraclass correlation coefficient; SDME, standard deviation of measurement error.
* Established series category based on mean and SD of difference: acceptable, │mean difference│≤0·5 and SD≤1; overestimation, │mean difference│>0·5 and sd≤1; underestimation, │mean difference│ <−0·5 and SD≤1; not precise, SD>1.
† Classification of bias: no bias, │mean difference│ <0·25 portion; low bias, │mean difference│ between 0·25 and 0·5 portion; moderate bias, │mean difference│ between 0·5 and 1·0 portion; large bias, │mean difference│ >1·0 portion.
‡ Fair agreement among observers.
§ Poor agreement among observers.
Memory study
Table 5 shows that the major source of variance after adjusting for the served mean portion was the food (49·0 %); these results suggested a large systematic higher or lower estimation for different foods and that the observer explained a small part of the variance (8·1 %).
Table 5 Components of variance in the reported portion after adjusting for the served mean portion of each food (memory study)

SDME, standard deviation of measurement error.
* Variance of each component divided by the total variance.
Stratification of the results by food confirmed that several foods showed low agreement between served and reported portions (Table 6). The overall agreement between the served and the reported portions was lower than in the perception study (ICC=0·536). Only carrots, apple compote, steak, fish slices, fruit cake and creamed spinach showed substantial agreement, while green salad, fish fillets, spaghetti, stew, omelette/scrambled eggs and ratatouille showed moderate agreement. In general, overestimated (or underestimated) foods in the perception approach were similarly overestimated (or underestimated) in the memory study. Considering the mean differences between reported and served portions for the memory study, the pictures were considered acceptable and precise enough to estimate portion size for French fries, green salad, carrots, apple compote, steak, slices of fish, fruit cake, spaghetti, grapes, stew and ratatouille.
Table 6 Served and reported food portions, the respective difference and the agreement between served and reported portions by food (memory study)

ID, identification number of each photo series in the EPIC-Soft picture book; ICC, intraclass correlation coefficient; SDME, standard deviation of measurement error.
* Established series category based on mean and sd of difference: acceptable, │mean difference│≤0·5 and sd≤1; overestimation, │mean difference│>0·5 and sd≤1; underestimation, │mean difference│ <−0·5 and sd≤1; not precise, sd>1.
† Classification of bias: no bias, │mean difference│ <0·25 portion; low bias, │mean difference│ between 0·25 and 0·5 portion; moderate bias, │mean difference│ between 0·5 and 1·0 portion; large bias, │mean difference│ >1·0 portion.
‡ Fair agreement among observers.
§ Poor agreement among observers.
Discussion
Accurate portion size estimation is a key to a successful data collection on food intake. However, estimation of consumed portion sizes is a challenging task for subjects. The present study evaluated the validity of twenty-three food photo series. The results of this validation study carried out in five European countries showed that overall the picture series from the so-called EPIC-Soft picture book could be used to estimate food consumption in dietary surveys. Overall, the agreement decreased as the appearance of the food displayed differed from the food in the picture (e.g. fish, slices). The correct picture chosen by the participants ranged from 18 % (cheese) to 96 % (ratatouille). Between 0 and 30 % of the participants chose a distant picture. Currently there are no existing guidelines regarding the minimum level of acceptable accuracy for a picture to be used. A previous study( Reference Hernández, Wilder and Kuehn 29 ) concluded that there is still a lack of consensus concerning expression of error rates and that precision in portion size estimation is not yet a realistic expectation. Our results seem to be close to the previous studies. In another study validating a food picture book to be used among children in pan-European national dietary surveys, it was described that between 37 and 71 % of the participants chose the correct picture and between 1 and 16 % of the participants chose a distant picture( Reference Trolle, Vandevijvere and Ruprich 18 ). In another study among Mexican adolescents, 28·7 % of the foods were correctly quantified using a food picture book( Reference Bernal-Orozco, Vizmanos-Lamotte and Rodriguez-Rocha 30 ). In Europe, a study serving predefined portions showed that 50 % of all estimations performed by adult volunteers (aged 25–65 years) were exactly correct( Reference Ovaskainen, Paturi and Reinivuo 17 ).
Regarding the overall results only a tendency of under- or overestimation of portions was not observed, contrary to some previous studies that described a clear pattern of under- or overestimation( Reference Frobisher and Maxwell 11 , Reference Hernández, Wilder and Kuehn 29 , Reference Turconi, Guarcello and Berzolari 31 ). However, analysing each photo series, it was found that the overestimation occurred more in smaller portions, while the underestimation occurred more in larger portions. This may simply be the result of having a greater number of photos for smaller portions than for larger portions in general and the tendency that subjects have of choosing something in the middle.
Concerning the perception study, the agreement found between the portions shown and reported was substantial and the bias was low, meaning that the food pictures were in general validly perceived. Typically, overestimated foods in the perception approach were similarly overestimated in the memory study. The same was true for underestimated foods. In the perception study, the main source of variance in the measurement method was the plates, which indicates that the major source of variance in the measurement was due to differences between portions on each plate. Consequently, observers were substantially successful in discriminating different portions. The minor differences found across countries did not seem to have affected the results of the validation study.
The variance in portion size estimation was small, reflecting small systematic differences among observers. This result highlights that there might not be significant differences between countries. On the other hand, the variance related to the measurement error was relatively large, suggesting that other important factors could explain the variance in the reported portions. One possible explanation for the low agreement is the fact that, for most foods, the mean portions tested in the perception study were far from the middle pictures of the photo series (between 2·5 and 3·5). From a total of ten food items with portions shown between 2 and 3, eight food items had an ICC higher than 0·41. From the remaining food items only four in thirteen had an ICC higher than 0·41. This results in a relative risk of 2·6 (95 % CI 1·09, 6·22) of a picture having a higher agreement if the mean portion shown has been situated between 2 and 3. This means that the original portions from the picture book presented a deviation since the portions of each food were chosen to quantify daily consumption and not quantity by meal occasion( Reference Van Kappel, Amoyel and Slimani 22 , Reference Kaaks, Slimani and Riboli 23 ).
The differences between real and reported portions in both the perception and memory study were compared and overall overestimated foods in the perception approach were similarly overestimated in the memory study. The same is true for underestimated foods. The interaction between food and observer explained a small part of the total variance; this means that observers did not systematically estimate better (or worse) some foods than others.
The perception method involved only the direct comparison of the portions of food, prepared in advance, with the portions shown on the pictures. The results of the memory method provided additional information for estimation of the uncertainty of a dietary recall methodology( Reference Nelson, Atkinson and Darbyshire 15 ). Data obtained from the latter type of study provide a different sort of information and a more realistic estimation for the uncertainty of reported portion sizes during surveys. This method is intended to simulate the dietary assessment method used in surveys, where people recall the foods eaten 24 h before. In the memory study, there were significant differences when comparing served and reported food portion sizes, where some foods such as potatoes, tomatoes and pizza were overestimated and others like carrots, pasta and mushrooms were underestimated.
Compared with perception results, the variance explained in the memory study by portion was lower and the error was higher. The error was higher in the memory study, increasing from 0·59 to 0·95 portions, and the agreement between served and reported portions was lower.
Picture series with low agreement and large differences (difference between reported and real portions greater than 1 portion) need to be replaced or other quantification method should be applied to these foods. With exception of the picture series of green salad, carrots, pieces of cheese, fish, pizza, mushrooms and omelette/scrambled eggs, the agreement among observers was in general substantial. The agreement seemed to decrease as the appearance of the food presented differed from the food in the picture (e.g. slices of fish). Additionally, except for grapes, a decreased agreement among observers was observed in all picture series that had the same portion of food presented in different formats (e.g. round and square pizza slice or different pieces of cheese).
Strengths and limitations
The described multicentre validation study was conducted in five different countries in Europe. This makes it more acceptable to generalize the results to other European countries. The inclusion of the conceptualization and memory dimensions, in addition to perception, is also a methodological strength as the food picture series are intended to be used to aid food quantification during recall methods. As there is no defining criterion for the level of acceptable accuracy in the evaluation of the picture series, we opted to evaluate the performance of each picture series based on agreement among observers and bias between reported and real portions. Another strength was to choose three random portions from each picture series that allowed to validate both pictures depicting small and large portions and to describe the tendency to over- or underestimation.
The study should have been performed with representative samples of adolescents, adults and elderly to have a clear idea about the range of bias in overall dietary intake using the food picture books. As that was not feasible in all study centres, convenience samples were drawn. Elderly and males in general were under-represented in our samples, which might have influenced the results. Also, the majority of the participants had high education, which could also have some influence on the accuracy of reported data. However, as the variance in the portion size’s estimation was small among observers, we believe that these differences in sample did not greatly influence the results. Moreover, under-reporting might be an issue among obese participants. We had information regarding BMI of the participants for Germany (13 % of obesity) and Bulgaria (9 % of obesity), and performed a sensitivity analysis by excluding the obese participants in the memory study. We found similar results, and the mean differences between reported and real portion sizes and agreement between participants did not change significantly. Taking this into account, and that there were no statistical differences between the two countries regarding the distribution of BMI categories, we believe that the under-reporting among obese individuals might have only a minimum effect in our results.
Conclusions
The present results confirmed that overall the picture series included in the EPIC-Soft picture book can be applied in future intake surveys for foods similar to those depicted in the pictures. However, foods with substantially different shape cannot be quantified correctly by applying the current picture series. In such cases, we recommend that new picture series should be prepared, or some corrections should be applied. Other quantification methods can be used to estimate amount of foods accurately, such as household measures or standard units.
Acknowledgements
Acknowledgements: The authors gratefully thank the participants of the validation study; all colleagues who were responsible for the realization of the PILOT-PANEU picture book validation study; Nadia Slimani and her team; and the PANCAKE project. Financial support: The work was carried out within the frame of the PILOT-PANEU project sponsored by the European Food Safety Authority (EFSA) under grant agreement CFP/EFSA/DATEX/2010/02. EFSA had no role in the design, analysis or writing of this article. Conflict of interest: None. Authorship: A.A. coordinated the PILOT-PANEU project at the international level. All authors, with exception of M.S., were involved in the design of the validation study, organized the fieldwork and performed the data collection. D.T., M.S. and S.V. were responsible for database management and statistical analyses. S.V. wrote the first draft of the paper. All authors critically revised and approved the manuscript. Ethics of human subject participation: The PILOT-PANEU project was conducted according to the guidelines laid down in the Declaration of Helsinki and all procedures involving human subjects were approved by the national ethic committees of each partner (as far as needed; e.g. Germany did not complete a food survey and took part only in picture book validation where no approval was necessary). The project was also approved by the Portuguese Authority of Data Protection. All participants were informed about the benefits and potential discomfort and written informed consent forms were signed by all participants or by legal representatives in the case of children.
Supplementary material
To view supplementary material for this article, please visit https://doi.org/10.1017/S1368980017004153