


Trans fats are associated with increased CHD risk through changes in LDL and HDL cholesterol and other mechanisms( Reference Ascherio and Willett 1 – Reference Katan 5 ). Trans configuration is generally introduced during the hydrogenation of PUFA; however, trans-fatty acids (TFA) can be formed naturally in ruminants( Reference Stender, Astrup and Dyerberg 6 ) although in small amounts. Reducing TFA content in the food supply could reduce the risk of CHD worldwide.
Increased awareness around the negative health effects of TFA has prompted the Pan American Health Organization to recommend less than 2 % trans fats in the fatty acid content of foods( 7 ). The Food and Drug Administration is considering removal of all artificial trans fats from the food supply in the USA. In Colombia, food labelling of TFA is not required but the TFA content in foods and consumer awareness are factors that influence feasibility of regulation( Reference Downs, Thow and Leeder 8 ). While studies suggest that consumers are making food-purchasing choices for health reasons, without regular monitoring these choices are misguided( Reference Baylin, Mora-Plazas and Cobos-de Rangel 9 ).
In the Colombian population, lowering intake of TFA and SFA while increasing intake of essential PUFA through consumption of vegetable oils is suggested as an appropriate intervention because intake of n-3 fatty acids is limited due to a low intake of fish( Reference Baylin, Mora-Plazas and Cobos-de Rangel 9 , 10 ). The evidence on the protective effects of α-linolenic acid, the main plant-based n-3 fatty acid, is mixed compared with that on long-chain n-3 fatty acids from fish. However, in the context of low fish intake and low intake of plant oils rich in α-linolenic acid, there is some evidence that α-linolenic acid can be highly protective for CHD( Reference Campos, Baylin and Willett 11 , Reference Baylin, Kabagambe and Ascherio 12 ). Recommending a specific type of cooking oil, however, needs to be based on up-to-date knowledge of the fatty acid composition( Reference Monge-Rojas, Colón-Ramos and Jacoby 13 ). Given that there is no mandatory labelling of TFA in Colombia, that the availability of new oils is changing rapidly and that our previous study showed some oils had higher content of TFA than recommended by WHO( Reference Baylin, Mora-Plazas and Cobos-de Rangel 9 ), we considered it important to monitor the content of oils in Bogota, Colombia.
Our objective was to determine the changes in fatty acid composition of cooking vegetable oils from 2008 to 2013 in Bogota, Colombia. Based on our previous experience in Costa Rica( Reference Baylin, Silesb and Donovan-Palmera 14 ) we hypothesized that the content of TFA in cooking oils in 2013 would be lower due to voluntary reductions by the industry.
Experimental methods
Data collection
We obtained samples of all commercially available oils reported in a survey of low- and middle-income families with a child participating in the Bogota School Children Cohort (n 3202)( Reference Isanaka, Mora-Plazas and Lopez-Arana 15 ). Using questionnaires we asked the families what type of oil they were consuming in 2008 and 2013. Oils were purchased from the major supermarkets in Bogota and from neighbourhood stores were the children participating in the cohort were living. Supplemental Table 1 (see online supplementary material) lists the brands sampled in 2008 and 2013 by type of oil. This was a convenience sample that tried to capture all the oils consumed by our study population. Our population was representative of the low- to middle-income population in Bogota. Samples were aliquoted into 2 ml glass vials with Teflon caps and stored at −80°C until analysis at the Biomarker Analysis Laboratory at the Harvard School of Public Health.
Table 1 Fatty acid composition (% of total fatty acids) of oils in Colombia analysed in 2013
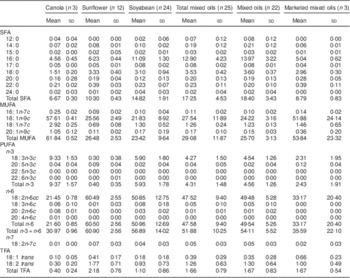
TFA, trans-fatty acids.
Operational definitions
The number of samples analysed for each type of oil was as follows: three for canola oil, one for corn oil, twelve for sunflower oil, twenty-four for soyabean oil and twenty-five for mixed oil. Mixed oils are mixtures of soyabean oil, corn oil and palm oil mostly, and are marketed as vegetable oil. Although we report fatty acid values for the twenty-five mixed oils together, three of them were also separated from the mixed oil descriptive statistics and referred to as marketed mixed oils. These three oils differed in price and fatty acid composition and advertised infusions such as ‘green tea extract’. Marketed mixed oils had different composition of fatty acids: less than half the percentage of SFA, double the proportion of MUFA and about half the n-3 and n-6 content compared with the majority of the mixed oils.
Fatty acid analysis
Lipids that contained non-esterified or esterified fatty acids were extracted from 2 ml of hexane–isopropanol mixture (3:2, v/v) or 2 ml of 6 % sodium sulfate mixture containing the sample. Fatty acids were esterified with a methylating reagent containing methanol (2 ml) and acetyl chloride (0·1 ml) as previously described( Reference Baylin, Silesb and Donovan-Palmera 14 , Reference Baylin, Kabagambe and Siles 16 ). After esterification, the methanol and acetyl chloride were evaporated off and the fatty acid methyl esters were redissolved in isooctane. Fatty acids were determined by GC, using the same condition as in our previous studies( Reference Baylin, Silesb and Donovan-Palmera 14 , Reference Baylin, Kabagambe and Siles 16 ). Peak retention times and area percentages of total fatty acids were identified by injecting known standards (NuCheck Prep, Elysium, MN, USA) and analysed with the ChemStation A·08·03 software from Agilent Technologies (Foster City, CA, USA). A total of forty-six fatty acids were analysed; however, not all of them are reported in the tables given that some fatty acids represented a very small proportion of total fatty acids. As part of the laboratory quality control, a control oil sample was run periodically. Inter-assay CV for the main fatty acids were: 1·58 for 16:0, 0·25 for 18:0, 0·10 for 18:1n-9, 0·63 for 18:2n-6, 0·97 for 18:3n-6 and 0·52 for c,t-18:2n-6. Fatty acids are expressed as a percentage of total fatty acids.
Results
The fatty acid composition of cooking oils commonly consumed in Colombia is presented in Table 1. Only one sample of corn oil was analysed and therefore results are not shown in Table 1. However, the fatty acid content of this sample was as expected and the TFA content of corn oil was below 2 % (total trans fat 0·55 %).
Canola oil had the lowest mean TFA content (0·40 %) compared with soyabean (1·10 %), total mixed (1·66 %) and sunflower (2·18 %) oils. The proportion of TFA in sunflower oils ranged from 1·25 % to 3·62 %. Mixed oils had the highest SFA proportion (18·40 %). Canola oil had a high n-3 proportion (9·37 %) compared with soyabean, mixed and sunflower oils. Soyabean and mixed oils contained a slightly lower proportion of n-3 fatty acids, 5·93 % and 4·31 %, respectively, and sunflower oils contained less than 0·5 % n-3 fatty acids.
Compared with oils analysed in 2008( Reference Baylin, Mora-Plazas and Cobos-de Rangel 9 ), the 2013 data showed consistent reductions in SFA and TFA, and increases in n-3 fatty acids, for all oils (Table 2). In particular, reductions in TFA were significant for 18:1 and 18:2 in mixed oils and for 18:2 in sunflower oil. In terms of percentage reduction from 2008 to 2013 in 18:1 and 18:2 TFA, canola oil had 89 % and 65 % reduction, mixed oils had 44 % and 48 % reduction, and sunflower had 25 % and 51 % reduction, respectively.
Table 2 Comparison of fatty acid composition (% of total fatty acids) of oils in Colombia, 2008 and 2013
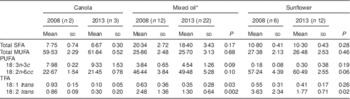
TFA, trans-fatty acids.
* Mixed oils are mixtures of soyabean oil, corn oil and palm oil mostly, and are marketed as vegetable oil.
Table 3 shows a similar comparison of major fatty acids between 2008 and 2013 but limited to the same brands of oils in both years. There was also a reduction in TFA and an increase in n-3 fatty acids for the same brands of oils in the 5-year period.
Table 3 Comparison of fatty acid composition (% of total fatty acids) of oils in Colombia for the same brands, 2008 and 2013
TFA, trans-fatty acids.
* Mixed oils are mixtures of soyabean oil, corn oil and palm oil mostly, and are marketed as vegetable oil.
Discussion
We analysed the fatty acid composition of sixty-five common oils consumed in Bogota, Colombia. When comparing the results with those reported for 2008( Reference Baylin, Mora-Plazas and Cobos-de Rangel 9 ), the fatty acid composition of common cooking oils has changed substantially. Across all cooking oils analysed, the proportion of TFA is lower in 2013 than in 2008, suggesting voluntary reduction by industry. Interestingly, the decrease in TFA has not been made at the expense of increasing the SFA content. Canola oil has only about one-quarter of the trans fat observed in 2008. Similarly, the trans fat proportion in sunflower oil has decreased by almost half; however, it still has the highest mean trans fat content compared with other oils sampled. Of note, changes in the composition of soyabean oil could not be determined because this oil was not commercially available in 2008; even though currently it is one of the most commonly found. Although some multinational and international companies are making efforts to reduce TFA content in their processed foods( Reference Monge-Rojas, Colón-Ramos and Jacoby 13 ) little is known about the composition of cooking oils in other Latin American countries.
While fatty acid composition is an important health consideration when choosing which type of cooking oils to use on a daily basis, the price of the oils is also an important factor for this population( Reference Baylin, Mora-Plazas and Cobos-de Rangel 9 ). In this setting, canola and sunflower oils are the most expensive options available, while soyabean oil is the least expensive. The price of mixed oils remains in between. We previously reported that most families consumed mixed vegetables oils (66 %) followed by sunflower (21 %) and other oils/fats (13 %), which included mostly palm shortening, margarine and others( Reference Baylin, Mora-Plazas and Cobos-de Rangel 9 ). The number one reason for choosing sunflower oil was ‘health’, even though sunflower oil had the highest proportion of TFA( Reference Baylin, Mora-Plazas and Cobos-de Rangel 9 ). Mixed oils were chosen based on cost( Reference Baylin, Mora-Plazas and Cobos-de Rangel 9 ).
Because fish consumption is low in Bogota( Reference Petrova, Dimitrov and Willett 17 ), oils high in n-3 are important to achieve recommended daily intake values of essential fatty acids. Having low TFA, low SFA and high n-6 fatty acid content are also important considerations for health outcomes. Regardless of some controversies around the potential inflammatory effect of n-6 fatty acids, recent studies have shown circulating levels of linoleic acid to be inversely associated with total and CHD mortality( Reference Wu, Lemaitre and King 18 ). Canola oil has the highest n-3, lowest TFA and lowest SFA content but it is the most expensive. A more affordable option is soyabean oil, which has high n-3, high n-6 and low TFA content. Assuming a 8368 kJ (2000 kcal) diet and a daily serving of 2–3 tablespoons of cooking oil, as recommended by the American Heart Association, the amount of trans fats in the diet coming from cooking oils would be: 76 g for sunflower oil, 58 g for mixed oils, 39 g for soyabean oil and 14 g for canola oil.
Fatty acid composition in commonly consumed oils is changing in Colombia. While trans fat content is decreasing in all oils, from a theoretical standpoint, canola oil would be the most appropriate choice for the Colombian population because of its high n-3, low TFA and low SFA content. From a practical point of view, soyabean oil is more affordable, widely available and has comparable properties with regard to fatty acid composition. Although labelling would be an important strategy to encourage appropriate behavioural change in the consumer and encourage the industry to reformulate its products( Reference Otite, Jacobson and Dahmubed 19 ), it seems that in Colombia voluntary reformulation by the industry is happening without labelling. Given the high fluctuation in TFA content, we believe that regular monitoring of the fatty acid composition of oils is warranted.
Acknowledgements
Financial support: The study was supported by ASISA Research Fund at the University of Michigan. The funder had no role in the design, analysis or writing of this article. Conflict of interest: None. Authorship: M.M. analysed the data and drafted the manuscript; A.B. and E.V. designed the study; C.M. and M.M.-P. collected the data; H.C. analysed the fatty acids; all authors reviewed and commented on the manuscript. Ethics of human subject participation: The study protocol was approved by the Ethics Committee of the National University of Colombia Medical School. The Institutional Review Board at the University of Michigan approved the use of data and samples from the study.
Supplementary material
To view supplementary material for this article, please visit http://dx.doi.org/10.1017/S136898001500049X


