


Maternal and child undernutrition was estimated to account for 45 % of all child deaths globally in 2011( Reference Black, Victora and Walker 1 ). Among the underlying nutrition-related causes of death in children under 5 years of age are stunting (low height-for-age), wasting (low weight-for-height), deficiencies of vitamin A and Zn, and suboptimum breast-feeding( Reference Black, Allen and Bhutta 2 , Reference Bhutta, Das and Rizvi 3 ). While the global prevalence of child malnutrition has decreased in the past decades, it continues to be high in South Asia and Africa( Reference Black, Victora and Walker 1 ). Adequate complementary feeding practices have been associated with improved child growth( Reference Arimond and Ruel 4 – Reference Ruel and Menon 6 ) and reduced under-5 mortality( Reference Jones, Steketee and Black 7 ). The target age for complementary feeding is generally accepted to be 6 to 24 months( 8 ). During this critical time period for child growth and development, breast milk is no longer sufficient to cover the child’s growing nutritional needs and should be supplemented by foods that fill the gaps for energy and nutrients( Reference Dewey and Adu-Afarwuah 9 ), including animal-source foods and fresh vegetables and fruits( Reference Arimond and Ruel 4 , Reference Ruel 10 ).
The WHO has developed eight core infant and young child feeding (IYCF) indicators, designed to reflect adequate intakes of energy and key nutrients. These include breast-feeding practices, timely introduction of solid, semi-solid or soft foods, minimum dietary diversity (MDD), minimum meal frequency (MMF) and intake of Fe-rich foods( 11 ). In several studies, compliance with IYCF indicators has been linked to improved nutritional status in children( Reference Marriott, White and Hadden 5 , Reference Ruel and Menon 6 , Reference Onyango, Borghi and de Onis 12 ), while other studies have found inconsistent or non-existent relationships between separate IYCF indicators and child growth( Reference Jones, Ickes and Smith 13 ). These studies have in general been cross-sectional, and associations between compliance over time and anthropometric outcomes have rarely been investigated. In one study by Moursi et al., an infant and child feeding index composed of current breast-feeding and bottle-feeding, dietary diversity, food group frequency and feeding frequency in the past 24 h showed relative stability over time (from 6 to 17 months) and was associated with increased length-for-age but not weight-for-age( Reference Moursi, Treche and Martin-Prevel 14 ).
Tracking is defined as the stability of a health behaviour over time or as the tendency of an individual to maintain his/her rank or position within a group over time( Reference Kelder, Perry and Klepp 15 ). Tracking studies are useful to determine at what age health behaviours stabilize. Health interventions implemented before this age are generally believed to be more effective( Reference Madruga, Araujo and Bertoldi 16 ). Interventions may also become more targeted since high-risk groups for continued poor health behaviour and future health problems may be discovered. To our knowledge, there is little information in the scientific literature on the tracking of food patterns in infants and children from low- and middle-income countries. One study from Australia, where food intakes were recorded at 9 and 18 months, showed a high degree of tracking for energy-dense, nutrient-poor foods. Intakes of healthier foods such as fruits, vegetables, eggs and fish were also relatively stable from infancy to toddlerhood( Reference Lioret, McNaughton and Spence 17 ). Another study from the UK on infants (6 and 12 months old) found that dietary patterns, the first characterized by fruits, vegetables and home-made foods and the second characterized by bread, savoury snacks, biscuits and chips, were correlated between ages and associated with maternal and family characteristics, most importantly maternal diet( Reference Robinson, Marriott and Poole 18 ).
The present paper focuses on children included in the study titled ‘Etiology, Risk Factors and Interactions of Enteric Infections and Malnutrition and the Consequences for Child Health and Development’ (MAL-ED) in Nepal. The seven other cohort sites are in Bangladesh, Brazil, India, Pakistan, Peru, South Africa and Tanzania. The aim of MAL-ED is to improve understanding of the interrelationships between gut microbial ecology, enteropathogen infection, diet, nutritional status, gut physiology, growth, immune function and cognitive development( 19 ). The first objective of the paper was to assess IYCF practices in a cohort of children aged 9 to 24 months in Bhaktapur, Nepal. The second objective was to assess tracking of dietary diversity score (DDS), intakes of Fe- and vitamin A-rich foods and meal frequency, and the sociodemographic factors associated with tracking of these complementary feeding practices.
Methods
Design and participants
The MAL-ED study is based on birth cohorts followed longitudinally in each of the eight study sites. The data in the present paper pertain to children aged 9 to 24 months included in the MAL-ED study in Bhaktapur, a peri-urban agriculture-based community located 15 km east of Kathmandu, the capital city of Nepal. Data from 6 to 9 months were omitted due to a change in the methodology for dietary data collection at 9 months( Reference Caulfield, Bose and Chandyo 20 ) and a need for consistency in the data. In total, 240 infants were enrolled within 17 d from birth and 229 had completed nutritional data at 24 months. Initial enrolment started in June 2010, while data collection for this age group took place between February 2011 and November 2012. The MAL-ED study in Nepal received ethical approval from Nepal Health Research Council and the Walter Reed Institute of Research (Silver Springs, MD, USA). Signed informed consent was collected from the mother or caregiver of each participating child. Further details on study design and methods are reported elsewhere( 19 ).
24 h recall
The food intake of the children was collected by monthly 24 h recalls, where the mother or caregiver answered questions about all meals, foods and amounts consumed on the day prior to the interview. Local fieldworkers went through an initial three-day training with follow-up exercises and periodic one-day refresher training sessions led by experts in dietary recall technique. A structured form was used to write down all foods and drinks offered to the child, when and where it was consumed, whether it was raw or cooked, the amount served and the amount left over. Play dough, common household utensils and pictures of portion sizes were used to estimate amounts of food. Another form was used to collect details on the recipes( Reference Caulfield, Bose and Chandyo 20 ).
Infant and young child feeding indicators
Three of the eight core IYCF indicators( 11 , Reference Daelmans, Dewey and Arimond 21 ) were assessed in addition to adapted indicators for intakes of Fe- and vitamin A-rich foods (Table 1). DDS was calculated based on seven food groups as follows: grains, roots and tubers; legumes and nuts; dairy products; flesh foods; eggs; vitamin A-rich fruits and vegetables; and other fruits and vegetables( Reference Daelmans, Dewey and Arimond 21 ). DDS was calculated by summing up the number of food groups consumed by each child in the last 24 h. MDD was defined as a DDS of ≥4. MMF was defined as solids, semi-solids or soft foods ≥3 times/d for breast-fed children and ≥4 times/d for non-breast-fed children. Meals included both meals and snacks (apart from minimal amounts). Minimum acceptable diet (MAD) was defined as those who had at least MDD and MMF for the relevant time slot. Milk is considered a required element in the diet of non-breast-fed children( 11 ). To avoid counting the milk group twice, milk and milk products were excluded when calculating DDS for the MAD indicator for non-breast-fed children. Further, MAD in this group was defined as those with DDS≥4/6 who had received ≥2 portions of dairy and/or infant formula and ≥4 portions of dairy and/or infant formula and solid/semi-solid foods( 11 ). Results are reported separately for breast-fed and non-breast-fed children in the 21–24 months time slot.
Table 1 WHO infant and young child feeding indicators adapted for the present study
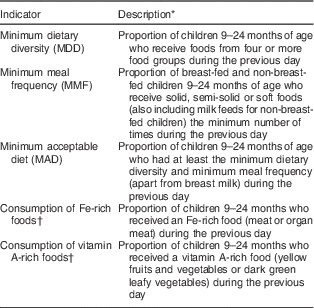
* Original indicators cover the age group 6–23 months.
† Adapted from WHO Indicators for Assessing Infant and Young Child Feeding Practices ( 11 ) for the purpose of the study.
Socio-economic status
A questionnaire on socio-economic status was administered at 12, 18 and 24 months. The WAMI (Water, Assets, Mother’s education and Income) index, a measure of socio-economic status developed for MAL-ED, was composed of the following variables: access to improved water and sanitation; number of assets; maternal education; and household income. The eight assets used were: separate room for a kitchen; household bank account; mattress; refrigerator; television; people per room (mean); table; and chair or bench. The WAMI index based on data from all eight MAL-ED sites showed a significantly stronger association with stunting than maternal education or more complete measures of wealth alone( Reference Psaki, Seidman and Miller 22 ).
Statistical analysis
Data analysis was performed using the statistical software packages IBM SPSS Statistics version 23·0 and STATA version 14·0. A probability level of 0·05 was used. Continuous data were presented as mean and sd ( Reference Senarath, Agho and Akram 23 ) if normally distributed, and as median (minimum, maximum) if not normally distributed. After reviewing trends for age in the data it was decided to use four time slots, each with four months of measurements (9–12, 13–16, 17–20 and 21–24 months, respectively). Characteristics of adequate complementary feeding are based on all observations within time slots. This prevents exclusion of participants with missing data. Seventeen participants lacked one measurement, one participant in the 9–12 months time slot lacked two measurements, while for the last two time slots one participant lacked three measurements.
Differences between mean and median values across time slots were analysed using one-way repeated-measures ANOVA or Friedman’s test. Stability coefficients for all four time slots for DDS, intakes of Fe- and vitamin A-rich foods and meal frequency were calculated using generalized estimating equations (GEE) models. A GEE model has the advantage of providing one stability coefficient taking into account that measurements within one individual are correlated and may be adjusted for both time-dependent and time-independent covariates. The regression of the value of the outcome variable at time 1 is performed v. the longitudinal development of the outcome variable from time 2 to time m (number of measurements) while adjusting for covariates, yielding a single regression coefficient( Reference Twisk 24 ). First, unadjusted models and models adjusting for WAMI were calculated. Then, models adjusted for WAMI, maternal age, parity and child’s gender were performed. Since these adjustments made no further changes to the estimates, only results from the unadjusted models and those adjusted for WAMI are presented. Correlation coefficients <0·30 were classified as low, 0·30 to 0·60 as moderate, and >0·60 as moderately high( Reference Malina 25 ).
Tracking of tertile membership from one time slot to the next and from the first to the last time slot was done using Cohen’s weighted kappa (κ w), which takes into account the squared concordance of position among groups( Reference Cohen 26 ). Stability is presented as the percentage of participants remaining in their tertile, while the increase and decrease categories represent change in tertile membership since the previous time slot or from the first to the last time slot. Since the weighted kappa procedure is not available in IBM SPSS Statistics, data from Crosstabs analysis and syntax from the IBM website( 27 ) were used. According to Landis and Koch( Reference Landis and Koch 28 ), a κ w of 0·01–0·20 represents slight agreement, 0·21–0·40 fair agreement, 0·41–0·60 moderate agreement, 0·61–0·80 substantial agreement, and 0·81–1·00 almost perfect agreement.
Multinomial logistic regression was then conducted to assess factors associated with the odds of maintaining stable low (being in the lower tertile for the dietary behaviour at 9–12 months and at 21–24 months) v. stable high (being in the upper tertile for the dietary behaviour at 9–12 months and at 21–24 months) consumption patterns. The independent variables were WAMI index (divided into high (above the median, 0·703) and low (below median)), maternal age and parity. WAMI above the median value, maternal age above 25 years and single child were treated as reference for the independent variables. The analysis was performed comparing the first and last time slot only.
To account for possible changes in outcome variables due to seasonality, the date of each observation was recoded into pre-monsoon (March–May), monsoon (June–August), post-monsoon (September–November) and winter (December–February). One-way ANOVA or the Kruskal–Wallis test was performed, but no significant differences between seasons were found for either of the outcome variables. Consequently, seasonality was left out from the multinominal regression analyses.
Results
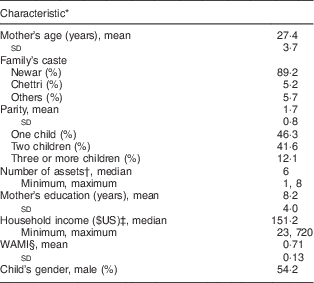
The mean age of the mothers was 27·4 (sd 3·7) years, their mean number of years of education was 8·2 (sd 4·0), their mean parity was 1·7 (sd 0·8) children and the predominant caste was Newari (89·2 %). The mean WAMI index (range 0–1)( Reference Psaki, Seidman and Miller 22 ) was 0·71 (sd 0·13), where all households had access to improved water and sanitation. Out of 240 infants included at baseline, 130 (54·2 %) were male (Table 2).
Table 2 Selected characteristics of mother–child pairs (n 231), Bhaktapur, Nepal, February 2011–November 2012
* Measured at 12 months age.
† Out of a total of eight assets as suggested by Psaki et al.( Reference Psaki, Seidman and Miller 22 ).
‡ Exchange rates from Oanda.com.
§ WAMI (Water, Assets, Mother’s education and Income) index as a measure of socio-economic status proposed by Psaki et al.( Reference Psaki, Seidman and Miller 22 ).
Nearly all children (>97 %) were breast-fed up to 20 months and the children were breast-fed frequently (about 10 times/d). The mean DDS increased gradually through the four time slots, and the prevalence of MDD increased from 40 % in the 9–12 months time slot to 65 % in the 21–24 months time slot. All children had received food from the grains/cereal category (data not shown) and the most common staple food was rice. The prevalence of MMF increased from 88 % in the 9–12 months time slot to 98 % in the final time slot. The prevalence of MAD increased from 39 % in the 9–12 months time slot to 64 % among breast-fed children aged 21–24 months, while the corresponding prevalence for non-breast-fed children aged 21–24 months was 26 %. Although increasing slightly with age, only one-third of recalls showed consumption of Fe- and vitamin A-rich foods in all four time slots (Table 3).
Table 3 Selected characteristics of infant and young child feeding practices, by age, among 9- to 24-month-old children (n 924)Footnote *, Bhaktapur, Nepal , February 2011–November 2012
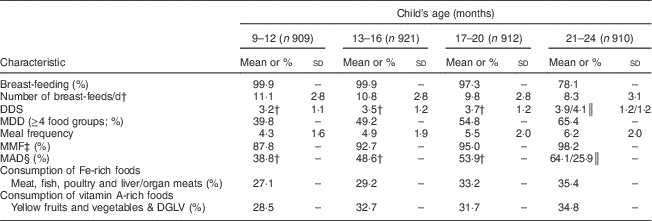
DDS, dietary diversity score; MDD, minimum dietary diversity; MMF, minimum meal frequency; MAD, minimum acceptable diet; DGLV, dark green leafy vegetables.
* Number of observations in a time slot, secondary recalls excluded.
† Only children breast-fed the previous day included in the analysis.
‡ ≥3 times/d for breast-fed and ≥4 times/d for non-breast-fed children.
§ For breast-fed children: MDD and MMF; for non-breast-fed children: DDS≥4/6, ≥2 portions of dairy and/or infant formula and ≥4 portions of dairy and/or infant formula and solid- or semi-solid foods.
║ Breast-fed/non-breast-fed.
Repeated-measures ANOVA with a Greenhouse–Geisser correction showed that mean DDS (F (2·87, 655·32)=57 429, P<0·001) and meal frequency (F (2·83, 645·68)=189·8, P<0·001) differed significantly between time points. Friedman’s test showed a significant difference in rank between time slots for portions of Fe- (P<0·001) and vitamin A-rich foods (P=0·006; Table 4). The stability coefficients calculated by unadjusted GEE models for DDS (0·48) and meal frequency (0·53) were moderate, while for portions of Fe-rich (0·20) and vitamin A-rich foods (0·26), correlations were low (Table 5). Adjusting for WAMI made minor changes to the coefficients for DDS (0·44) and meal frequency (0·50), while the coefficients for Fe- and vitamin A-rich foods remained the same. Additional adjustment for maternal age, parity and child’s gender made no further difference to the estimates (data not shown).
Table 4 Dietary diversity, portions of iron-rich and vitamin A-rich foods and meal frequencyFootnote * by age, among 9- to 24-month-old children, Bhaktapur, Nepal, February 2011–November 2012
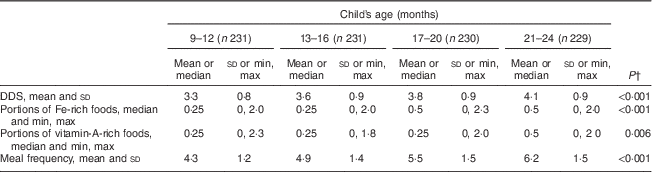
DDS, dietary diversity score.
* Average for each time slot calculated.
† P value for difference between time points calculated by one-way repeated-measures ANOVA or Friedman’s test.
Table 5 Tracking of complementary feeding behaviours among 9- to 24-month-old children (n 229), Bhaktapur, Nepal, February 2011–November 2012
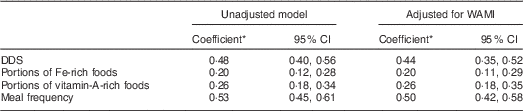
WAMI, Water, Assets, Mother’s education and Income index; DDS, dietary diversity score.
* Stability coefficients calculated by general estimating equations (GEE) analysis.
Tracking of tertile membership of DDS and meal frequency was moderate and stable from 9–12 months to 17–20 months, but increased slightly at 21–24 months (Cohen’s κ w=0·48 and 0·56, respectively; Table 6). For intakes of Fe- and vitamin A-rich foods, tracking coefficients were for the most part fair and decreased throughout follow-up from 0·27 and 0·27 for the 13–16 months time slot to 0·22 and 0·19 for the 21–24 months time slot, respectively. Tracking between the first and last time slot was fair to moderate for DDS (0·40) and meal frequency (0·41), and fair for portions of Fe- (0·23) and vitamin A-rich (0·35) foods.
Table 6 Tracking of complementary feeding practices between time slots among 9- to 24-month-old children, Bhaktapur, Nepal, February 2011–November 2012
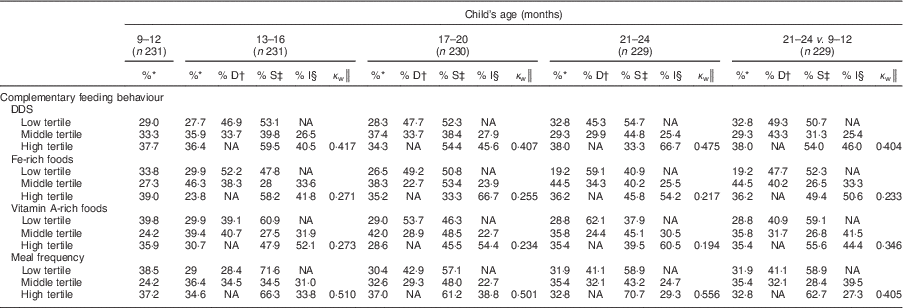
DDS, dietary diversity score; NA, not applicable.
* Proportion of mother–child pairs with feeding behaviour at the time slot.
† Proportion of mother–child pairs with a decrease in feeding behaviour from the previous time slot.
‡ Proportion of mother–child pairs with stable feeding behaviour since the previous time slot.
§ Proportion of mother–child pairs with an increase in feeding behaviour from the previous time slot.
║ Tracking coefficient of Cohen’s weighted kappa.
A low WAMI index significantly increased the odds of tracking of low DDS (OR=3·31; 95 % CI 1·44, 7·60) and meal frequency (OR=3·46; 95 % CI 1·54, 7·76) between the first and last time slot compared with tracking of stable high DDS and meal frequency (Table 7). There was also a borderline significant association between low WAMI and maintaining stable low intake of Fe-rich foods (OR=2·68; 95 % CI 1·01, 7·17). The odds of stable low intake of Fe-rich foods was significantly higher for mothers with three or more children (OR=7·29; 95 % CI 1·62, 32·8) compared with mothers with only one child. Finally, the odds of tracking of low meal frequency was significantly higher for mothers with three or more children (OR=6·31; 95 % CI 1·89, 21·1) compared with mothers with only one child.
Table 7 Associations of tracking of low tertile of dietary diversity, intakes of iron- and vitamin A-rich foods and meal frequency with sociodemographic characteristics, by multinominal logistic regression, among 9- to 24-month-old children (n 229), Bhaktapur, Nepal, February 2011–November 2012
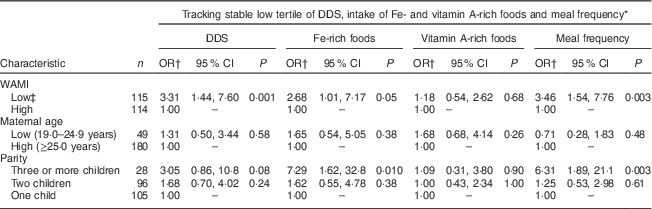
DDS, dietary diversity score; WAMI, Water, Assets, Mother’s education and Income index.
* Low tertile both at 9–12 and 21–24 months time slots.
† High tertile at both 9–12 and 21–24 months time slots used as the reference category.
‡ WAMI below median value (7·03) at 12 months.
Discussion
The prevalence of MDD, MMF and MAD increased gradually through follow-up and was higher for MMF than for MDD for all time slots. Prevalence of MDD and MMF was higher than respective national (30 and 77 %)( 29 ) and global (<33 and 50 %)( Reference Lutter, Daelmans and de Onis 30 ) estimates, but comparable to findings in a recent study on children aged 6–23 months in the Kathmandu valley( Reference Pries, Huffman and Adhikary 31 ). Since dietary diversity increases with age( Reference Ma, Zhou and Hu 32 ), the higher prevalence of MDD in our study may be caused by exclusion of children below 9 months old. Meanwhile, Bhaktapur is a peri-urban society with higher socio-economic status than the national average( Reference Shrestha, Shrestha and Bodhidatta 33 ), which probably has a positive influence on child feeding practices. The high prevalence of MMF may be caused by the study design where snacks were recorded as meals. At the same time, previous research has revealed that compliance with adequate meal frequency is higher than for dietary diversity both in multi-country studies( Reference Marriott, White and Hadden 5 , Reference Jones, Ickes and Smith 13 ) and Nepal( Reference Marriott, White and Hadden 5 ). Finally, prevalence of and risk factors for MAD have in previous research been closely linked to MDD, especially in populations with high meal frequency( Reference Senarath and Dibley 34 ), as reflected in our data. The validity of meal frequency in explaining MAD may thus be questioned.
Our data showed that nearly all children (>97 %) were breast-fed up to 20 months and that breast-feeding frequency was high (about 10 times/d). Mothers in our study thus seem to comply with recommendations for on-demand breast-feeding up to 2 years age( 8 ). In our data, dietary diversity increased somewhat with age as breast-feeding frequency decreased, which is consistent with other studies( Reference Ma, Zhou and Hu 32 , Reference Sawadogo, Martin-Prevel and Savy 35 ). Further, non-breast-fed children in our last time slot had slightly higher DDS than breast-fed children, a finding supported by others( Reference Moursi, Arimond and Dewey 36 ). On the one hand, this seems to suggest that frequent breast-feeding in this age group may lower micronutrient adequacy. On the other hand, in most low- and middle-income countries, complementary foods are based on staples and contain only small amounts of key nutrients such as vitamin B6, Fe and Zn( Reference Dewey and Brown 37 ). Further research on the relationship between the quality of complementary foods and the amount of breast milk v. complementary foods that should be consumed by children in different settings to maximize nutrient intake is thus warranted.
We found moderate tracking for DDS and meal frequency using GEE models. In addition, tracking based on rank measures was moderate and stable for these variables up to 20 months and increased slightly at 21–24 months. We have not been able to find other studies investigating tracking of DDS during early childhood, but moderate correlations or tracking of dietary intake in children has been observed in Western populations( Reference Madruga, Araujo and Bertoldi 16 ). Moderate tracking for DDS is expected since dietary practices are expected to change, likely at an uneven pace for different children, through these age groups. At the same time, a higher tracking coefficient for DDS than for separate food groups is likely since DDS reflects complete family food- and maternal dietary patterns, which have relatively stable determinants. Dietary intake in Bhaktapur is homogeneous( Reference Henjum, Torheim and Thorne-Lyman 38 ), which may influence tracking positively. Finally, tracking coefficients for meal frequency are most likely influenced by daily routines. Moderate tracking for DDS and meal frequency implies that early interventions to improve these complementary feeding behaviours might have sustainable effects.
The low correlation coefficients and fair tracking coefficients (0·21–0·40) found for Fe- and vitamin A-rich foods may reflect that these foods are consumed only occasionally. Only about 30 % of observations showed consumption of Fe- or vitamin A-rich foods the previous day, which is comparable to other studies( Reference Marriott, White and Hadden 5 , Reference Khanal, Sauer and Zhao 39 ). Low tracking of healthy dietary behaviours in this population compared with the study on Australian children( Reference Lioret, McNaughton and Spence 17 ) probably signifies that cultural and environmental factors influence intake in Nepal more than in Western settings. For instance, meat consumption has been shown to depend on religion and caste( Reference Siegel, Stoltzfus and Khatry 40 ). In addition, a previous study has shown that Nepali mothers may find animal-source foods unsuitable for young infants since they are perceived as difficult to digest( Reference Chandyo, Henjum and Ulak 41 ). Finally, vitamin A-rich green leafy vegetables are widely consumed in Bhaktapur, but mainly in winter and spring( Reference Shrestha, Shrestha and Bodhidatta 33 ). Fair tracking coefficients may therefore imply that time slots have been comprised of measurements made in different seasons. The low or fair tracking coefficients for intakes of Fe- and vitamin A-rich foods imply that early interventions to improve these complementary feeding behaviours might have limited sustained effect.
The odds of tracking of low (low tertile at both first and last time slot) compared with high DDS, intakes of Fe-rich foods and meal frequency were significantly higher in the low WAMI group. This is consistent with other findings( Reference Senarath and Dibley 34 ), where children from poor households and children with illiterate mothers were found to have poor complementary feeding practices. Low family income and education level are relatively stable determinants for mothers in our sample, increasing the odds of tracking low on complementary feeding practices. The role of maternal education for improved complementary feeding practices has been highlighted in previous studies from low- and middle-income countries( Reference Marriott, White and Hadden 5 , Reference Khanal, Sauer and Zhao 39 ). While some researchers claim that this effect is conditioned by resource availability at household level( Reference Reed, Habicht and Niameogo 42 , Reference Ruel, Habicht and Pinstrup-Andersen 43 ), others point to the significant differences in nutritional status observed among children from the same households( Reference Mussa 44 ). The higher odds of tracking of low intake of Fe-rich foods and meal frequency for mothers with three or more children may simply reflect the cost of feeding a large family compared with a smaller one.
Our data portray a nutrition situation typical of many low- and middle-income countries where cereals and grains are used as staple foods while nutrient-dense foods such as meat, fruits and vegetables are consumed sparingly( Reference Ruel 10 , Reference Onyango 45 ). The Nepal Demographic and Health Survey 2011 data showed a deterioration of complementary feeding practices among Nepali mothers since 2006( Reference Gautam, Adhikari and Khatri 46 ). At the same time, consumption of sweet snacks is a problem in Nepal( Reference Pries, Huffman and Adhikary 31 ) and may lead to preference for sweet taste and displacement of nutrient-rich foods( Reference Savage, Fisher and Birch 47 ). Our findings imply that complementary feeding practices of 9- to 24-month-old children in Bhaktapur need to be improved. Education of mothers either alone or in combination with food supplements has in previous meta-analyses been linked to improved complementary feeding and child growth( Reference Imdad, Yakoob and Bhutta 48 , Reference Lassi, Das and Zahid 49 ), and should be strengthened in this population. Mothers with low education level should be prioritized since they are a high-risk group for poor complementary feeding practices. Such education should stress the importance of acquiring nutrient-dense complementary foods to the extent possible and feeding children these foods( Reference Dewey 50 ) with adequate frequency( 8 ) from the time when complementary feeding commences.
A major strength of the current study is the longitudinal design providing detailed data on the development of complementary feeding practices across a crucial period in children’s lives. Four measurements within each time slot may increase the precision of estimates for complementary feeding performance. However, intake of Fe- and vitamin A-rich foods, which is more random than DDS and meal frequency, probably requires more measurements to be adequately assessed. Retention was almost complete throughout the study. Inclusion of children directly after birth is another strength, since according to the 2011 Nepal Demographic and Health Survey, only 29 % of children below 2 years of age possess birth certificates( 29 ) and precise estimates of children’s ages may be difficult.
The current study also had some limitations. Misreporting cannot be ruled out and previous research implies that over-reporting is more common than under-reporting in studies on young children( Reference Lioret, McNaughton and Spence 17 ). Further, dietary diversity is attractive for its simplicity, adaptability to different settings( Reference Arimond and Ruel 4 , Reference Daniels, Adair and Popkin 51 ) and its ability to reflect dietary adequacy( Reference Kennedy, Pedro and Seghieri 52 ). The method is particularly beneficial in food cultures with a common food bowl such as Nepal, where precise estimation of intake is difficult( Reference Hatloy, Torheim and Oshaug 53 ), and is the preferred data collection method for young children over time( Reference Caulfield, Bose and Chandyo 20 ). However, previous articles show heterogeneity in the number of food groups used, the length of reference periods, which foods are grouped together and the application of intake limits, which makes direct comparisons of results difficult. In the current study, we chose to use seven food groups and a cut-off of ≥4 for dietary adequacy as recommended by FAO/WHO, since this is inherent in the MAL-ED protocol and enables cross-site comparisons. In addition, no minimum intake limit was used. This may result in a high DDS, which to a lesser degree reflects nutrient adequacy than if portion size requirements were included( Reference Daniels, Adair and Popkin 51 ).
Tracking analysis has some potential pitfalls( Reference Twisk 24 ). First, if the reproducibility of the outcome variable is poor, the tracking coefficient will also be low. The age group investigated in the current study may show low reproducibility because feeding practices are expected to change somewhat with food preferences and less breast-feeding. For instance, children are expected to fully adjust to family foods only after 12 months age( 8 ). This was a contributing factor in our choice to divide the population into tertiles instead of using fixed cut-offs for intake. At the same time, tertiles may be somewhat misleading, since high tertile membership does not necessarily reflect meeting recommendations. Closely spaced measurements in our study may influence tracking positively, but the time period is one where substantial changes in food intake are expected to occur. Finally, minor shifts at the borders of groups will influence the tracking coefficient, although such shifts may not be clinically relevant( Reference Twisk 24 ). This was shown in our study where extremely low median intakes of Fe- and vitamin A-rich foods, and small differences in intake between tertiles, were found (Table 4).
Finally, the population of Bhaktapur represents a semi-urban population residing close to the capital Kathmandu, which may limit the generalizability to other populations in Nepal and South Asia.
In summary, tracking for DDS and meal frequency was moderate, while tracking for intakes of Fe- and vitamin-A rich foods was low among infants and toddlers in this peri-urban area in Nepal. The odds of tracking of low compared with high DDS, intake of Fe-rich foods and meal frequency was higher among mothers with low socio-economic status. Our data highlight the importance of educating mothers about feeding children nutrient-rich complementary foods, particularly those rich in Fe and vitamin A, on a regular basis from the time complementary feeding commences. Irregular intake and low tracking for intakes of Fe- and vitamin A-rich foods imply that a broader approach targeting reasons for not feeding these foods to children regularly should be applied.
Acknowledgements
Financial support: The ‘Etiology, Risk Factors, and Interactions of Enteric Infections and Malnutrition and the Consequences for Child Health and Development’ (MAL-ED) is a collaborative project supported by the Bill and Melinda Gates Foundation, the Foundation for the National Institutes of Health (NIH) and the NIH Fogarty International Center. The funders had no role in the design, analysis or writing of this article. Conflict of interest: All authors declared no conflict of interests. Authorship: M.S.M. performed the statistical analysis, wrote the paper and had primary responsibility for the final content. L.E.T., M.K.G. and S.H. provided guidance for the statistical analysis. R.K.C., M.U. and S.K.S. supervised and conducted the research. B.S. was in charge of data management. All authors have read and approved the final manuscript. Ethics of human subject participation: The MAL-ED study in Nepal received ethical approval from Nepal Health Research Council and the Walter Reed Institute of Research (Silver Springs, MD, USA). Signed informed consent was collected from the mother or caregiver of each participating child.


