


High blood pressure is a major risk factor for CVD, which is the leading cause of death worldwide( 1 ). Na, K and the Na:K ratio in urine have all been associated with blood pressure levels and the occurrence of vascular outcomes( Reference He, Li and Macgregor 2 – Reference Cook, Obarzanek and Cutler 4 ). Reducing Na intake and increasing K intake through improvements to diet is widely recommended as a cost-effective strategy for the control of hypertension and the prevention of CVD( 5 , 6 ). The WHO recommends that daily dietary intake of Na is less than 2000 mg( 5 ) and daily dietary intake of K is greater than 3510 mg( 6 ). Data to describe the actual exposure levels of populations are sparse and in large part this is because measurement is logistically challenging and expensive.
Repeated 24 h urine measurement is required to estimate mean Na intake and variability for an individual( Reference Liu, Cooper and McKeever 7 ), but multiple collections involve considerable burden for participants and are very rarely possible( 8 ). Robust mean values for populations can, however, be estimated by taking the mean of multiple single measurements from a population sample( 9 ). The process for estimating daily intake involves multiplying the concentration of the electrolyte by the 24 h urine volume to attain a measure of daily exposure. Assay of the concentration of Na and K in urine is currently restricted to laboratories that carry the necessary equipment. Transporting urine samples from survey sites for analysis can be logistically challenging and expensive, particularly in resource-poor settings( Reference Yager, Domingo and Gerdes 10 ). A typical laboratory cost of assay for Na and K is $US 1·21 and this does not include the often-substantial cost of transportation.
HORIBA Ltd, Japan has developed a compact portable twin meter that can be used to measure Na and K concentration in liquids in the field. If proved reliable for the measurement of Na and K in urine samples, this meter might provide a low-cost alternative assay method that also removes the need to ship samples to a laboratory. The sensor is durable enough to measure about 1500 samples under optimal conditions but urine samples high in protein may decrease this number to about 500. Under this worst-case assumption, the cost of assay using the twin meter would be comparable but without any additional expense for transportation.
The goal of the present study was to compare estimates of Na, K and Na:K ratio from 24 h urine samples (n 166) using field-based assays done with the Horiba twin meter against estimates based on assays done using standard laboratory-based methods.
Methods
The urine samples used in the current analyses were collected from 12 September to 20 September 2015 as part of the ongoing Salt Substitute and Stroke Study (SSaSS) being done in northern rural China( Reference Neal, Tian and Li 11 ). The protocol of SSaSS has received ethics approval from the institutional review boards at both Peking University Health Science Center, China and the University of Sydney, Australia. Written informed consent was obtained from each study participant.
Participants
Two hundred and forty individuals (twenty people selected at random from thirty-five participants in twelve villages participating in SSaSS) were invited to provide a 24 h urine sample as part of a process indicator survey in that study.
Urine collection
Participants were provided with six 1-litre plastic specimen bottles and instructed to collect all urine voided during a 24 h period according to standard procedures. The 24 h urine collection started from the time in the morning that the participant voided his/her bladder for spot urine collection and continued for 24 h until final voiding the next morning. Both times were recorded. The process was supervised by trained investigators. Participants were asked to return the entire urine collection to the field site. To guard against under- and over-collection, urine collections were rejected if the timing of the collection fell outside the range of 23–25 h, if the 24 h urinary volume was less than 500 ml or if the volume of the missed urine reported by the participant was more than 10 % of the total volume. In addition, samples were excluded from analysis if 24 h creatinine excretion was less than 4 mmol or greater than 25 mmol in women or less than 6 mmol or greater than 30 mmol in men. Upon completion of the collection period the contents of the specimen bottles were combined in a single large 5-litre container, mixed well and three 1·8 ml aliquots were removed. Two were frozen at −20°C for up to 7 d prior to shipping to the central laboratory. One was used for analysis and the other was kept as a backup sample. The third aliquot was used immediately to perform a field-based measurement using the Horiba twin meter.
Assay of sodium and potassium concentrations using the Horiba twin meter
The modified LAQUAtwin B-722 and modified LAUQAtwin B-731 meters (HORIBA Ltd, Japan) are waterproof, pocket-sized and battery-operated analysers that use a direct ion-selective electrode technique to measure Na and K concentrations. The meters are designed to measure Na and K concentrations in parts per million, with a detectable range between 0 and 9999 ppm and a precision guarantee range of 23–2300 ppm for Na and 39–3900 ppm for K. For both, a two-point calibration was performed with standards of known concentration (150 and 2000 ppm) at the start of each day and no more than 100 samples were measured between calibration checks.
The concentrations of Na and K were determined by dropping urine on to the sensor. A minimum of 0·3 ml urine was required to cover the two round flat sensors located 8 mm apart (centre-to-centre) on a 12 mm×20 mm sensor pad. Once the urine was applied, the light-shield plate was closed and the measurements were made. Results were displayed on an LCD digital screen and recorded after assay stability was confirmed on the screen. Time to achieve assay stability varied between samples and averaged about 10 s. The sensor pad was cleaned with purified water after each assay and cleanliness confirmed by the meter readings dropping to near zero. Excess water was gently wiped from the sensor pad using tissue in preparation for the next assay. Assays were done at room temperature.
Assay of sodium and potassium concentrations in the laboratory
Samples were processed in the central laboratory of Peking University Commercial Aviation General Hospital. The Na and K concentrations were determined by direct ion-selective electrode methods( Reference Brown, Dyer and Chan 12 ). Measurements were performed automatically with Hitachi 7600 auto-biochemistry equipment. Quality control samples, comprising both high-point and low-point standards, were assayed every 100 measurements. In addition, for thirty-six participants, duplicate specimens of the same sample were run through the system using dummy identification numbers to blind the laboratory to the process. The comparison of the data between the duplicates showed mean concentration results for Na (120·1 v. 120·5 mmol/l) and K (28·1 v. 28·0 mmol/l) that were highly comparable and average percentages of technical error were <5 % in both cases( Reference Brown, Dyer and Chan 12 ).
Outcomes
The outcome by which the two methods were compared was the average daily exposure to Na (mmol/d), K (mmol/d) and the Na:K concentration ratio.
Statistical analysis
Paired t tests were used to quantify average differences (and 95 % confidence intervals) between estimates based on assays made in the field using the Horiba Twin meter and assays made in the laboratory. To determine the validity of estimates based upon meter-based measurement compared with the laboratory-based measurement, CV, intraclass correlation coefficients (ICC; based on two-way mixed ANOVA, consistency, average measures) and standard error of the estimate (SEE) were calculated( Reference Hopkins 13 ). Pearson correlations were calculated to assess the relationships between methods. The Bland–Altman method was used to further explore the agreement between the meter-based measurements and the laboratory-based measurements( Reference Bland and Altman 14 ). The y-axis of the Bland–Altman plot is the difference between the methods (laboratory-based measurement – meter-based measurement) and the x-axis is the mean of meter-based measurement and the laboratory-based measurement. A significant correlation was observed between the difference and the mean of the methods, and log transformation did not remove the heteroscedasticity. Therefore, for the Bland–Altman plots, the reported 95 % limits of agreement were calculated based on a regression approach for non-uniform differences( Reference Bland and Altman 15 ). First, we performed the regression of the difference between the methods (D) v. the average of the two methods (A). Simple linear regression is generated as D=b 0+b 1 A. Then we performed the regression of the absolute values of the residuals (R) v. the average (A). If there is no significant association between R from the first regression model and A, the estimated standard deviation is the standard deviation of the adjusted differences. The 95 % limits of agreements are hence obtained as b 0+b 1 A±1·96×sd. Statistical analyses were performed using the statistical software package SAS version 9.3 and Microsoft® Office 2016 Excel for Windows software.
Results
Two hundred and forty subjects were invited to provide urine samples, of whom 166 provided completed 24 h urine collections. The seventy-four exclusions comprised four individuals who had difficultly collecting the urine samples (urinary incontinence or physical impairment), one with a urinary infection, one with serious diarrhoea, twelve who reported incomplete urine collection and fifty-six whose 24 h urine collection was likely an over- or under-collection as indicated by extreme creatinine values.
The mean age of the 166 individuals who contributed was 63·2 (sd 8·0) years and 48·8 % were female. Mean BMI was 24·7 (sd 3·4) kg/m2, mean systolic blood pressure was 147·4 (sd 21·6) mmHg and mean diastolic blood pressure was 87·8 (sd 12·8) mmHg. Use of blood pressure-lowering medication was 7·8 % for a diuretic, 16·2 % for an angiotensin-converting enzyme inhibitor, 47·6 % for a calcium antagonist, and 43·4 % for another form of drug reported as being used for blood pressure control (mostly traditional Chinese medicine).
Comparison of assay methods for estimating urinary sodium
The estimated mean daily Na intake for the 166 individuals with complete 24 h urine samples was 170·4 (sd 77·6) mmol/d (range 42–441 mmol/d) using the field-based meter and 193·3 (sd 84·7) mmol/d (range 50–507 mmol/d) using the laboratory assay (Table 1). The estimates from the two methods were clearly different (22·9 mmol/d; 95 % CI 20·0, 25·9 mmol/d; P<0·001), with the field-based estimates made with the meter underestimating compared with the laboratory-based assay (Table 1). The Pearson correlation coefficient was very high, although the plot illustrated systematic bias in the estimation methods (Fig. 1(a)). Figure 2(a) shows the Bland–Altman plot for the agreement between the field-based meter assays and laboratory-based assays in Na excretion. The 95 % limits of agreements are obtained as 6·91+0·09A±1·96×17·87 (where A is the average of Na estimation by the two methods). In general, laboratory equipment measurements provided higher values than meter-based measurements in Na intake estimation. Based on the 95 % limits of agreement equation, for the average urinary Na excretion from the laboratory test (193·3 mmol/d), the calculated 95 % limits of agreement extended from −10·7 to 59·3 mmol/d.
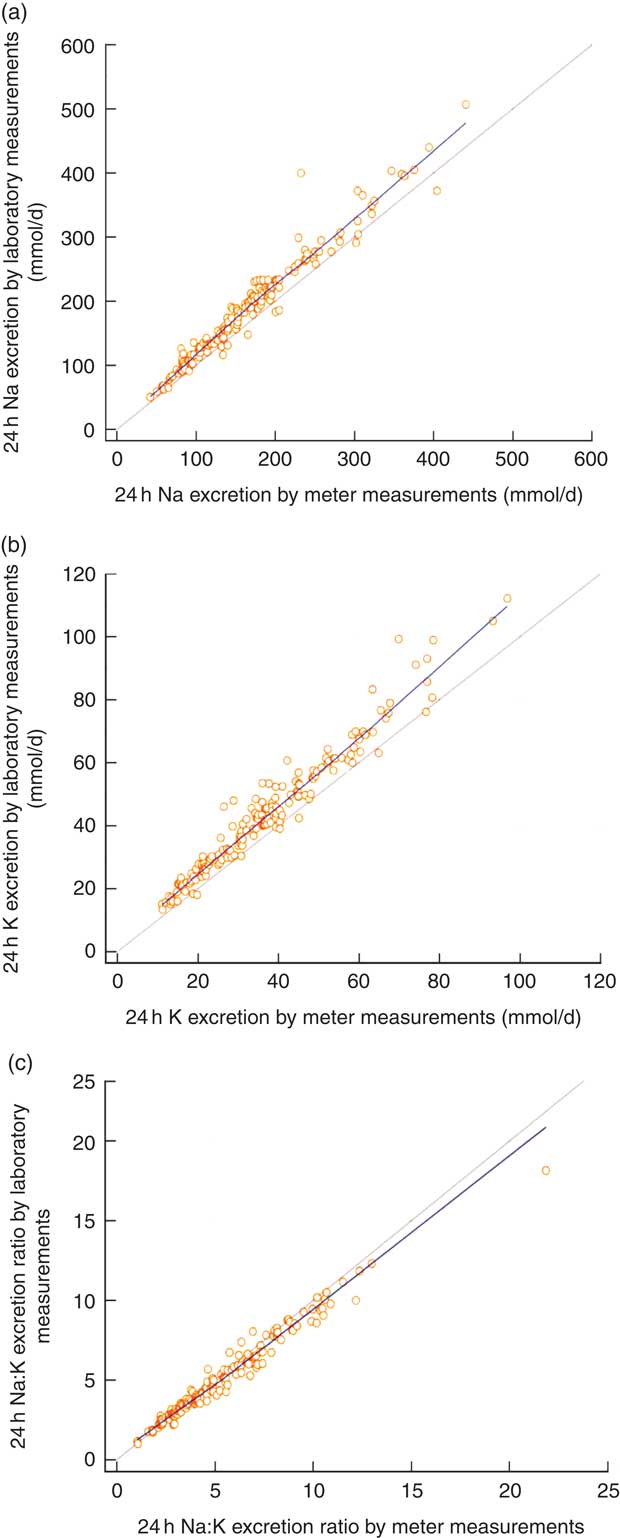
Fig. 1 (colour online) Correlations between field-based assays done using the Horiba twin meter and laboratory-based assays done using standard methods in estimation of (a) 24 h urinary sodium excretion, (b) 24 h urinary potassium excretion and (c) 24 h urinary sodium:potassium ratio; analyses of complete 24 h urine samples (n 166) collected as part of the ongoing Salt Substitute and Stroke Study (SSaSS) being done in rural northern China, September 2015. ![]() , data point;
, data point; ![]() , regression line;
, regression line; ![]() , line of equivalence. (a) y=11·9562+1·0645x, r=0·976, R
2=0·963, P<0·001; (b) y=2·8240+1·0977x, r=0·976, R
2=0·952, P<0·001; (c) y=0·3611+0·8871x, r=0·986, R
2=0·971, P<0·001
, line of equivalence. (a) y=11·9562+1·0645x, r=0·976, R
2=0·963, P<0·001; (b) y=2·8240+1·0977x, r=0·976, R
2=0·952, P<0·001; (c) y=0·3611+0·8871x, r=0·986, R
2=0·971, P<0·001
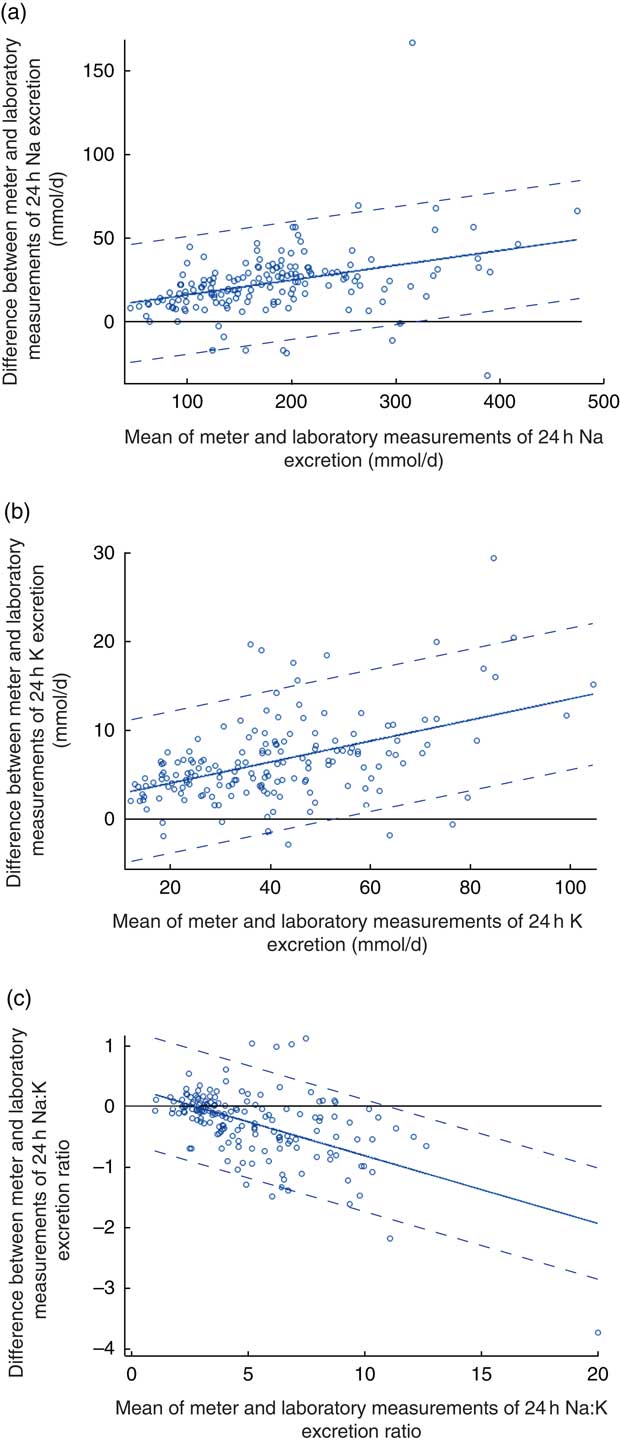
Fig. 2 (colour online) Modified Bland–Altman plots for agreement between field-based assays done using the Horiba twin meter and laboratory-based assays done using standard methods in estimation of (a) 24 h urinary sodium excretion, (b) 24 h urinary potassium excretion and (c) 24 h urinary sodium:potassium ratio; analyses of complete 24 h urine samples (n 166) collected as part of the ongoing Salt Substitute and Stroke Study (SSaSS) being done in rural northern China, September 2015. ![]() , data point;
, data point; ![]() , mean difference (bias);
, mean difference (bias); ![]() , 95 % limits of agreement
, 95 % limits of agreement
Table 1 Measures of sodium, potassium and the sodium:potassium ratio derived from field-based assays done using the Horiba twin meter compared with measures derived from assays done using laboratory-based methods; analyses of complete 24 h urine samples (n 166) collected as part of the ongoing Salt Substitute and Stroke Study (SSaSS) being done in rural northern China, September 2015

SEE, standard error of estimate; ICC, intraclass correlation coefficient; A, average of the assays by two methods.
There was no relationship between the residuals from the regression model and A, so the sd of the adjusted differences is simply the residual sd from the regression. Thus, the 95 % limits of agreement are expressed as b 0+b1 A±1·96×sd.
Comparison of assay methods for estimating urinary potassium
The estimated mean daily K intake for the 166 individuals with complete 24 h urine samples was 37·4 (sd 17·6) mmol/d (range 11·2–96·9 mmol/d) for the field-based assay method using the meter and 43·8 (sd 19·8) mmol/d (range 13·4–112·1 mmol/d) based upon the laboratory assay (Table 1). The estimates from the two methods were clearly different (6·5 mmol/d; 95 % CI 5·8, 7·2 mmol/d; P<0·001; Table 1). The Pearson correlation coefficient for 24 h estimates was very high, although the plot again illustrated a systematic difference in the results of the two measurement methods (Fig. 1(b)). Figure 2(b) shows the Bland–Altman plot for the agreement between the field-based meter assays and laboratory-based assays in K excretion. The 95 % limits of agreements are obtained as 1·65+0·12A±1·96×4·09 (where A is the average of K estimation by two methods). Like for Na estimation, laboratory equipment measurements provided higher values than meter-based measurements. Based on the 95 % limits of agreement equation, for the average urinary K excretion from the laboratory test (43·8 mmol/d), the calculated 95 % limits of agreement extended from −1·1 to 14·9 mmol/d.
Comparison of assay methods for estimating sodium:potassium ratio
The mean Na:K ratio determined from assays made using the Horiba twin meter was 5·3 (sd 2·9; range 1·0–22·9) compared with the laboratory assay result of 5·0 (sd 2·6; range 1·0–18·1; Table 1). There was a high correlation for the Na:K ratio results between two methods (Fig. 1(c)). Figure 2(c) shows the Bland–Altman plot for the agreement between the field-based meter assays and laboratory-based assays in Na:K excretion. The 95 % limits of agreements are obtained as 0·31−0·11A±1·96×0·47 (where A is the average of Na:K ratio for the two methods). Based on the 95 % limits of agreement equation, for the average Na:K ratio (2·6), the calculated 95 % limits of agreement extended from −0·90 to 0·95.
Discussion
The present study shows that the Horiba twin meter can support reasonably accurate estimates of mean Na and K excretion, although in both cases the estimates derived from the meter assays resulted in underestimation compared with the laboratory assays. The more detailed performance metrics that were calculated for the meter provided insight into the reasons for the underestimation. If repeat studies showed similar findings, it might be possible to enhance the meter or make some standard adjustment to correct future meter-based estimates of population salt intake. Salt intake and urinary Na excretion vary from day to day( Reference Liu, Cooper and McKeever 16 ). In a prior study, the normal daily fluctuation in 24 h urinary Na was about ±25 % for Na excretion and the normal daily fluctuation in 24 h urinary K was about ±14 % for K excretion( Reference Schachter, Harper and Radin 17 ). The differences between the meter assays and laboratory assays for Na and K from our study were within the degrees of normal daily fluctuation, which suggest that the field-based measure may be an acceptable alternative in some circumstances. The portability, low cost, low maintenance and simplicity of use are all important positive factors for the modified LAQUAtwin B-722 and modified LAUQAtwin B-731 meters, and warrant their further exploration for in-the-field assays of Na and K concentrations.
A prior study of 9600 adults in Jiangsu Province, eastern China reported mean 24 h urinary Na and K excretion values of 188·2 (sd 69·5) mmol and 28·0 (sd 9·5) mmol, respectively, with a corresponding mean Na:K ratio of 6·9 (sd 2·0)( Reference Yongqing, Ming and Jian 18 ). Another large study conducted in Shandong Province estimated mean 24 h urinary Na and K excretion as 232 (sd 87·4) mmol/d and 40·8 (sd 19·5) mmol/d, respectively, with Na:K ratio of 6·7 (sd 3·6)( Reference Yan, Guo and Wang 19 ). These results are broadly consistent with the current findings although our study reports lower Na, higher K and a lower ratio, which is likely a consequence of the use of reduced-Na, added-K salt substitute by half of those included.
There has been one prior study that has reported an evaluation of a portable meter for measuring the Na concentration of urine and in that case the laboratory comparison was a chromatography technique. The mean Na concentration values obtained with that meter also resulted in underestimation (72·8 (sd 78·2) v. 82·7 (sd 75·6) mmol/l), with the limits of agreement ranging from a 32 % underestimation to an 8 % overestimation. The CV was directly comparable at 10 %( Reference Goulet and Asselin 20 ).
The reasons why the Horiba twin meter results differed from the laboratory results in the current study are likely to be technical. First, the two point calibrations were not optimally selected. The standards of 150 and 2000 ppm for Na were too low because more than half of the urine samples had a Na concentration above the upper level of calibration. Underestimation of Na concentration at higher levels of concentration is a known issue for meters of this type, because the concentration of Na ions in the vicinity of the membrane tends to be lower than in the body of the solution under examination( Reference Rundle 21 ). The Bland–Altman findings provide support for this explanation with greater differences between the meter values and laboratory values as Na concentration increased. Using a wider calibration range that matches more closely the Na concentration of urine might be an immediate way to improve performance.
It is also possible that the frequent switching of solutions on the sensor pad could have caused a drift and hysteresis effect( Reference Liu and Lindsay 22 ). Drift and hysteresis during a sequence of measurements may be caused by interference from other ions in the solution and the ionic strength of the solution reducing the measured activity relative to the true concentration at high concentrations. During the fieldwork each meter was used about 120 times per day. More frequent calibration of the meter, perhaps after every twenty measurements, would be one strategy to try and address this problem. Changing the way the meter reports from ppm to mmol/l would also enhance the convenience of use for this particular application and removing the current rounding function (whereby concentrations above 1000 ppm are rounded to the nearest hundred) would also be helpful. Whether the difference observed between units may purely be attributable to the sensor’s intrinsic characteristics or some other unknown factors needs to be determined in future studies. Applying meter assays in estimating mean Na and K must be used cautiously. Ongoing studies and improvements to the meter may lead to increasing the Na and K accuracy of this device.
The study benefited from its large sample size, which provided fairly precise estimates of meter performance, but additional studies done in a range of settings and among other population groups would provide for a more complete evaluation. The intra-analyser assessments of the laboratory method showed good reliability. It would have been optimal to have done the same for the Horiba twin meter measurements in our study although a prior report has demonstrated excellent repeatability of Horiba twin meter assays in another setting( Reference Goulet and Asselin 20 ).
There is a growing global interest in the exposure of populations to Na and K and there is a corresponding need for new tools that can provide robust and low-cost measurements. Estimation of Na and K is traditionally based upon 24 h urine collections and laboratory measures that can be costly and onerous in many settings. The Horiba twin meter does not address the challenge presented by the collection of high-quality 24 h urine samples but field-based assessment of concentration is, nevertheless, a helpful step forward because it precludes the need for the transportation of samples. Utility of the meter may grow further if current exploration of the potential for making mean population exposure estimates based upon spot urine samples proves successful. Methods based on spot urine samples preclude the need for 24 h collection of urine which is the other major barrier to assessment of salt intake at the individual or population level. The existing estimating equations that use spot urine concentrations require knowledge of urinary creatinine concentration for which there is currently no field-based assay method available. If such an assay were available at low cost, and the initial promising findings for spot urine-based methods are confirmed, then this could transform the measurement of mean population exposure to Na and K and may further increase the public health value of this meter.
Higher correlations and better agreements have been shown between blood pressure and spot urine Na:K ratio than for spot urine Na or K alone when compared with the 24 h urine values( Reference Iwahori, Miura and Ueshima 23 ). In conjunction with known joint effects of Na and K on the risk of CVD, there is a strong argument for a greater focus on the Na:K ratio than either of the two components( Reference Cook, Obarzanek and Cutler 4 , Reference Perez and Chang 24 ). The Horiba twin meter can immediately simplify measurement of the Na:K ratio because this requires only the concentration of each cation and these can now be done in the field using the twin meter. The present study shows that the Na:K ratio obtained with the meter is highly comparable to that obtained in the laboratory. The ease of use of the meter might also make feasible the measurement of Na:K ratio among individuals and this could be a good alternative to 24 h assays of urinary Na and K. Repeated Na:K ratio measurements based upon spot urine samples are achieved with less bias compared with the estimates obtained for 24 h Na and K( Reference Iwahori, Ueshima and Torii 25 ). If there was a greater focus on Na:K ratio in the management of hypertensive patients, this could be greatly facilitated by a field-based meter such as the Horiba twin meter.
Conclusion
Meter-based estimates of mean population salt intake resulted in underestimation compared with values obtained with standard laboratory-based methods. However, the magnitude of the underestimation was moderate only, and the meter assay method is a potentially much more convenient way of measuring dietary salt intake. As such, the meter assay has significant potential as a more practical, convenient and inexpensive method of measuring population exposure to Na and K intake than traditional laboratory-based methods. This holds true particularly in remote areas where transport of specimens would be onerous and also if there is a primary interest in the Na:K ratio which was estimated with greater reliability. Further innovations and repetition of the current findings will be necessary to maximize the potential of the meter. With the WHO, national governments and parts of the food industry now focusing on salt reduction, there will be growing interest in the measurement of dietary Na and K. Reducing mean global salt intake from its current level of 10 g/d( Reference Mozaffarian, Fahimi and Singh 26 ) to the WHO target of 5 g/d will require concerted action and large-scale monitoring. If significant improvements in intake can be achieved, then very large health gains are anticipated in almost every country around the world.
Acknowledgements
Acknowledgements: HORIBA, Ltd provided the devices (twin meter B-721 and B-722) used in the study. Financial support: The collection of samples and assays was supported by a National Health and Medical Research Council of Australia (NHMRC) Project Grant (number APP1049417). B.N. is supported by an NHMRC Principal Research Fellowship (grant number APP1106947), holds an NHMRC Program Grant (number APP1052555) and an NHMRC Centre for Research Excellence in Food Policy for Salt Reduction. Conflict of interest: Y.K. is employed by HORIBA, Ltd who provided the meter devices and technology supports. No other conflict of interest exists. Authorship: Secured funding: B.N. Study design: B.N., M.T. and X.Y. Acquisition of data: Z.L. and X.F. Analysis and interpretation of data: X.Y. and K.P. Drafting of the manuscript: X.Y. Critical revision of the manuscript for important intellectual content: B.N. and Y.W. Ethics of human subject participation: This study was conducted according to the guidelines laid down in the Declaration of Helsinki and all procedures involving human subjects/patients were approved by the ethics committee of both the University of Sydney and Peking University Health Science Center. Written informed consent was obtained from every participant.


