


In the 1960s, Western nations, especially the USA( Reference Flegal, Carroll and Kuczmarski 1 , Reference Flegal, Carroll and Ogden 2 ) and Western Europe( Reference Lobstein, Rugby and Leach 3 ), saw a dramatic increase in the frequency of overweight and obesity. In 1998, the WHO( 4 ) declared obesity a major public health epidemic, both in developed and developing countries, and estimated that by 2025 obesity would concern more than half the adult population in the USA, UK and Australia( 4 ). A similar trend was found among children and adolescents( Reference Reilly, Armstrong and Dorosty 5 , Reference Wang and Lobstein 6 ). In the period 1963–1991 in the USA the prevalence of overweight among 6–11-year-old children increased from 15 % to 22·5 %, while the frequency of obesity rose from 5 % to 11 %. In the UK in the period 1989–1998 the prevalence of overweight among children under 4 years of age increased from 14·7 % to 23·6 %, and obesity from 5·4 % to 9·2 %. Between the years 1975 and 1995 in Germany, the frequency of overweight among boys (7–14 years of age) increased from 10·0 % to 16·3 %, and among girls from 11·7 % to 20·7 %( Reference Rolland-Cachera, Castetbon and Arnault 7 ). However, relatively recent reports from the USA have shown that the prevalence of overweight and obesity among children and adolescents (2–19 years of age) did not change between 1996 and 2006 or between 2003 and 2006. A slowdown in the trend has also been found among children in the UK, France (children aged 3–14 and 7–9 years), Switzerland (6–13-year-olds) and Sweden (girls 10–11 years old)( Reference Stamatakis, Wardle and Cole 8 ). Nevertheless, it is estimated that at present in the European Union, 20 % of children and young people are overweight, a third of whom can be classified as obese( Reference Cattaneo, Monasta and Stamatakis 9 ). This is very important because obesity during childhood may contribute to orthopaedic complications, metabolic disorders, type 2 diabetes, sleep disorders, impaired immune function and hypertension. In children, obesity can also lead to psycho-social problems such as low self-esteem, social isolation and discrimination from peers. In the case of girls this may further contribute to eating disorders or depression( Reference Doak, Visscher and Renders 10 , Reference Striegel-Moore and Bulik 11 ). Children who are overweight or obese often remain in that condition in adulthood, which results in CVD, insulin resistance, type 2 diabetes, hyperlipidaemia, osteoarthritis and some types of cancer( Reference Doak, Visscher and Renders 10 ), thus increasing the risk of premature death( Reference Cattaneo, Monasta and Stamatakis 9 ).
In the early 1990s, Poland and other Eastern Bloc countries started to experience a rapid increase in the prevalence of overweight and obesity among children and adolescents( Reference Ulijaszek and Koziel 12 , Reference Vignerová, Humeníkowá and Paulová 13 ) due to the dramatic economic, political and social changes after the fall of the Soviet Union( Reference Ulijaszek and Koziel 12 ). In Poland, this trend revealed regional differences which depended on the extent of industrialization. It is estimated that among 11–15-year-old children in Warsaw in 1971, overweight was present in 9·2 % of boys and 8·2 % girls, and obesity in 1·0 % and 0·3 %, respectively. More than 20 years later, in the period 2005–2006, the percentage of overweight was already 18·7 % among boys and 11·4 % among girls, with obesity observed in 2·8 % of boys and 3·4 % of girls( Reference Jarosz, Szponar and Rychlik 14 ). In another Polish city, Wrocław, located in south-west Poland, Kozieł et al.( Reference Kozieł, Kołodziej and Uliaszek 15 ) found a slight decrease in the percentage of overweight and obesity in 14-year-old boys in 1997 (compared with 1987). Among 8–12-year-old children in Rzeszów (south-east Poland) in 1998–2008, the frequency of overweight among boys had increased from 10·5 % to 14·2 %, while among girls it had stabilized (12·0 % v. 13·3 %). Obesity decreased among girls (from 10·1 % to 7·7 %) and stabilized among boys (6·8 % v. 6·4 %)( Reference Mazur 16 ).
The WHO defines obesity as a disease associated with the accumulation of excess body fat. Methods allowing a high accuracy in estimating the amount of fat tissue in the body include dual-energy X-ray absorptiometry, dual-photon absorptiometry, computed tomography, MRI and multi-frequency bioelectrical impedance. In clinical practice, a physician would use much simpler and cheaper anthropometric methods, e.g. determination of waist-to-hip ratio and waist circumference. BMI is the most commonly used indicator for establishing overweight and obesity, based on the interpretation of the proportion of body mass and height( Reference Mikoś, Mikoś and Mikoś 17 ). In the case of children and adolescents it is assumed that overweight corresponds to those with a BMI greater than the 85th percentile, and those obese are above the 95th percentile( Reference Formiguera 18 ). Recently, the International Obesity Task Force recommended cut-off points suitable for age and sex, the value of which corresponds to a threshold BMI value at the age of 18 years: 25·0 kg/m2 for overweight and 30·0 kg/m2 for obese( Reference Formiguera 18 , Reference Cole, Bellizzi and Flegal 19 ). Importantly, analysis of the frequency of overweight and obesity does not reflect the whole problem. It only relates the number of children in the sample who are overweight or obese. There is a lack of information on what extent overweight people exceed the BMI threshold value and therefore on the extent to which the threshold value is exceeded in the population. This is all the more important as research indicates in the case of overweight people that the likelihood of health problems increases with BMI. For example, the likelihood of heart diseases increases by 5 % among adult men and 7 % among adult women with an increase of one BMI unit. Therefore information solely about BMI and not about how much it exceeds the cut-off points provides little information about the health problems in a population. These observations have been made for adults, and can certainly be applied to children and adolescents( Reference Jolliffe 20 ). Accordingly, Jolliffe( Reference Jolliffe 20 ) proposed a novel indicator, the extent of overweight (EOW) index, which indicates not only the prevalence of overweight and obesity in the population, but also the average value above BMI norms in a given population. In Poland, the index was used for the first time by Chrzanowska( Reference Chrzanowska 21 ).
The aim of the present study was to investigate differences in the frequency of overweight and obesity between three populations of minors aged 3–18 years in 1983, 2000 and 2010 in Kraków and to what extent the threshold BMI was exceeded on average. In addition, a similar analysis was carried out in separate groups: children, early adolescents and late adolescents.
Materials and methods
The children analysed in the present study were included in a cross-sectional survey conducted in randomly selected kindergartens and schools in Kraków, Poland in 2010. The analysis comprised 3833 children (1863 boys and 1970 girls) aged 3–18 years. The cohort was a representation of each of the four traditional residential districts of Kraków. This city is the second biggest in Poland (almost 1 million inhabitants). In order to provide a representative sample, the selection of units for testing (schools and classrooms) was determined at random, taking into account available information sources about the study population. Analysis of the age pyramid of the population of Kraków determined the proportion between the number of boys and girls, and the percentages of each age group in relation to the whole sample. All types of schools were taken into account (kindergarten, primary school, secondary school, basic vocational school, technical school, high school), as well as their location in Kraków. Considering all the above, the target sample size was established in the age groups, along with the number of allocated research institutions and the number of classrooms in a facility in every district. All analysed schools and kindergartens of Kraków were chosen by two-stage lottery, using the urn randomization without replacement method.
The 2010 examinations were conducted according to the procedures in force, i.e. with the consent of the Bioethics Committee at the Regional Medical Association in Kraków (number 26/KBL/OIL/2007) and the consent of children’s parents or their legal guardians. The calendar age of the participants, calculated as a difference between the date of the survey and the birth date, expressed as a decimal fraction, was a basis for classifying them as one of sixteen age groups, e.g. the participants aged 5·51–6·50 years were the group of 6-year-old children.
Children were also divided into three age groups, according to Bogin( Reference Bogin 22 ), as follows:
-
1. children (including boys aged 3–12 years and girls aged 3–10 years);
-
2. early adolescents (including boys aged 13–15 years and girls aged 11–13 years); and
-
3. late adolescents (including boys aged 16–18 years and girls aged 14–18 years).
This classification is the result of the difference in tempo of maturation( Reference Bogin 22 ).
The data from the 2010 survey series were compared with the results from previous survey series in 1983( Reference Chrzanowska, Gołąb and Bocheńska 23 ) and 2000( Reference Chrzanowska, Gołąb and Żarów 24 ). The sample sizes of the previous series were 3158 boys and 3158 girls in 1983, and 2323 boys and 2062 girls in 2000.
All the survey series were conducted by a team of academic researchers of the Department of Anthropology at the University School of Physical Education in Kraków. The measurements were taken according to Martin’s technique( Reference Martin and Saller 25 ) using a set of tools made by the Swiss manufacturer Sieber Hegner Machines SA. For the measurements, the participants removed their shoes, emptied their pockets and wore light indoor clothing. Height was measured to the nearest 0·1 cm. In the 2010 survey series, body composition analyser scales (type BC-418 MA; Tanita, Japan) were used to measure body weight to the nearest 0·01 kg. With this measurement BMI was calculated as weight/height2 (kg/m2).
The estimations of the prevalence of overweight and obesity were based on the cut-off points of the International Obesity Task Force. In this scheme, for overweight and obesity, cut-offs of 25 kg/m2 and 30 kg/m2 were extrapolated back to the appropriate age of childhood( Reference Cole, Bellizzi and Flegal 19 ).
To assess the extent of overweight, the following formula proposed by Jolliffe( Reference Jolliffe 20 ) was used:
 $$\vskip6pt {\rm EOW}\,{\rm index}=(1/n)\mathop{\sum}{I({\mathop{\rm BMI}\nolimits} _{i} \geq f_{i} )[({\mathop{\rm BMI}\nolimits} _{i} {\minus}f_{i} )/f_{i} ]} ,$$
where n is the sample size, i subscript is the child, f is the cut-off point identifying who is overweight and I is an indicator function that takes a value of 1 if the statement is true (the child is overweight) and 0 when the child’s BMI is less than the cut-off point corresponding to the value of BMI≥25·0 kg/m2 for adults, sex- and age-specific.
An advantage of the EOW index is the fact that it treats BMI as a continuous variable for the overweight segment of the population, while prevalence measures view overweight as a dichotomous outcome. Expressing excess BMI as a proportion of the overweight threshold is particularly important for children since the threshold varies by age and sex( Reference Jolliffe 20 ). The average extent of overweight for the entire population (EOW), when combined with information about the prevalence of overweight, additionally provides insight into the extent of overweight for that segment of the population( Reference Jolliffe 20 ). In the case of the prevalence of overweight and obesity, the significance of differences between study series was assessed by the χ 2 test. All the statistical analyses were made using the StatsDirect 2·8 software.
Results
Table 1 presents the prevalence of overweight and obesity among boys from the three series of studies. Based on the results, it was found that between 1983 and 2000, the prevalence of either overweight or obesity did not change. However, between 2000 and 2010, the frequency of overweight increased by almost 30 %, while obesity doubled – the difference was statistically significant (Table 1, Fig. 1). Analysis in age groups showed that in the last decades of the 20th century, the prevalence of overweight and obesity decreased slightly among children and early adolescents. However, among late adolescents it increased significantly by almost a half. In the first decade of the 21st century it was determined that the prevalence of overweight decreased among the children, while the frequency of obesity increased slightly. In the same period in early adolescents, the prevalence of overweight increased by over 80 % and the frequency of obesity by over 200 %. Among the late adolescents, these changes amounted to almost 46 % and 240 %, respectively – the differences in both age groups were statistically significant (Table 1, Figs 2 and 3).
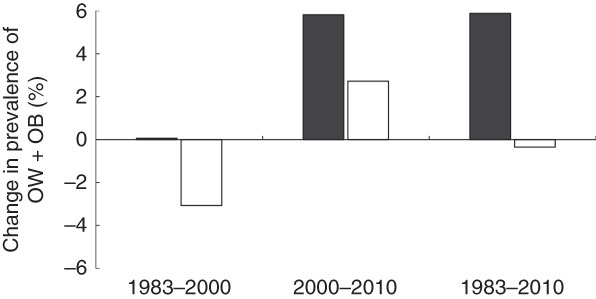
Fig. 1 Percentage changes in the prevalence of overweight (OW) and obesity (OB; according to International Obesity Task Force criteria(
Reference Cole, Bellizzi and Flegal
19
)) in boys (![]() ) and girls (
) and girls (![]() ) aged 3–18 years (n 14 534) between three surveys, Kraków, Poland
) aged 3–18 years (n 14 534) between three surveys, Kraków, Poland
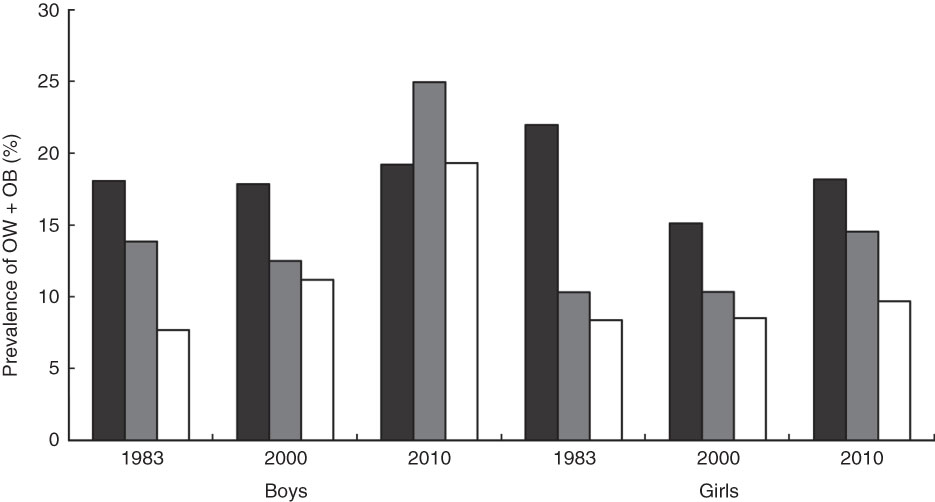
Fig. 2 Prevalence of overweight (OW) and obesity (OB; according to International Obesity Task Force criteria(
Reference Cole, Bellizzi and Flegal
19
)) in boys and girls aged 3–18 years (n 14 534) in three surveys according to age group (![]() , childhood;
, childhood; ![]() , early adolescence;
, early adolescence; ![]() , late adolescence), Kraków, Poland
, late adolescence), Kraków, Poland
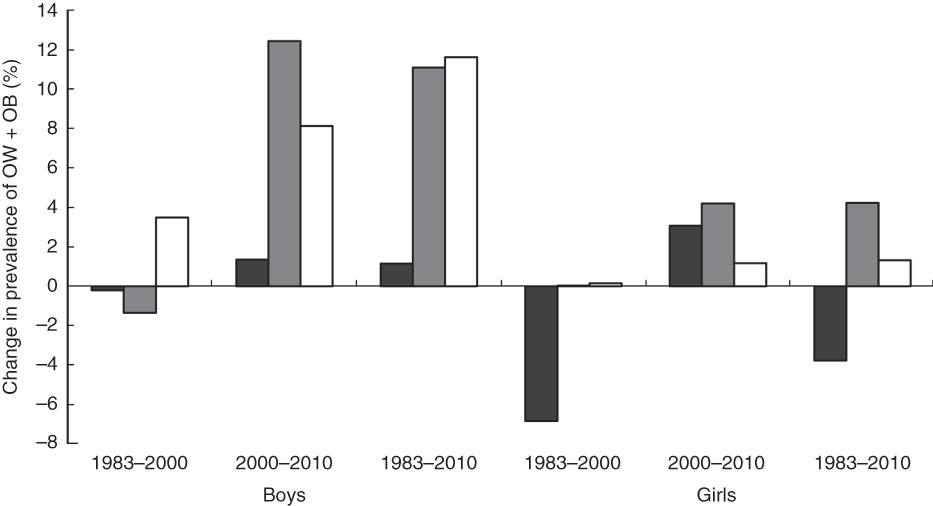
Fig. 3 Percentage changes in the prevalence of overweight (OW) and obesity (OB; according to International Obesity Task Force criteria(
Reference Cole, Bellizzi and Flegal
19
)) in boys and girls aged 3–18 years (n 14 534) between three surveys according to age group (![]() , childhood;
, childhood; ![]() , early adolescence;
, early adolescence; ![]() , late adolescence), Kraków, Poland
, late adolescence), Kraków, Poland
Table 1 Prevalence of overweight (OW) and obesity (OB; according to International Obesity Task Force criteria( Reference Cole, Bellizzi and Flegal 19 )) in boys (n 7344) aged 3–18 years in three surveys, Kraków, Poland
*P<0·05, **P<0·01, ***P<0·001.
Throughout the analysed period (1983–2010), the prevalence of overweight among girls decreased, while obesity increased – the difference was statistically significant (Table 2, Fig. 1). The analysis in age groups showed that in the period 1983–2000 the prevalence of overweight and obesity among children and early adolescents decreased (significantly in the group of children and slightly in the early adolescents group). Among late adolescents the prevalence of obesity was reduced, but overweight increased by over 11 %. In the 21st century, in all age groups slight changes were determined with regard to the prevalence of overweight, but the prevalence of obesity among the children doubled, and among the adolescents increased by over three times. Statistically significant differences were only in younger groups (Table 2, Figs 2 and 3). Additional analysis showed that the differences in the prevalence of overweight and obesity between the sexes were only in the first series of study (1983) among children (P<0·05) and early adolescents (P<0·05) and in the last series (2010) among the early (P<0·01) and late adolescents (P<0·001). Some non-significant results between age groups can be due to a smaller sample size, but it does not affect the overall observed trends.
Table 2 Prevalence of overweight (OW) and obesity (OB; according to International Obesity Task Force criteria( Reference Cole, Bellizzi and Flegal 19 )) in girls (n 7190) aged 3–18 years in three surveys, Kraków, Poland
*P<0·05, ***P<0·001.
Table 3 presents the prevalence of overweight and obesity among boys and girls in the three series of examinations, along with the EOW index and the ratio of these two values (OW gap). It was ascertained that in the years 1983–2010 the prevalence of overweight and obesity among boys increased from 15 % to almost 21 % (i.e. by 40 %), while the EOW index increased by 10 % (Fig. 4). Importantly, the results indicate the prevalence of overweight and obesity in the populations of boys in Kraków increased between 1983 and 2010, while the BMI threshold was exceeded only slightly. Based on the OW gap indicator, it was found that overweight boys in 1983 exceeded the BMI threshold level by 17 %, while in 2010 by 13 % (Table 3, Fig. 4).
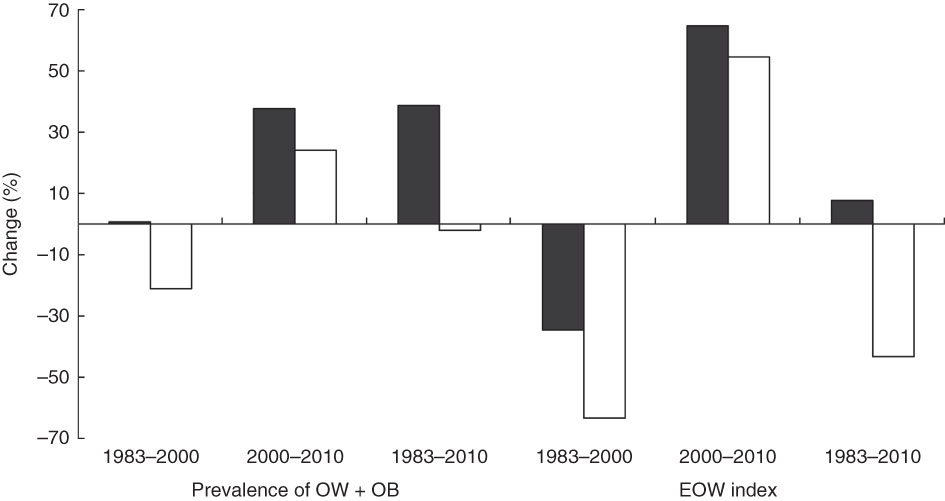
Fig. 4 Percentage changes in the prevalence of overweight (OW) and obesity (OB; according to International Obesity Task Force criteria(
Reference Cole, Bellizzi and Flegal
19
)) and extent of overweight (EOW) index in boys (![]() ) and girls (
) and girls (![]() ) aged 3–18 years (n 14 534) between three surveys, Kraków, Poland
) aged 3–18 years (n 14 534) between three surveys, Kraków, Poland
Table 3 Overweight (OW) and obesity (OB) prevalence (according to International Obesity Task Force criteria( Reference Cole, Bellizzi and Flegal 19 )), extent of overweight (EOW) index and the average amount by which the overweight segment of the population exceeds the overweight threshold (avg. OW gap) in boys and girls aged 3–18 years (n 14 534) in three surveys, Kraków, Poland
Among girls the prevalence of overweight and obesity decreased also by 2 %, and the EOW index decreased by 45 %. As a consequence, the OW gap decreased from 20·4 % to 11·8 %. These results show that, on average, girls in 1983 exceeded the BMI threshold value by 20 %, while in 2010 by 12 % (Table 3, Fig. 4).
Analysis of changes in the prevalence of overweight and obesity, EOW index and the ratio between these two indicators showed that, in the analysed period (1983–2010) among boys in childhood (<12 years of age), the prevalence of overweight and obesity increased slightly, from 18·1 % to 19·2 % (by 6 %), while the EOW index decreased from 3·7 to 2·4 (by about 29 %; Table 4). In other words, in 2010 there were relatively more overweight boys under 12 years of age than in 1983, although they were slightly leaner than those examined in 1983.
Table 4 Overweight (OW) and obesity (OB) prevalence (according to International Obesity Task Force criteria( Reference Cole, Bellizzi and Flegal 19 )), extent of overweight (EOW) index and the average amount by which the overweight segment of the population exceeds the overweight threshold (avg. OW gap) in boys and girls aged 3–18 years (n 14 534) in three surveys according to age group, Kraków, Poland
More distinct negative changes were observed in the older age groups. Among the early adolescent boys the prevalence of overweight and obesity increased by 80 % while the EOW index increased by 150 %. Among late adolescent boys the changes were 149 % and 390 %, respectively, which shows that in 2010 adolescents were more often overweight and also that on average they exceeded the BMI threshold more than in 1983. The excessive body weight was especially pronounced among late adolescents (Table 4, Fig. 5).
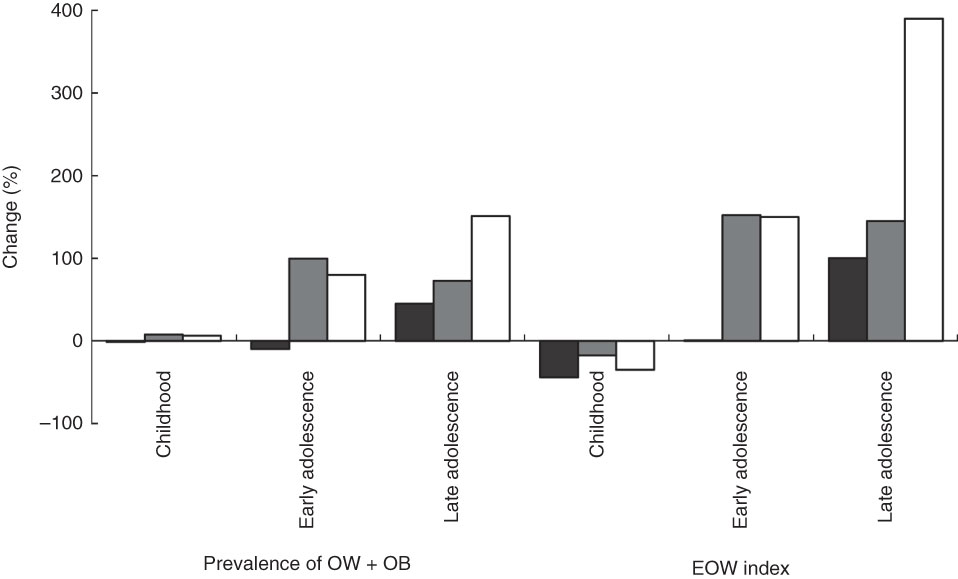
Fig. 5 Percentage changes in the prevalence of overweight (OW) and obesity (OB; according to International Obesity Task Force criteria(
Reference Cole, Bellizzi and Flegal
19
)) and extent of overweight (EOW) index in boys (n 7344) aged 3–18 years between three surveys (![]() , 1983–2000;
, 1983–2000; ![]() , 2000–2010;
, 2000–2010; ![]() , 1983–2010) according to age group, Kraków, Poland
, 1983–2010) according to age group, Kraków, Poland
Among girls in childhood (<12 years of age) overweight and obesity decreased between 1983 and 2010, and the EOW index decreased by 65 %. However, among early adolescent girls the prevalence of overweight and obesity increased by 41 %, and the EOW index increased by 94 %. Among late adolescents the indicators increased by 16 % and 64 %, respectively. These results show that among girls in 2010, the prevalence of overweight and obesity was greater in early and late adolescence when compared with 1983 (Table 4, Fig. 6).
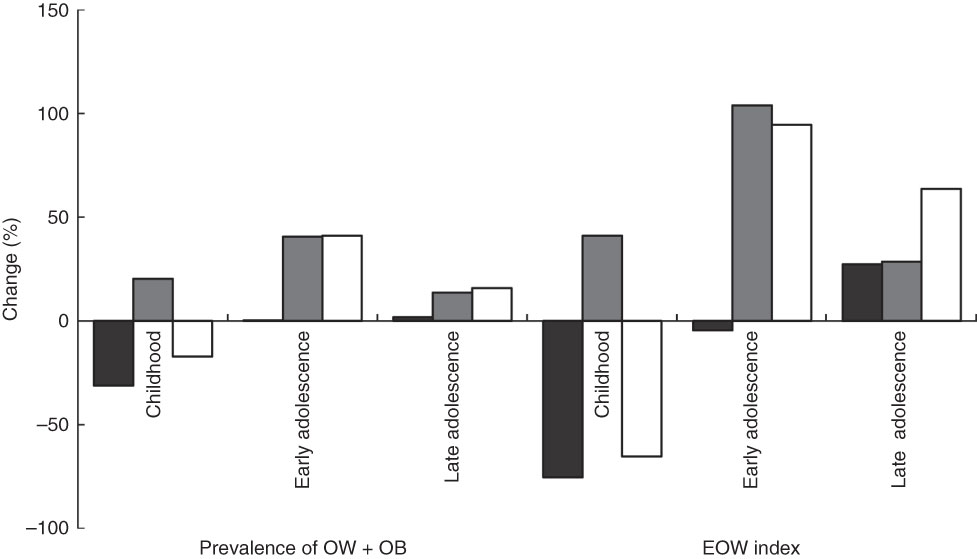
Fig. 6 Percentage changes in the prevalence of overweight (OW) and obesity (OB; according to International Obesity Task Force criteria(
Reference Cole, Bellizzi and Flegal
19
)) and extent of overweight (EOW) index in girls (n 7190) aged 3–18 years between three surveys (![]() , 1983–2000;
, 1983–2000; ![]() , 2000–2010;
, 2000–2010; ![]() , 1983–2010) according to age group, Kraków, Poland
, 1983–2010) according to age group, Kraków, Poland
The overweight and obese girls examined in 2010 were slightly more overweight than those who exceeded BMI thresholds from 1983. Importantly, the changes in overweight and obesity rates among girls were not as dynamic as among boys, and concerned mainly girls between 11 and 13 years of age.
Discussion
Our results show no difference between the populations of boys surveyed in 1983 and 2000 in terms of the general prevalence of overweight and obesity. Analysis in individual age groups, however, showed slight decreases in the youngest group age and in the group of early adolescent boys and increases in the group of late adolescent boys. By 2010 the prevalence of overweight and obesity among boys was greater by more than 38 % than in 2000, and detailed analysis showed increases in these rates in all the individual age groups, especially among early adolescents (by about 100 %) and late adolescents (by about 73 %). Based on the OW gap level, it was also observed that the BMI threshold was exceeded most by the boys in childhood in 1983 and by the boys in adolescence in 2010.
Among girls the prevalence of overweight and obesity did not change significantly from 1983 and 2010, although it was lowest in 2000. A detailed analysis in individual age groups showed that in 2000 the overweight and obesity rate decreased in the youngest age group, while in the remaining groups it did not change significantly. In 2010, the prevalence of overweight and obesity in girls was higher compared with 2000, especially in the youngest age group (by about 20 %) and among early adolescent girls (by more than 40 %). This showed in the OW gap in the youngest group of girls, which was 17 % greater in 2010 compared with 2000, and 40 % greater in the group of early adolescent girls.
The periods we are discussing in the present paper are especially significant. The 1980s and 1990s were a time of dramatic increases in the prevalence of overweight and obesity not only among adults, but also among children and adolescents in the USA and many countries of Western Europe( Reference Janssen, Katzmarzyk and Boyce 26 ). These changes ran parallel with the social, economic and lifestyle-related changes( Reference Cattaneo, Monasta and Stamatakis 9 , Reference Doak, Visscher and Renders 10 , Reference Strauss 27 ). That is why environmental factors, apart from genetic factors, are increasingly often mentioned as the main causes of obesity( Reference Caterson and Gill 28 , Reference Tabacchi, Giammanco and La Guardia 29 ). These include low physical activity and the consumption of high-energy and nutrient-poor foods( Reference Caterson and Gill 28 , Reference Rey-Lopez, Vicente-Rodríguez and Biosca 30 , Reference Rey-Lopez, Vicente-Rodríguez and Répásy 31 ), resulting in an excessive intake of energy( Reference Suchocka 32 ).
It is estimated in the period 1990–2010 in developed countries that the prevalence of overweight and obesity among 0–5-year-old children increased from 7·9 % to 11·7 % and it is anticipated that in 2020 the problem will concern 14·1 % of children in this age range( Reference De Craemer, De Decker and De Bourdeaudhuij 33 ). In the USA, the prevalence of obesity increased during the years 1971–2003 from 4 % to over 18 % among 6–11-year-old children, and from 4·6 % to over 17 % in adolescents( Reference Harris, Kuramoto and Schulzer 34 ). In Hungary, the prevalence of overweight and obesity among 7–18-year-old boys increased from about 10 % to about 18 % between 1980 and 2005( Reference Mészáros, Mészáros and Vögyi 35 ). Among Austrian 18-year-olds it increased from 14 % to almost 19 % in the period 1986–2000( Reference Schober, Rami and Kirchengast 36 ). Among Croatian 7-year-old boys, the prevalence of overweight increased from 10 % to 15 % during the period 1991–1999, although obesity decreased from 5 % to 4 %. Among Croatian girls of the same age, the rates increased from 7 % to 15 % and from 4 % to 8 %, respectively( Reference Bralić, Tahirović and Matanić 37 ).
Our research in Kraków showed no such drastic changes in the corresponding period. On the contrary, in the years 1983–2000 the prevalence of overweight and obesity in boys did not change and among girls it decreased. However, an increased prevalence of overweight and obesity among children and adolescents in Kraków did take place later, in the period 2000–2010 – by 38 % among boys and by 23 % among girls.
Undoubtedly, the increased prevalence of overweight and obesity among Polish children and adolescents can be linked to changes in the political and economic situation of Poland after 1989. The 1980s was a period of deep economic crisis, a consequence of the inept policies of the communist regime in the 1970s and 1980s (the time of growth for the children and adolescents in the 1983 survey)( Reference Krakowińska 38 ). The costs of transformation from the centrally controlled economy to a market economy( Reference Piech 39 ) resulted in yet another economic crisis in Poland (1990–1991), the period of growth for children surveyed in 2000. Generally, due to a decrease in real income, households were forced to reduce the level and quality of consumption. In the following years (1994–2000), the Polish economy was strengthened by successful structural reforms and a period of dynamic growth( Reference Grzega 40 ). The beginning of the 21st century was a period of economic stagnation, with a weakening economic growth and the associated significant increase in unemployment. In subsequent years (2003–2007) there was a return to the path of rapid economic growth (improvement in the labour market, further reduction in inflation, wage increase) and Polish integration with the European Union( Reference Grzega 40 ).
It is therefore obvious that in 2000, compared with 1983, boys showed no difference in the prevalence of overweight and obesity, except for late adolescents, while among girls one can even see a slight decline. Children and adolescents from 2000 grew up in a period of political and economic change in Poland where living conditions of ordinary citizens were deteriorating.
Positive changes in the Polish economy could be felt only after 2000 (gross domestic product increased from $US 1547/person in 1990 to $US 12 000/person in 2004 and $US 18 800/person in 2010)( 41 ), when the material situation improved and the availability of consumer goods increased. Polish accession to the European Union in 2004 resulted in the opening of borders and an intense westernization of the country( Reference Mazur 16 ). Unfortunately, it also brought about negative changes in diet and lifestyle, contributing to the increased prevalence of overweight and obesity in 2010, particularly among adolescent boys and girls.
One of the most adverse changes in lifestyle among children, adolescents and adults was undoubtedly a decrease in physical activity( Reference Sigmundová, Sigmind and Hamrik 42 ). Low physical activity may be due to the development of transport and general mechanization of life. Children are transported to pre-schools and schools by car or bus, which limits their walking opportunities( Reference Rey-Lopez, Vicente-Rodríguez and Biosca 30 , Reference Molnár and Livingstone 43 , Reference Azambuja, Netto-Oliveira and de Oliveira 44 ).
Another factor is the uncontrolled access to television (TV) or computers( Reference Sigmundová, Sigmind and Hamrik 42 ). Results of a Canadian study estimate that pre-school children spend 1–5 h in front of the TV or computer daily( Reference He, Irwin and Bouck 45 ). Similar data were obtained in the UK, USA, France and Spain( Reference Rey-Lopez, Vicente-Rodríguez and Biosca 30 , Reference Molnár and Livingstone 43 , Reference Wethington, Pan and Sherry 46 ). In Poland, nearly 20 % of 2-year-olds spend 3 h watching TV daily, among 4–12-year-olds it is already close to 40 %, while among 14-year-olds it is 42 %( Reference Drygas, Kwaśniewska and Kaleta 47 ). In older age groups, extracurricular activities that do not require physical activity (doing homework, studying) result in youths sitting for an average of 4·5 h/d. Sitting for more than 5 h/d is observed among roughly 30 % of boys and 25 % of girls( Reference Chabros, Charzewska and Rogalska-Niedźwiedź 48 , Reference Jodkowska, Tabak and Oblacińska 49 ). Research carried out in 2005/06 in Warsaw’s primary schools showed that extracurricular sports activities were undertaken by only about 38 % of boys and 35 % of girls, and were more often attended by younger students (11–13 years). With age, the percentage of boys in sports activities outside school was significantly reduced; for girls this trend was not observed( Reference Chabros, Charzewska and Rogalska-Niedźwiedź 48 ). These results may explain the sharp increase in the prevalence of overweight and obesity among boys in the 2010 series in our study, with the increase in BMI evidenced by the increase in EOW, especially in the older age groups. A similar trend among boys has been seen in the past decade in Portugal, Spain, Greece and Denmark, which researchers attributed to boys spending a large amount of free time on video games( Reference Rey-Lopez, Vicente-Rodríguez and Biosca 30 , Reference Albuquerque, Nobrega and Manco 50 – Reference Lissner, Mehling and Sjöberg 52 ).
Studies also show that watching TV encourages more frequent consumption of high-energy snacks( Reference Strauss 27 , Reference Caterson and Gill 28 , Reference Jodkowska, Tabak and Oblacińska 49 , Reference Ariza, Chen and Binns 53 , Reference Beyerlein, Toschke and Schaffrath Rosario 54 ), which is undoubtedly influenced by TV commercials. It is estimated that almost 50 % of TV advertising directed to children relates to food products, where 91 % are high in sugar, fat and salt( Reference Strauss 27 , Reference Tabacchi, Giammanco and La Guardia 29 , Reference Hare-Bruun, Nielsen and Kristensen 51 ). The quality of snacks, however, shows some differences based on sex, as confirmed by studies carried out in Denmark, Spain and Norway. Boys are more likely to eat chips, pizza, burgers, sweets, beer and soft drinks. Girls, on the other hand, often consume vegetables and fruit, mineral water and juices( Reference Rey-Lopez, Vicente-Rodríguez and Répásy 31 , Reference Hare-Bruun, Nielsen and Kristensen 51 ). This may result from more attention girls pay to maintaining a slim figure and a more frequent use of diets( Reference Lissner, Mehling and Sjöberg 52 , Reference Perek, Krzeczowska and Twarduś 55 , Reference Mota, Fidalgo and Silva 56 ).
The problem of weight control has so far been characteristic of the USA and Western Europe where it was found that pre- and adolescent girls are particularly concerned about their figure( Reference Tabacchi, Giammanco and La Guardia 29 ). In Central and Eastern Europe after 1989, a time of political transformation, the ideal of thinness spread as promoted by the Western media. A slim figure, as in Western countries, came to be associated not only with physical attractiveness, but also synonymous with belonging to a higher social class, achieving success in one’s career and life( Reference Włodarczyk-Bisaga, Dolan and McCluskey 57 – Reference Rathner 59 ). The perfect figure was to be achieved by diet, with not only late( Reference Włodarczyk-Bisaga, Dolan and McCluskey 57 ) but also early adolescents declaring regular dieting( Reference Kowal, Cichocka and Woronkowicz 60 ). A persistent desire to be slim was declared by 20 % of children aged 9 to 12 years( Reference Pilecki, Kowal and Woronkowicz 61 ). According to national data, in the beginning of the 21st century, 12–40 % of girls were on diets and many of them did so repeatedly. Older girls (16–21 years) were on a diet four times more often than younger girls. It can be argued that the percentage of girls considering themselves fat or convinced of the need for slimming grows with age( Reference Sobaś, Wądołowska and Słowińska 62 ). The slimming of girls observed in our study has also been observed among girls in Poznań (Poland), where the prevalence of overweight among 11–15-year-old girls was 9·6 % and 8·9 % among boys. Among 15–17-year-old girls it was 6·8 %, and 9·1 % among boys( Reference Krawczyński, Czarnecka and Wysocka-Gryczka 63 ). Our results are also consistent with those in other countries that have undergone a similar transformation as Poland( Reference Vignerová, Humeníkowá and Paulová 13 , Reference Tutkuviene 64 ). Slimming by girls has also been observed in some Western countries( Reference Moreno, Moliner-Urdiales and Ruiz 65 ). The high percentage of obese girls maintained in the 2010 series may, paradoxically, confirm the desire of girls to attain a slim figure. Adolescents often replace long-term diets with actions meant to bring about the desired effect in the short term. Such activities include unhealthy diets, consisting of dietary restrictions, consumption of diet pills and provoking vomiting. This type of action can produce an opposite effect and cause weight gain, even leading to obesity( Reference Neumark-Sztainer, Wall and Eisenberg 66 ).
In the case of the studied girls in 2010 it is interesting, however, that compared with 2000, we observed a higher percentage of the youngest and early adolescent girls with overweight and obesity and a higher BMI. It does not necessarily have to follow that these girls care less about their figures. It may be more associated with an earlier maturation of girls from the most recent cohort compared with girls examined 30 years earlier. This is evidenced by the time of their menarche (1983, 13·14 years; 2000, 12·86 years; 2010, 12·68 years)( Reference Kowal, Kryst and Woronkowicz 67 ). Sexual maturation is a highly dynamic biological process, associated with changes in volume, proportion and body composition( Reference Guo and Ji 68 ), preceded by a sharp increase in body weight, which is reflected in the increase in BMI( Reference Adair 69 , Reference De Leonibus, Marcovecchio and Chiarelli 70 ). Children maturing earlier have a higher BMI than their later-maturing peers. Therefore, the use of BMI as a cut-off point for qualifying individuals as overweight may result in incorrect inclusion of children who are more developed and not overweight( Reference Taylor, Falorni and Jones 71 ). The observed trend is consistent with the results of Vignerová et al.( Reference Vignerová, Humeníkowá and Paulová 13 ). A high percentage of overweight boys in the group of early adolescents in 2010 cannot be explained in the same way. It was observed that boys started to mature earlier, based on the development of pubic hair( Reference Kryst, Kowal and Woronkowicz 72 ), yet the results of studies on the relationship of adiposity to puberty are not consistent. Some support the increased adiposity in boys with earlier puberty, while others show an opposite trend( Reference Maciejczyk, Cempla and Gradek 73 , Reference Walvoord 74 ).
It should also be noted that despite the unfavourable changes in diet and lifestyle of the youngest age group, we observed no changes in the prevalence of overweight and obesity, and the levels of EOW indicated that children (<12 years of age) in 2010 were slimmer than their peers in 1983. A similar trend was found in recent years in the UK, France (3–14 and 7–9 years), Switzerland (6–13 years), Sweden (girls 10–11 years), the USA( Reference Stamatakis, Wardle and Cole 8 ), Germany, Denmark, Sweden, France( Reference Moss, Klenk and Simon 75 ) and Lithuania( Reference Jakimaviciene and Tutkuviene 76 ). This may be due to the fact that back in the 1970s and 1980s (when the children from the 1983 survey were born) overweight children were seen as healthy children, able to overcome malnutrition and infection( Reference Ebbeling, Pawlak and Ludwig 77 ). In subsequent years, excess body weight began to be seen as a health problem. Educational campaigns in the media have contributed to preventive measures being undertaken by parents or guardians of pre-school children, to prevent overweight( Reference Stamatakis, Wardle and Cole 8 , Reference De Craemer, De Decker and De Bourdeaudhuij 33 ). These activities involve, among other things, an increase in the number of hours spent by children in an active way, replacing sugary drinks with mineral water( Reference De Craemer, De Decker and De Bourdeaudhuij 33 ), and control of the quantity and quality of snacks consumed by children, all being more effective in younger age groups( Reference Hare-Bruun, Nielsen and Kristensen 51 ).
Conclusion
In summary, it can be stated that there was an increase in the prevalence of overweight and obesity in children and adolescents in Kraków over the period 2000 to 2010. This is undoubtedly associated with positive socio-economic changes that took place in Poland after 2000. The increased prevalence of overweight and obesity among boys was more intense and occurred in all age groups. Among girls the change in these rates was less intense and concerned mostly the youngest age group and early adolescents.
Acknowledgements
Financial support: The study survey was part of a project financed by the Polish Council for Science and Technology (grant number NN404 177 035) and by University School of Physical Education in Krakow (grant number 204/KA/206). Conflict of interest: The authors declared no conflict of interest. Authorship: M.K. and Ł.K. designed the experiment. M.K., A.W., Ł.K., J.S. and M.W.P. performed the experiment. A.W. and J.S. did all the calculations. M.K. wrote the first draft of this paper. M.K., Ł.K. and M.W.P. interpreted the results and contributed to later drafts, including the present paper. All authors were involved in data interpretation and critical revisions of the paper. All authors read and approved the final revised draft for publication. Ethics of human subject participation: The 1983 and 2000 examinations did not require ethical approval. The 2010 examinations were conducted according to the procedures in force, i.e. with the consent of the Bioethics Committee at the Regional Medical Association in Krakow (number 26/KBL/OIL/2007) and the consent of children’s parents or their legal guardians.


