


Accurate assessment of food intake in children is essential to conduct epidemiological research on diet–health links( Reference Livingstone, Robson and Wallace 1 ). Indeed, the importance of valid methods of diet and food intake assessment in epidemiological studies has increasingly been recognized( Reference Stefanik and Trulson 2 – Reference Young and Trulson 4 ) given the increasing prevalence of obesity, cardiovascular risk factors and other diseases with long-term consequences even in young populations( Reference Saland 5 , Reference Raitakari, Juonala and Kahonen 6 ). Therefore, evidence produced for young population groups could benefit from the use of valid dietary assessment tools in terms of an early identification and primary prevention of diet-related chronic diseases.
FFQ have often been used in large-scale epidemiological studies, because of their ease of administration and time and cost efficiency( Reference Subar 7 ) compared with other dietary assessment methods( Reference Thompson and Subar 8 ). However, all self-reporting methods of food intake and consumption are prone to measurement error leading to bias( Reference Fernández-Ballart, Pinol and Zazpe 9 ) suggesting that estimates may not represent the ‘true’ usual intake. More specifically, methods are affected by random and systematic errors leading to erroneous associations between diet and disease( Reference Schatzkin, Kipnis and Carroll 10 – Reference Kipnis, Subar and Midthune 12 ). Validation studies are therefore necessary to indicate the effect of measurement error and to prevent incorrect estimations( Reference Cade, Thompson and Burley 13 ). Validity refers to the ability of the instrument to discriminate between individuals with true exposure differences( Reference Bohlscheid-Thomas, Hoting and Boeing 14 ), where the test instrument is compared against a ‘reference method’( Reference Gibson 15 ) when available.
Intervention trials have shown that whole foods rather than individual nutrients may best indicate the potential role of the diet in disease prevention( Reference Neuhouser, Patterson and Thornquist 16 ), which additionally emphasizes the importance of validating dietary assessment methods in terms of food groups rather than nutrients. However, the ability of FFQ to quantify food intakes is not as well documented as their ability to quantify nutrient intakes( Reference Fernández-Ballart, Pinol and Zazpe 9 ). The food frequency section of the Children's Eating Habits Questionnaire (CEHQ-FFQ) was designed to investigate the consumption of foods, not of nutrients, previously shown to be consistently associated with overweight and obesity in children. Therefore, the aim of the present study was to evaluate the ability of the CEHQ-FFQ in estimating, specifically by age group, proxy-reported intakes of obesity-related foods. Food estimates obtained from the CEHQ-FFQ were compared with those obtained from two non-consecutive 24 h dietary recalls (24-HDR) as part of the IDEFICS (Identification and prevention of Dietary- and lifestyle-induced health EFfects In Children and infantS) Study.
Experimental methods
Study design and population
The IDEFICS Study is a prospective cohort study with an embedded intervention study carried out in eight European countries (Italy, Estonia, Cyprus, Belgium, Sweden, Germany, Hungary and Spain) with the aim of investigating the aetiology of diet- and lifestyle-related diseases and disorders in European children( Reference Ahrens, Bammann and Siani 17 ). A total of 16 224 children fulfilled the general IDEFICS inclusion criteria: complete information on sex, age, height and weight. The design and methodology of the IDEFICS Study have been described previously( Reference Ahrens, Bammann and Siani 17 ). Data for the current analysis were obtained from the baseline survey conducted between September 2007 and June 2008 among children aged 2–9 years. For the purposes of the present analysis, only children with two 24-HDR and a CEHQ-FFQ were included (n 2508; 1264 boys, 1244 girls). The study was conducted according to the guidelines laid down in the Declaration of Helsinki and all procedures involving human subjects were approved before the start of the examinations by the appropriate local ethics committees in each of the eight survey centres (Belgium: Ethical Committee of the Ghent University Hospital; Cyprus: Cyprus National Bioethics Committee; Estonia: Tallinn Medical Research Ethics Committee; Germany: Ethics Committee of the University of Bremen; Hungary: Egészségügyi Tudományos Tanács Tudományos és Kutatásetikai Bizottság in Budapest; Italy: Comitato Etico ASL in Avellino; Spain: Comité Ético de Investigación Clínica de Aragón (CEICA); Sweden: Regional Ethics Review Board, University of Gothenburg). Written informed consent was obtained from all children's parents.
Data on age, sex and parental education level were recorded by means of parental report on a questionnaire. Height and weight measurements were also taken by trained fieldworkers( Reference Ahrens, Bammann and Siani 17 , Reference Stomfai, Ahrens and Bammann 18 ).
Children's Eating Habits Questionnaire–food frequency section (CEHQ-FFQ)
The self-administered CEHQ-FFQ was designed as a screening tool to assess eating behaviours associated with risk of overweight, obesity and general health in children. Children's proxies, mainly the parents, filled it in at home by reporting the number of times the child consumed the food groups included in the questionnaire during a typical week over the previous month.
The whole CEHQ was pre-tested prior to the IDEFICS baseline survey in all involved centres( Reference Suling, Hebestreit and Peplies 19 ). Country-specific food examples were included to facilitate correct comprehension of the food groups included. The CEHQ-FFQ consisted of forty-three food groups which were clustered into thirty-six according to their nutritional profiles, as similarly done in other studies( Reference Hu, Rimm and Smith-Warner 20 – Reference Esfahani, Asghari and Mirmiran 22 ): (i) vegetables (cooked vegetables and legumes); (ii) fried potatoes; (iii) raw vegetables; (iv) fruit; (v) sweetened fruit; (vi) water; (vii) manufactured fruit juices; (viii) soft drinks; (ix) light soft drinks; (x) breakfast cereals; (xi) sweetened breakfast cereals; (xii) milk; (xiii) sweetened milk; (xiv) yoghurt; (xv) sweetened yoghurt; (xvi) fish; (xvii) fried fish; (xviii) fried eggs; (xix) eggs; (xx) mayonnaise; (xxi) cold cults; (xxii) meat (raw and cooked meat); (xxiii) cheese (sliced, spreadable and grated cheese); (xxiv) jam & honey; (xxv) chocolate/nut-based spread; (xxvi) butter & margarine; (xxvii) ketchup; (xxviii) white bread; (xxix) wholemeal bread; (xxx) pasta & rice; (xxxi) milled cereal; (xxxii) pizza; (xxxiii) fast food (hamburgers, hot dogs, kebabs, etc.); (xxxiv) nuts; (xxxv) snacks (crisps, popcorn, savoury pastries and fritters, etc.); and (xxxvi) sweets (chocolates, candy bars, biscuits, cakes, puddings, ice creams, etc.). To facilitate the proxy's responses, a frequency scale was adopted from the US Department of Agriculture eating habits questionnaire of the Early Childhood Longitudinal Survey( 23 ), consisting of the following categories of consumption: ‘never/less than once a week’, ‘1–3 times a week’, ‘4–6 times a week’, ‘1 time per day’, ‘2 times per day’, ‘3 times per day’, ‘4 or more times per day’ and ‘I have no idea’. These were converted into times per week ranging from 0 up to 30 and thereafter into daily. No portion size estimates were obtained. The CEHQ-FFQ showed acceptable reproducibility comparable to others( Reference Lanfer, Hebestreit and Ahrens 24 ). Furthermore, previous findings evaluating the CEHQ-FFQ( Reference Huybrechts, Bornhorst and Pala 25 ) found a positive correlation between milk consumption frequencies and respectively K and Ca urinary excretion ratios.
24 h Dietary recall
The ‘reference’ method was a computerized version of a 24-HDR, namely SACINA (Self Administered Children and Infants Nutrition Assessment). Two recalls were collected in 2508 participants. Children's proxies were interviewed by trained survey personnel. Each interview lasted an average of 20–30 min. Non-consecutive dietary recalls were conveniently distributed across weekdays and weekend days in an effort to capture intakes spread throughout the week. For the present analysis, average food intakes were computed as the mean of the two 24-HDR. Both the CEHQ-FFQ and the two 24-HDR were administered during the same time span.
The SACINA software is based on the HELENA-DIAT Dietary Assessment Tool software developed for European adolescents within the HELENA (Healthy Lifestyle in Europe by Nutrition in Adolescence) project( Reference Vereecken, Dohogne and Covents 26 , Reference Vereecken, Covents and Matthys 27 ). The program consists of a single 24-HDR structured according to six meal occasions (breakfast, mid-morning snack, lunch, afternoon snack, dinner and evening snack) embedded in questions related to a range of chronological daily activities( Reference Vereecken, Dohogne and Covents 26 – Reference Vereecken, Covents and Sichert-Hellert 29 ). Proxies were asked to recall all food and drinks consumed the previous day by their child. Survey personnel registered school meals data by direct observation. Portion size estimation was assessed mainly by photos of serving sizes, standard portions, customary packing size and foods in pieces or slices in order to reduce reporting bias. When a specific food was not available within the software it was entered manually specifying the total amount consumed. In Hungary, the procedure of collecting 24-HDR was different from that of the rest countries. Proxies were asked to complete a self-administered 24-HDR at home. This information was thereafter entered in the SACINA software by fieldwork personnel when received. Considering these methodological differences in the application of the 24-HDR, results excluding Hungary (n 1418) are presented as Supplementary Materials. The validity of SACINA was previously tested by means of the doubly labelled water method. Findings indicated the 24-HDR to be a valid instrument in assessing energy intake at group level (total energy intake – total energy expenditure = −0·23; C Börnhorst, S Bel-Serrat, I Pigeot et al., unpublished results).
To relate CEHQ-FFQ estimates of food consumption to those of the 24-HDR and to enable comparisons, it was assumed that ‘number of times per day’ as reported in the CEHQ-FFQ could be equated to ‘number of portions per day’( Reference Lean, Anderson and Morrison 30 ). Each reported 24-HDR food item was mapped and subsequently matched to one of the forty-three food groups initially included in the CEHQ-FFQ.
Statistical methods
Statistical analyses included all countries and were performed by age group (2–<6 years, 6–9 years) using the Predictive Analytics SoftWare (PASW) version 18. Means, medians and standard deviations were calculated for food group estimates obtained from the CEHQ-FFQ and 24-HDR. Crude data were log-transformed (log10) to improve normality for all thirty-six food groups. Food groups rarely consumed (<5 %) were excluded (i.e. meat replacement & soya products) from subsequent comparisons. Participants exceeding 25 % of missing values in the CEHQ-FFQ (n 43) were also excluded from the analysis( Reference Haftenberger, Heuer and Heidemann 21 ).
Pearson's and Spearman's rank correlation coefficients were calculated for all participants. Results were similar between Pearson and Spearman correlation coefficients, therefore only Pearson coefficients are shown. Correlation coefficients were corrected for attenuation due to random error in the 24-HDR by taking into account the ratio of within-person variance to between-person variance (variance ratio). De-attenuation of crude correlation coefficients was computed according to the equation from Willett( Reference Willett 31 ):
 $$ {{r}_{{\rm{adjusted}}}}\: = \:{{r}_{{\rm{observed}}}}\sqrt {1\: + \:{{\lambda }_x}/{{n}_x}} \eqno\rm$$
where λ x is the variance ratio for x and n x is the number of replicates for the x variables (here n = 2).
Agreement of the CEHQ-FFQ and 24-HDR in ranking individuals was examined by the construction of quartiles for each food group (non-adapted food groups). An alternative approach was used to address the issue of zero consumption observed for >25 % of the participants( Reference Haftenberger, Heuer and Heidemann 21 ). Non-consumers were considered as one group and the remaining participants were grouped into tertiles (adapted food groups)( Reference Truthmann, Mensink and Richter 32 ). Cross-classification analyses were finally applied in fourteen (fifteen in younger children) out of the thirty-six food groups: vegetables, fruit, milk, cold cuts, meat, cheese, white bread and sweets (non-adapted food groups) and, on the other hand, raw vegetables, fruit juices, soft drinks, breakfast cereals (only for younger children), sweetened milk, butter & margarine and wholemeal bread (as the adapted food groups). The proportion of individuals who fell into the same (correct classification) or into the extreme category (misclassification) was examined. The weighted kappa statistic (κ w) was calculated with a linear set of weights( Reference Altman 33 ) as a measurement of agreement. Bland–Altman limits of agreement (LOA)( Reference Mouratidou, Ford and Fraser 35 ) were calculated for frequently consumed foods to examine the agreement between the CEHQ-FFQ and the two 24-HDR. The mean differences (bias) between the two measurements (CEHQ-FFQlog – 24-HDRlog) were plotted v. their means ((CEHQ-FFQlog + 24-HDRlog)/2). The LOA define the limits within which 95 % of the differences are expected to fall (mean ± 2 sd of the difference).
Results
The general characteristics of the 2508 participants are shown in Table 1. Included participants were older, taller and heavier compared with the rest of the IDEFICS participants not included in the present analysis (data not shown).
Table 1 Baseline characteristics of study participants: children aged 2–9 years from eight European countries participating in the IDEFICS Study (2007–2008)
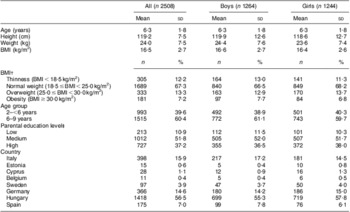
ISCED, International Standard Classification of Education.
†According to Cole et al.'s categories( Reference Cole, Bellizzi and Flegal 45 ). Thinness includes: thinness grade III, thinness grade II and thinness grade I.
‡Low = ISCED Levels 1 and 2; medium = ISCED Levels 3 and 4; high = ISCED Level 5. ISCED is an indicator of socio-economic level( 46 ).
At the group level, the CEHQ-FFQ provided higher estimates of number of portions than the 24-HDR for the majority of the food groups in both younger and older children (Tables 2 and 3). Significant differences across means were found for all food groups except for fried potatoes, sweetened fruit, milled cereal and fast food in children aged 2–<6 years (Table 2) and breakfast cereals and pizza in children aged 6–9 years (Table 3). Pearson correlation coefficients ranged from 0·01 for sweetened fruit to 0·45 for sweetened milk in younger children (Table 4) and from 0·01 for milled cereal to 0·42 for water in older children (Table 5) in absolute values. After correction for within-person variation, the de-attenuated Pearson correlation coefficients were slightly higher than the crude values (0·01 for sweetened fruit to 0·48 for sweetened milk in younger children and 0·01 for milled cereals to 0·44 for water in older children). The average de-attenuated coefficient for all food groups was 0·25 and 0·23 for younger and older children, respectively. Low de-attenuated coefficients values (<0·20) were observed in thirteen and fourteen out of the thirty-six food groups, respectively, for 2–<6-year-olds and 6–9-year-olds. A higher association (>0·40), however, was observed for fruit, water, breakfast cereals and sugared milk in young children and for raw vegetables, butter & margarine and water in older children. The average de-attenuated correlation coefficient was 0·25 and 0·23, respectively, for younger and older children.
Table 2 Food group intakes (daily number of portions) from the CEHQ-FFQ and 24-HDR: younger children aged 2–<6 years from eight European countries participating in the IDEFICS Study (2007–2008)
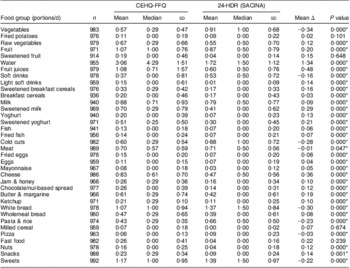
CEHQ-FFQ, Children's Eating Habits Questionnaire–food frequency section; 24-HDR, 24 h dietary recall; SACINA, Self Administered Children and Infants Nutrition Assessment; Δ, difference.
*P < 0·05.
Table 3 Food group intakes (daily number of portions) from the CEHQ-FFQ and the 24-HDR: older children aged 6–9 years from eight European countries participating in the IDEFICS Study (2007–2008)
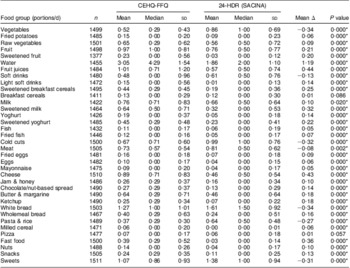
CEHQ-FFQ, Children's Eating Habits Questionnaire–food frequency section; 24-HDR, 24 h dietary recall; SACINA, Self Administered Children and Infants Nutrition Assessment; Δ, difference.
*P < 0·05.
Table 4 Pearson correlation coefficients between food group intakes (daily number of portions) from the CEHQ-FFQ and the 24-HDR: younger children aged 2–<6 years from eight European countries participating in the IDEFICS Study (2007–2008)
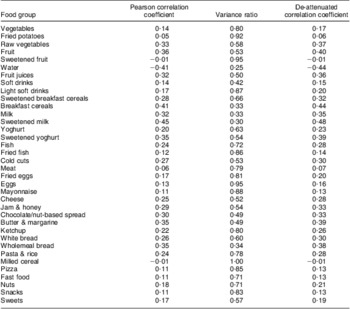
CEHQ-FFQ, Children's Eating Habits Questionnaire–food frequency section; 24-HDR, 24 h dietary recall.
Table 5 Pearson correlation coefficients between food group intakes (daily number of portions) from the CEHQ-FFQ and the 24-HDR: older children aged 6–9 years from eight European countries participating in the IDEFICS Study (2007–2008)
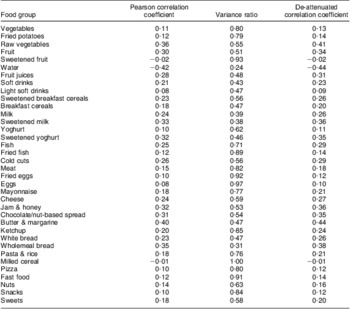
CEHQ-FFQ, Children's Eating Habits Questionnaire–food frequency section; 24-HDR, 24 h dietary recall.
Cross-classification agreement and κ w values are presented in Tables 6 and 7, showing the ability of the CEHQ-FFQ to classify individuals into the same quartile of intake estimated by the 24-HDR. Among the non-adapted groups, the proportion classified in the same quartile varied from 26 % for sweets to 39 % for milk in children aged 2–<6 years (mean = 32 %) and from 28 % for meat to 34 % for fruit in children aged 6–9 years (mean = 31 %). Extreme misclassification was about or even lower than 12 % for all food groups in both younger and older children; the highest values were observed for white bread (12 %) in young children and cheese (11 %) in older children. Mean κ w was 0·20 for 2–<6-year-old children and 0·17 for 6–9-year-old children. The κ w values showed an acceptable agreement for fruit, milk, cold cuts, cheese and white bread, whereas low agreement (<0·20) was seen for vegetables, meat and sweets in both age groups. Results changed when examining the adapted food groups, since the proportion of correct classification ranged from 38 % for wholemeal bread to 49 % for sweetened milk in younger children (mean = 40 %) and from 32 % for wholemeal bread to 52 % for sweetened milk in older children (mean = 38 %). The mean proportion of individuals classified into the opposite tertile, however, was 22 % in both age groups, varying from 10 % and 6 % for sweetened milk to 29 % and 28 % for soft drinks in younger and older children, respectively. Mean κ w for the adapted food groups was 0·20 for children aged 2–<6 years and 0·17 for those aged 6–9 years. Poor agreement was found except for sweetened milk, which showed acceptable agreement in both younger and older children (κ w = 0·30 and 0·36, respectively). Among younger children, breakfast cereals and butter & margarine also showed acceptable agreement (>0·20).
Table 6 Cross-classification by quartile of food group intakes from the CEHQ-FFQ and the 24-HDR: younger children aged 2–<6 years from eight European countries participating in the IDEFICS Study (2007–2008)
CEHQ-FFQ, Children's Eating Habits Questionnaire–food frequency section; 24-HDR, 24 h dietary recall; κ w, weighted kappa statistic.
For fried potatoes, sweetened fruit, water, light soft drinks, sweetened breakfast cereals, yoghurt, sweetened yoghurt, fish, fried fish, fried eggs, eggs, mayonnaise, jam & honey, chocolate/nut-based spread, ketchup, pasta & rice, milled cereal, pizza, fast food, nuts and snacks, ranking into quartiles or tertiles was not possible since >25 % of the participants did not consume these foods on each recall day.
†Within that food groups, zero consumers were considered as one group and tertiles were constructed for the remaining participants.
Table 7 Cross-classification by quartile of food group intakes from the CEHQ-FFQ and the 24-HDR: older children aged 6–9 years from eight European countries participating in the IDEFICS Study (2007–2008)
CEHQ-FFQ, Children's Eating Habits Questionnaire–food frequency section; 24-HDR, 24 h dietary recall; κ w, weighted kappa statistic.
For fried potatoes, sweetened fruit, water, light soft drinks, sweetened breakfast cereals, breakfast cereals, yoghurt, sweetened yoghurt, fish, fried fish, fried eggs, eggs, mayonnaise, jam & honey, chocolate/nut-based spread, ketchup, pasta & rice, milled cereal, pizza, fast food, nuts and snacks, ranking into quartiles or tertiles was not possible since >25 % of the participants did not consume these foods on each recall day.
†Within that food groups, zero consumers were considered as one group and tertiles were constructed for the remaining participants.
Following exclusion of the Hungarian data, de-attenuated correlation coefficients were slightly higher compared with the crude coefficients, with an average of 0·31 in 2–<6-year-old children and 0·28 in 6–9-year-old children (Supplementary Materials, Tables 3 and 4). Average variance ratio increased to 0·64. Supplementary Materials, Tables 5 and 6 show the results of the cross-classification analysis excluding the Hungarian data. The mean percentage of correctly classified subjects increased to 35 % in younger children and to 32 % in older children. Mean extreme misclassification was considerably lower for both younger (5 %) and older children (7 %). The κ w values showed acceptable agreement except for sweets and fruit, for which it was poor (<0·20) and moderate (>0·40), respectively, in both younger and older children. Vegetables, milk and meat also showed poor agreement among 6–9-year-old children. Regarding the adapted food groups, the mean proportion of individuals classified into the same tertile increased in both age groups compared with the non-adapted food groups. Average misclassification of individuals into the opposite tertiles decreased, being 16 % and 20 %, respectively, for 2–<6-year-old and 6–9-year-old children. Higher mean κ w values were obtained: 0·20 in younger children and 0·14 in older children.
Figure 1 (Supplementary Materials) illustrates findings of the Bland–Altman analysis representative of the observed trends. For most food groups (vegetables, raw vegetables, breakfast cereals, sweetened milk, cold cuts, meat, cheese, butter and sweets), a systematic increase in difference between the two methods with increasing intake was observed indicating worse agreement at higher intakes. For fruit, fruit juices, soft drinks, milk, white bread and wholemeal bread, however, a double interpretation is possible. When considering intakes within the LOA only, it was observed that the agreement between methods was similar regardless of the average intake. On the other hand, beyond the LOA, it seemed that when mean intake increased the bias also increased up to a certain value, after which it started decreasing.
Discussion
The aim of the present study was to evaluate the ability of the CEHQ-FFQ in estimating age group-specific proxy-reported intakes of obesity-related foods compared with two 24-HDR (SACINA). To the authors’ knowledge, the present study is the largest one carried out in children in which relative validity has been evaluated through food group intakes. Results showed wide differences in relative validity across the different food groups, emphasizing the importance of validating dietary assessment methods in terms of food groups rather than nutrients. It should also be considered that comparison of findings among validation studies is compromised by differences among the type of FFQ administered, sample size, food groups examined, unit of estimates, use of reference method, recall period or number of recorded days( Reference Mouratidou, Ford and Fraser 35 ).
As expected, the CEHQ-FFQ gave higher mean intakes as opposed to the 24-HDR, a tendency also observed in previous studies carried out in adults and/or children( Reference Bohlscheid-Thomas, Hoting and Boeing 14 , Reference Esfahani, Asghari and Mirmiran 22 , Reference Mouratidou, Ford and Fraser 35 – Reference Blum, Wei and Rockett 37 ). Our findings suggest that episodically consumed food groups such as milled cereal, light soft drinks, fast food and sweetened fruit tended to be over-reported by the CEHQ-FFQ in this population group. This can partly be explained by the difficulty of the 24-HDR to capture infrequently consumed products, especially in children with highly varying diets and rapidly changing food habits( Reference Thompson and Subar 8 ).
More specifically, the low crude correlations observed increased slightly following correction for attenuation effect in the 24-HDR. Correlations tended to be stronger for foods with higher frequency of consumption, again indicating current problems in the assessment of episodically consumed foods. Respectively for younger and older children, fifteen and ten out of the thirty-six foods groups had correlation coefficients within the range of 0·3–0·8 as shown by others( Reference Fernández-Ballart, Pinol and Zazpe 9 , Reference Bohlscheid-Thomas, Hoting and Boeing 14 , Reference Esfahani, Asghari and Mirmiran 22 , Reference Andersen, Lande and Trygg 36 , Reference Huybrechts, De Backer and De Bacquer 38 ). Coefficients for fruit (younger children), water, fish, cheese or white bread were comparable to or even higher (raw vegetables, sweetened milk (younger children), chocolate/nut-based spread, wholemeal bread and pasta & rice) than those found in a validation study conducted with Belgian adolescents( Reference Matthys, Pynaert and De Keyzer 39 ). Similarly, low coefficients for cooked vegetables (0·17 in younger children and 0·13 in older children) and for fried potatoes in older children (0·14) were comparable to those of an American validation study in 8–9-year-old students( Reference Baranowski, Smith and Baranowski 40 ).
Correlations from food frequency instruments have generally been shown to be lower in child and adolescent populations than among adults( Reference Thompson and Subar 8 ). Such observations could be partly attributed to the effect of proxy reporting, as proxies are conditioned by their ability to accurately recall their children's food intake( Reference Livingstone and Robson 41 ). Additionally, parents as proxies seem to be reliable reporters in the home setting( Reference Livingstone and Robson 41 ) but the opposite is true for food intake out of home( Reference Livingstone and Robson 41 ). This limits parents’ suitability as the sole informants of their children's intake.
Findings from the cross-classification analyses varied by food group and at times demonstrated the rather limited ability of the questionnaire to discriminate between quartiles of food groups. A third of the participants were allocated into the same category by both methods and on average only 7 % and 8 % of younger and older children, respectively, were likely to be classified into the opposite quartile. Although among the adapted food groups the proportion of misclassified individuals increased, higher agreement between the methods was found in terms of classification. Percentage agreement and misclassification were within the ranges reported by other authors( Reference Bohlscheid-Thomas, Hoting and Boeing 14 , Reference Haftenberger, Heuer and Heidemann 21 , Reference Huybrechts, De Backer and De Bacquer 38 ) for the non-adapted food groups. However, the degree of misclassification observed among the adapted groups was remarkably higher compared with previous studies( Reference Bohlscheid-Thomas, Hoting and Boeing 14 , Reference Haftenberger, Heuer and Heidemann 21 , Reference Huybrechts, De Backer and De Bacquer 38 ). Findings from the κ w analysis also confirmed fair agreement between the CEHQ-FFQ and 24-HDR.
In general, no great differences were observed by age group in terms of correlation coefficients and agreement between the CEHQ-FFQ and 24-HDR, since values were similar for most of the food groups. It is noteworthy, however, that correlation coefficients for some highly consumed food groups – i.e. fruit, breakfast cereals, milk, sweetened milk and yoghurt – were considerably higher in younger children compared with those obtained among their older peers. Similarly, κ w values were also higher for milk, white bread, sweetened milk and butter & margarine in 2–<6-year-old children. This can be explained by the fact that younger children are less likely to be unsupervised during in-home and out-of-home eating than older children( Reference Livingstone, Robson and Wallace 1 , Reference Livingstone and Robson 41 ). Consequently, parents become more reliable reporters and more capable of reporting their children's intake in an accurate way.
The lack of agreement between methods of assessment observed in children has often been attributed to a number of factors( Reference Livingstone and Robson 41 ), including the use of proxy reporting as discussed earlier, the nature of the diet of young age groups and the lack of a gold standard for directly assessing the validity or relative validity of FFQ, among others( Reference Cade, Thompson and Burley 13 ). Moreover, FFQ validity is highly conditioned by the reference method, which is also subject to instrument-specific limitations. In addition, proxies reported the 24-HDR, who tend to under-report intake( Reference Thompson and Subar 8 ). It should be noted that the European Food Consumption Survey Method (EFCOSUM) has recommended the use of two or more non-consecutive 24 h recalls as the best method to assess food consumption in individuals aged 10 years and above in different European countries( Reference Biro, Hulshof and Ovesen 42 ).
Dietary information is affected by high day-to-day variability in children's diets( Reference Thompson and Subar 8 ), which could explain the lack of agreement between methods. This influence could be minimized by an increase in the number of recording days, but long recording periods reduce the accuracy of recording owing to increasing fatigue and boredom, potential alterations of dietary habits and increasing likelihood of drop-outs( Reference Gibson 43 ). Additionally, the large sample size included in the present study makes up for the small number of replicates to keep the same precision of the corrected correlation coefficient( Reference Cade, Thompson and Burley 13 ). Moreover, the fact that portion sizes were not assessed in the CEHQ-FFQ might also affect the agreement between both methods; i.e. overestimation of foods consumed in small quantities and underestimation of those consumed in higher quantities. Considering the increased respondent burden however, no attempts were done to capture portion sizes in the current study( Reference Cade, Thompson and Burley 13 ). Our sample differed from the IDEFICS whole sample in terms of baseline characteristics, which means that these results might not be generalized to all participating children. However, no differences were found for BMI which is considered to be an indicator of misreporting( Reference Forrestal 44 ).
As stated before, Hungary collected the 24-HDR information differently from the other survey centres and this is considered as one of the study limitations influencing the generalizability of its results. Our findings suggest that when Hungarian data were excluded, the strength of the associations between the CEHQ-FFQ and the 24-HDR increased. In fact, the number of food groups showing moderate correlation coefficients increased and the number of slight correlations decreased. Furthermore, when cross-classification analyses were applied, without considering Hungarian data the degree of agreement in both non-adapted and adapted food groups increased. Indeed, the proportions of correctly classified individuals as well as κ w values improved towards higher values, whereas the percentages of grossly misclassified individuals decreased.
To our knowledge, the present study is the first one performed in a large sample of European children of (pre)school age in which proxy-reported data obtained from an FFQ were compared with those from two 24-HDR. Another important strength of the study is standardized procedures followed during the data collection of the IDEFICS fieldwork( Reference Ahrens, Bammann and Siani 17 ). High-quality control procedures were applied during the different stages of the project, including checks for plausibility already implemented in the database and performed during data entry. In addition, the reference method used in the study was previously validated with the doubly labelled water method considered as the ‘gold standard’ method for this purpose. Furthermore, portions/d were used instead of g/d offering newer approaches and insights into validation studies using FFQ despite associated limitations.
Conclusions
Findings of the present study suggest that the strength of association estimates assessed by the CEHQ-FFQ and the 24-HDR varied by food group intakes and by age group. In addition, the ability of the CEHQ-FFQ to rank children according to intakes of food groups was lower than expected but in line with other studies. Overall, these results suggest low agreement for the majority of food groups examined by a proxy-estimated FFQ and two 24-HDR in a large sample of 2–9-year-old European children. However, one should consider that both instruments are subject to measurement errors affecting the strength of the association. In that sense, the CEHQ-FFQ could provide acceptable food estimates at group level. It is of great importance to detect true diet–disease relationships with the aim to develop public health strategies to prevent children from suffering chronic diseases. For that reason, validation studies are indispensable to test the validity and appropriateness of dietary assessment methods used within epidemiological surveys to accurately assess food intake.
Acknowledgements
Sources of funding: This work was done as part of the IDEFICS Study and is published on behalf of its European Consortium (www.idefics.eu). The work received financial support from the European Community within the Sixth RTD Framework Programme Contract No. 016181 (FOOD). The information in this document reflects the authors’ views and is provided as is. S.B.-S. was funded by a grant from the Aragon Regional Government (Diputación General de Aragón, DGA). Conflicts of interest: The authors reported no conflicts of interest. Authors’ contributions: The authors contributed as follows: L.A.M., V.K., D.M., A.S. and T.V. planned and directed the study; S.B.-S., J.M.F.-A., C.B. and G.E. conducted the research; S.B.-S. wrote the manuscript and performed statistical analyses; T.M., L.A.M., I.H., C.B., V.P. and V.K. participated in data interpretation; S.B.-S., T.M., L.A.M., V.P., I.H., C.B., J.M.F.-A., C.H., G.E., A.H., L.L., A.S., V.K., D.M. and T.V. critically discussed and reviewed the manuscript. All authors read and approved the final manuscript.
Supplementary Materials
For Supplementary Materials for this article, please visit http://dx.doi.org/10.1017/S1368980012005368


