


Significant racial and ethnic disparities in overweight and obesity prevalence exist, with higher age-adjusted prevalence among non-Hispanic blacks (76·7 %) and Hispanics (78·8 %) compared with non-Hispanic whites (66·7 %)( Reference Flegal, Carroll and Kit 1 ). Non-Hispanic black women aged 40 years or older are particularly affected by the overweight and obesity epidemic, with 87·7 % of 40–59-year-olds being overweight or obese compared with 61·3 % of non-Hispanic whites and 86·4 % of those aged 60 years and over being overweight or obese compared with 71·6 % of non-Hispanic whites( Reference Flegal, Carroll and Kit 1 ). Additionally, non-Hispanic black women have a higher combined prevalence of class II (BMI≥35·0 kg/m2) and class III obesity (BMI≥40·0 kg/m2) compared with non-Hispanic whites, with 26·0 % classified as class II and III obese compared with 14·4 %, respectively( Reference Flegal, Carroll and Kit 1 ). Similarly, geographic disparity exists in weight status, with national estimates for obesity being higher in rural regions of the USA compared with urban areas( Reference Jackson, Doescher and Jerant 2 , Reference Befort, Nazir and Perri 3 ). Data from the 2005–2008 National Health and Nutrition Examination Survey indicated that the obesity prevalence in rural areas was 39·6 % compared with 33·4 % in urban areas( Reference Befort, Nazir and Perri 3 ).
Dietary intake remains an important focus in the prevention of overweight and obesity. Consumption of less energy and fatty foods, and more fruits and vegetables, is associated with lower BMI( Reference Perez-Escamilla, Obbagy and Altman 4 ). Consequently, total energy, fat and fruit and vegetable intakes are commonly measured to study dietary intake and its relationship with chronic disease, weight gain prevention and weight loss. Multiple 24 h dietary recalls are often used to measure dietary intake and frequently used to validate other self-reported dietary measures such as FFQ and targeted screening instruments( Reference Resnicow, Odom and Wang 5 – Reference Cade, Thompson and Burley 7 ).
Shorter dietary measures such as screeners have been developed and validated against 24 h dietary recalls to address feasibility limitations posed by collecting multiple 24 h food records( Reference Buzzard 8 ). Such instruments include the Fruit and Vegetable Consumption Module (hereafter, ‘FV module’) from the Behavioral Risk Factor Surveillance System (BRFSS)( Reference Serdula, Coates and Byers 9 ) and the Percentage Energy from Fat Screener (hereafter, ‘fat screener’) developed by the National Cancer Institute (NCI)( Reference Thompson, Midthune and Subar 10 , Reference Thompson, Midthune and Williams 11 ). Both instruments have been widely used to measure fruit and vegetable intake, and fat intake, respectively, and have been shown to be acceptable in terms of both reliability and validity( Reference Serdula, Coates and Byers 9 – Reference Snyder, Sloane and Lobach 15 ). One study evaluating the use of the BRFSS FV module in a diverse population (diverse in age, gender, education and geographic location) found that the mean daily consumption of fruits and vegetables measured by the module was comparable to the mean daily consumption measured by food records or recalls( Reference Serdula, Coates and Byers 9 ). Data from that study were collected from participants living in different states and although the correlation coefficients between the BRFSS FV module and the food records or recalls varied across subgroups, they were moderate in agreement and ranged from 0·34 to 0·66( Reference Serdula, Coates and Byers 9 ). Similarly, another study evaluated the use of the NCI fat screener and found moderate correlations between true intakes and the screener, ranging from 0·58 for women and 0·64 for men( Reference Thompson, Midthune and Subar 10 ). Mean percentage energy from fat was also comparable, with an estimated 30·1 % from two 24 h dietary recalls and 29·9 % from the NCI fat screener( Reference Thompson, Midthune and Subar 10 ).
To our knowledge, the validity of these instruments has not been extensively explored among high-priority sub-populations, in particular among low-income African-American women. Factors such as race/ethnicity, BMI, education level and age may impact validity( Reference Cade, Thompson and Burley 7 , Reference Marks, Hughes and van der Pols 16 – Reference Block and Hartman 18 ). The NCI fat screener, for example, did not perform as well in a study site comprised mostly of African-American participants compared with other sites with fewer African-American study participants( Reference Thompson, Midthune and Williams 11 ). These investigators, much like others, suggested that dietary instruments used in studies be tailored to measure the specific diet of the target population( Reference Cade, Thompson and Burley 7 , Reference Thompson, Midthune and Williams 11 ). Additionally, Marks et al. have found that BMI, occupation, age, gender, education and the presence of any medical condition are significantly associated with differences in the validity of measures of certain nutrient intakes and/or energy intake( Reference Marks, Hughes and van der Pols 16 , Reference Marks, Hughes and van der Pols 17 ). Educational attainment and literacy can also affect validity( Reference Block and Hartman 18 ). These factors may moderate validity in a number of ways: BMI may impact social desirability and self-reported dietary intake (under-reporting or over-reporting); age may impact recall; and literacy may impact the ability of the respondent to understand and interpret dietary instruments.
Characterizing the associations between the BRFSS FV module, the NCI fat screener and repeated, unannounced, telephone 24 h dietary recalls within an overweight and obese African-American population will contribute to a long-term goal of understanding the performance of these instruments in a variety of settings. We expected that self-reported fruit and vegetable intake as measured by the BRFSS FV questions would at best moderately correlate with fruit and vegetable intake assessed by 24 h recalls. We expected the NCI fat screener to perform likewise with respect to dietary fat intake. Further, we hypothesized that the two instruments would perform similarly when examining correlations across categories of BMI, education, employment and age, with self-reported fruit and vegetable intake showing stronger correlations among African-American women who are overweight (compared with obese), college educated (compared with those with less educational attainment), younger and employed.
Methods
Data presented here were collected as part of a larger study called Healthy Homes/Healthy Families, a randomized controlled trial testing the effectiveness of a home-based coaching intervention to promote healthier home food and physical activity environments, with the goal of preventing weight gain over time. Participants were recruited in partnership with three federally qualified health centres, spanning nine clinic sites. Participants were females aged 35–65 years with BMI≥25·0 years, who lived with at least one other person and resided within 30 miles (~48 km) of the referring clinic.
Trained interview staff collected data at baseline and at 6 and 12 months post-baseline via telephone interviews. At each data collection point, participants were asked to complete telephone interviews that included two 24 h dietary recalls (one weekday and one weekend day), the BRFSS FV module and the NCI fat screener. Baseline data collection took place over an average of 34·4 d; the average time elapsed between the two recalls was 12·8 d, with over 70 % of recalls being completed within two weeks. The screeners were administered during the third interview right after the second dietary recall. The study was approved by the Emory University Institutional Review Board and verbal informed consent was obtained by telephone. Dietary intake data presented here are from baseline only, prior to any intervention-related encounters, and include only African-American participants.
Measures
All instruments were self-reported and administered by trained telephone interviewers. Dietary intake data from the BRFSS FV module, the NCI fat screener and two 24 h dietary recalls were included in analyses, along with BMI, age, employment and education level.
Fruit and vegetable intake
Six items from the 2005 BRFSS FV module were used to assess fruit and vegetable intake( 19 ). Items were assessed in frequencies of per day, week, month or year. Total intake per day was calculated as a sum from the individual items.
Percentage of daily energy from fat
The NCI fat screener included seventeen items that assessed the percentage of daily energy from fat( Reference Thompson, Midthune and Subar 10 , Reference Thompson, Midthune and Williams 11 ). Participants were asked about the frequency with which they ate or drank a range of items in the past 12 months. Response categories were as follows: ‘never’, ‘less than once per month’, ‘1–3/month’, ‘1–2/week’, ‘3–4/week’, ‘5–6/week’, ‘1/day’ and ‘2+/day’. Percentage energy from the fat screener was determined using the 2003 scoring procedures from NCI (http://riskfactor.cancer.gov/diet/screeners/fat/scoring.html).
Twenty-four-hour dietary recall
Dietary intake, including fruit and vegetable intake and fat intake, was collected and analysed using the Nutrition Data System for Research (NDSR) software version 2010, developed by the Nutrition Coordinating Center, University of Minnesota, Minneapolis, MN, USA( Reference Schakel, Sievert and Buzzard 20 – Reference Schakel 22 ). Two recalls were collected per participant, with one weekday and one weekend recall, administered at two separate interviews. Participants were mailed a copy of a Foods Amount Booklet to assist with estimating portion sizes reported during the recall interviews. The first recall was followed by a physical activity measure; the second recall preceded the BRFSS FV module and the NCI fat screener. Fruit, fat and vegetable intakes can be assessed using NDSR, along with intakes of energy and other nutrients and food groups. Fruit and vegetable intake was determined by summing all individual fruit and vegetable servings from the NDSR output (except for any intake of fried potatoes) for each of the two recalls. Fat intake was used as provided in the NDSR output.
Demographics
Age (date of birth), race/ethnicity, employment status, annual household income, marital status and education level were assessed using items adapted from the 2005 BRFSS survey( 19 ).
BMI
Self-reported weight (without shoes, in pounds) and height (in feet and inches) were assessed at baseline using two items from the 2005 BRFSS survey( 19 ) and used to calculate BMI. BMI<18·5 kg/m2 is considered underweight, 18·5–24·9 kg/m2 is healthy weight, 25·0–29·9 kg/m2 is overweight and BMI≥30·0 kg/m2 is considered obese, with class I, class II and class III obesity defined as BMI of 30·0–34·9 kg/m2, 35·0–39·9 kg/m2 and ≥40·0 kg/m2, respectively.
Neighbourhood type
Participants were asked to describe their neighbourhoods as ‘in town’, ‘in the country or rural area with neighbours close by’ or as ‘in the country with very few neighbours close by’. The question and response options were created by the study team using qualitative data from a previous study( Reference Kegler, Escoffery and Alcantara 23 ).
Statistical analyses and power
Power calculations were based on detecting a significant intervention effect for the larger intervention trial; thus sample size was not determined with the stratified analyses conducted for the present paper in mind. The analyses included all participants with complete data for the three instruments. No exclusion of very high or very low energy intakes was made. The intake of fruits and vegetables as well as the percentage of energy from fat were calculated as means from the two 24 h dietary recalls. Descriptive statistics for data collected with all three instruments were calculated. Deattenuated Pearson correlation coefficients for fruit and vegetable intake (BRFSS FV module and 24 h dietary recall data) and fat intake (NCI fat screener and 24 h dietary recall data) were calculated accounting for within-person variation from the dietary recalls( Reference Beaton, Milner and McGuire 24 ). Bland–Altman plots were used to examine agreement between the variables estimated by the 24 h recall and the shorter instruments across a range of intakes. This technique plots the difference between the methods against the mean of the two methods for each participant( Reference Bland and Altman 25 ). Differences were calculated by subtracting the NDSR fruit and vegetable intake value from the BRFSS intake value, and the NDSR value for percentage of energy from fat from the NCI fat screener value. Analyses were performed with and without outliers, with outliers retained in the analyses reported here. All analyses were conducted using the statistical software package SAS version 9·3.
Results
Over a 22-month recruitment period (February 2011–December 2012), a total of 945 women were referred to the study. Of the 945 women, 510 (54 %) were enrolled in the study; 197 were non-responders to call attempts and letters (21 %), 161 refused to participate (17 %), sixty-four were ineligible (7 %) and thirteen were dropped from recruitment for various reasons (1 %). Of those enrolled, 260 African-American women completed all dietary instruments including both baseline 24 h dietary recalls, the BRFSS FV module and the NCI fat screener.
The participants in the sample were mostly unemployed or retired (55·00 %) and low income (71·15 % reported an annual household income below $US 25 000; Table 1). Most were single (52·35 %) and had high-school education or less (58·69 %). A majority lived in town, but about 45 % of participants reported residing in a rural area. The average BMI was 39·02 (sd 8·66) kg/m2, ranging from 25·08 to 75·35 kg/m2.
Table 1 Description of the study participants: African-American women (n 260) aged 35–65 years, south-west Georgia, USA, February 2011–December 2012

GED, General Educational Development.
Percentages might not add up to 100 % due to rounding or missing data.
Daily fruit and vegetable intake
Fruit and vegetable intake as measured using the BRFSS FV module was on average 2·79 (sd 1·88) servings/d, ranging from a minimum of 0·09 to a maximum of 9·32 servings/d (Table 2). The average intake from the recalls was slightly lower (mean=2·66 servings/d) but had a higher standard deviation (sd=2·66 servings/d) and a range from zero to 27·65 servings/d. Looking at fruit and vegetable intake by BMI, education and age, there were surprisingly small differences in average intake but large standard deviations across all subgroups.
Table 2 Mean daily servings of fruits and vegetables from two 24 h dietary recalls and the BRFSS FV module, and corresponding deattenuated Pearson correlation coefficients between the two methods, among African-American women (n 260) aged 35–65 years, south-west Georgia, USA, February 2011–December 2012

BFRSS FV module, Behavioral Risk Factor Surveillance System’s Fruit and Vegetable Consumption Module; GED, General Educational Development.
*P<0·05, **P<0·01, ***P<0·001.
† The average fruit and vegetable intake as assessed with the 24 h dietary recalls was slightly higher (2·82) when including French fries; the deattenuated correlation coefficient was slightly smaller (0·22).
‡ Difference was calculated by subtracting the 24 h recall intake from the BRFSS intake.
The deattenuated correlation coefficient for fruit and vegetable intake for the overall sample was low (r=0·22). There was large variation across BMI categories, with the overweight category having the highest validity (r=0·53). The deattenuated correlation coefficient for the class I and II obese participants (30·0 kg/m2 ≤ BMI<40·0 kg/m2) and class III obese participants (BMI≥40·0 kg/m2) were low (r=0·19 and r=0·23, respectively). When looking at education strata, the validity was extremely low for those participants with less than a high-school diploma (r=0·05) and highest for those with some college education (r=0·45). The age group with the lowest validity was older women aged 55–65 years (r=0·07). The deattenuated correlation coefficient was higher among younger women, with r=0·32 among those 35–45 years of age and r=0·32 among those 45–55 years of age. The validity for unemployed participants (r=0·25) was similar to that for employed participants (r=0·20). There were no clear patterns in deattenuated correlation coefficients observed across subgroups.
The Bland–Altman plot in Fig. 1 shows the mean difference between the two methods along with the 95 % limits of agreement. For fruit and vegetable intake, the plot illustrates limited agreement between the instruments for some individuals at higher intake levels; i.e. for some participants with high mean of levels of fruit and vegetable intake as measured by the two instruments, the differences in fruit and vegetable intake measurements are quite large, some with the 24 h dietary recall values being much larger than the BRFSS and vice versa. The variability in measurement increases with larger mean fruit and vegetable intake.
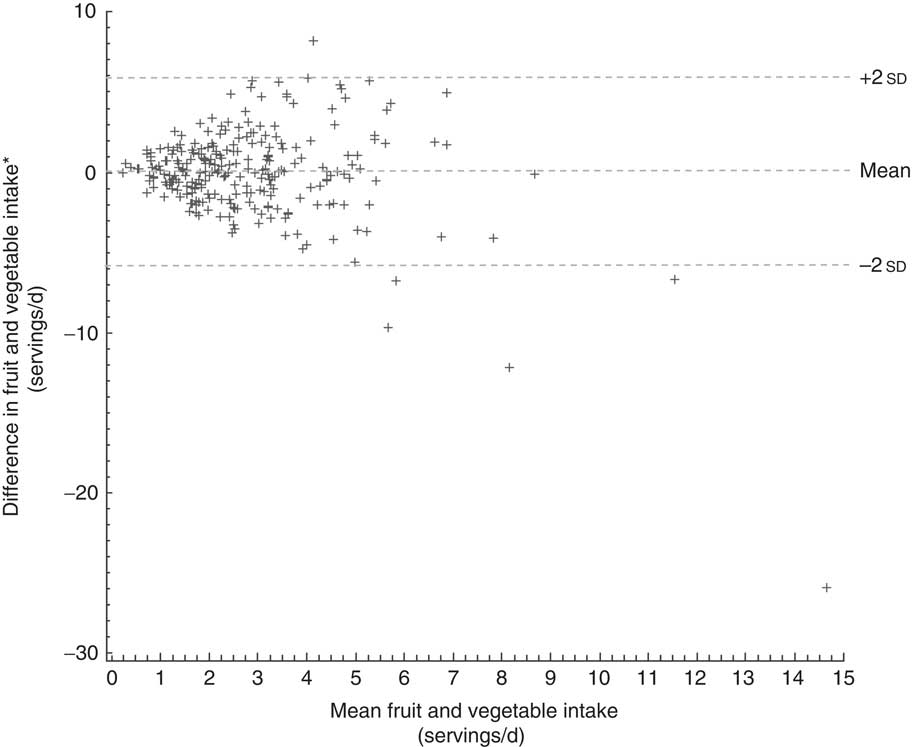
Fig. 1 Bland–Altman plot of fruit and vegetable intake as measured by 24 h dietary recalls and the BFRSS FV module, displaying the difference in fruit and vegetable intake depending on the mean of fruit and vegetable intake as measured by the two instruments for African-American women (n 260) aged 35–65 years, south-west Georgia, USA, February 2011–December 2012. *Note: difference was calculated by subtracting the 24 h recall intake from the BRFSS intake (BFRSS FV module, Behavioral Risk Factor Surveillance System’s Fruit and Vegetable Consumption Module)
Percentage of daily energy from fat
The mean percentage of energy from fat measured with the NCI fat screener was 33·04 (sd 4·27) %, ranging from 16·04 % to 44·67 % (Table 3). The 24 h dietary recall intake was on average higher by about 2·5 %. The standard deviation of the NDSR intake was much larger (sd=8·29 %) and the range extended further both at the lower (14·29 %) and upper ends (61·19 %). Looking at education, age and employment status, the NCI fat screener underestimated intake compared with the 24 h recalls in almost all subgroups: from 1·75 % (college graduates) to 3·30 % (those with less than a high-school diploma). The only exceptions were overweight women for whom the NCI fat screener overestimated fat intake by about 0·5 %. The standard deviation of fat intake measured with the NCI fat screener was moderately high in all subgroups, ranging from 3·66 % to 4·68 %.
Table 3 Mean percentage of energy from fat from two 24 h dietary recalls and the NCI fat screener, and corresponding deattenuated Pearson correlation coefficients between the two methods, among African-American women (n 260) aged 35–65 years, south-west Georgia, USA, February 2011–December 2012
NCI fat screener, National Cancer Institute’s Percentage Energy from Fat Screener; GED, General Educational Development.
*P<0·05, **P<0·01, ***P<0·001.
† Difference was calculated by subtracting the 24 h recall percentage from the NCI percentage.
The deattenuated correlation coefficient for the percentage of daily energy from fat for the overall sample was moderate at r=0·38. Validity was highest among overweight participants (r=0·65) and lowest among obese class I and II (30·0 kg/m2≤BMI<40·0 kg/m2) study participants (r=0·31). However, the deattenuated correlation coefficient among participants in the class III obesity category (BMI≥40·0 kg/m2) was higher (r=0·43) compared with that in obese class I and II. Validity decreased with an increase in education from r=0·47 for women with less than a high-school diploma to r=0·24 for college graduates. Validity was highest for the youngest group of participants, aged 35–44 years (r=0·52), and lowest for the middle group, aged 45–54 years (r=0·28). Similar to the fruit and vegetable intake, there were no clear patterns in deattenuated correlation coefficients for percentage of daily energy from fat in all subgroups.
The Bland–Altman plot in Fig. 2 shows the mean difference between the two methods along with the 95 % limits of agreement. There did not appear to be any consistent bias across levels of fat intake; i.e. for participants with low, medium or high levels of fat intake (mean between 24 h recall and NCI fat screener), the difference in measurement does not seem to vary systematically. However, the plot suggests a trend. With higher mean percentage of energy from fat, the difference between the NCI percentage and the 24 h recall percentage becomes more negative. Also, more positive outliers in differences in scores were present for low mean intake percentages and more negative outliers for high mean intake percentages.
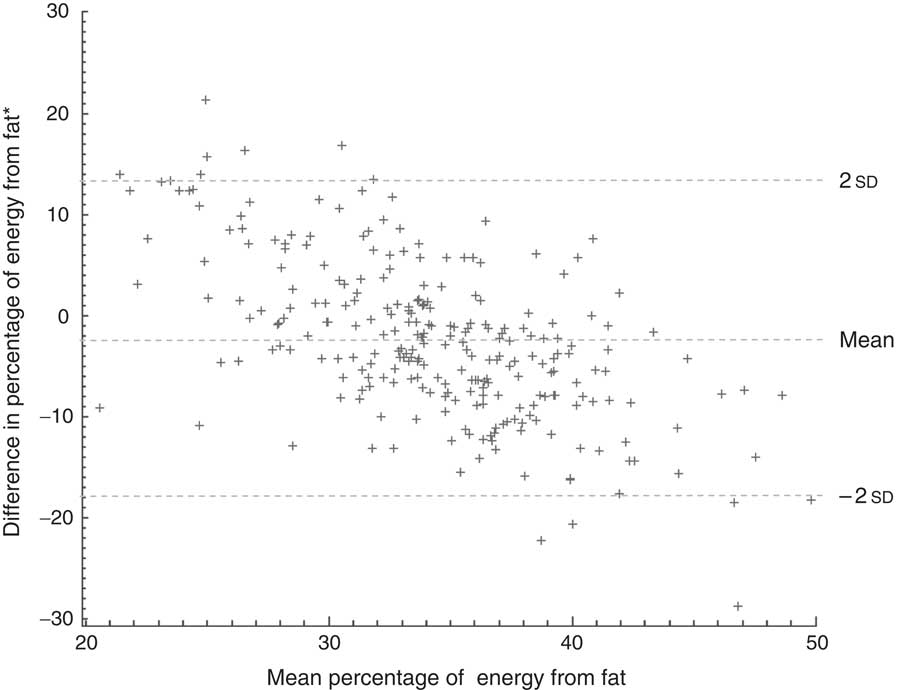
Fig. 2 Bland–Altman plot of fat intake as measured by 24 h dietary recalls and the NCI fat screener, displaying the difference in fat intake depending on the mean fat intake as measured by the two instruments for African-American women (n 260) aged 35–65 years, south-west Georgia, USA, February 2011–December 2012. *Note: difference was calculated by subtracting the 24 h recall percentage from the NCI percentage (NCI fat screener, National Cancer Institute’s Percentage Energy from Fat Screener)
Discussion
Our study of low-income overweight and obese African-American women provides valuable information about the validity of two commonly used measures to assess dietary intake. We observed relatively low overall correlations between fruit and vegetable intake measured by the BRFSS FV module and the repeated 24 h recalls. The BRFSS FV module does not include portion size information which may be one reason for the observed differences, particularly at the higher intake levels. It may be that respondents report instances of even small amounts of fruits and vegetables in the BRFSS measure and due to the lack of adjustment for portion size, actual consumption is over-reported. Our results showing that the FV module overestimated fruit and vegetable intake are consistent with previous findings including those of the original BRFSS validation study( Reference Kim and Holowaty 26 , Reference Yaroch, Tooze and Thomson 27 ). It is also possible that when responding to the BRFSS FV module respondents overestimated fruits and vegetables consumed as part of mixed dishes. The NDSR 24 h dietary recall does include actual amounts of fruits and vegetables from mixed dishes in calculating total fruit and vegetable servings, while the BRFSS estimates each instance as one portion.
In terms of determining the percentage of daily energy from fat, we observed that the NDSR 24 h dietary recall was higher than the NCI fat screener. Furthermore, the underestimation of the NCI fat screener varied by age, education and employment status. There may be a number of potential explanations for the discrepancy between fat intakes as estimated by the two methods. The NCI fat screener was developed using data from the nationally representative US 1989–91 Continuing Survey of Food Intakes by Individuals( Reference Thompson, Midthune and Subar 10 ). The instrument includes the strongest food group predictors of percentage energy from fat based on this sample. The development and the finalized instrument consider frequency of consumption but not portion sizes for the foods/food groups. It is well known that food portion sizes have increased over time. Our population may have been consuming larger portion sizes of higher-fat items than the original reference population, resulting in an underestimate of fat intake. In addition, the NCI instrument may not capture some common uses of added fat for southern US-based populations, such as animal (meat) fat used to sauté vegetables or season cooked greens, fat added to cooked grits and gravies added to biscuits and cooked meats. Some high-fat foods such as barbequed meats (e.g. ribs) and fried meats and poultry may be eaten more frequently in our population than others and are not included in the NCI fat screener. Lastly, the NDSR specifically asks about fat additions to individual foods such as breads and vegetables during the interview as these items are reported. This may result in a more complete estimate of fats added to foods with NDSR as compared with the NCI fat screener.
Other studies have compared the screening instrument for fat intake used in the present study with repeated 24 h recalls in a variety of different settings and populations; however, the sociodemographic and health characteristics of our rural southern US population are unique. In the original validation paper for the fat screener, Thompson et al. compared results from the screener with data from two telephone 24 h dietary recalls( Reference Thompson, Midthune and Subar 10 , Reference Thompson, Midthune and Williams 11 ). A sub-sample of 404 participants of both genders from the National Institutes of Health–AARP (American Association of Retired Persons) Diet and Health Study completed the screener, 24 h dietary recalls and provided demographic data. Compared with our study, the participants in that study were older (50–69 years) and more likely to be Caucasian and of higher socio-economic status. Similar to what we observed, the screener tended to estimate lower fat intakes than the 24 h recalls. Among women, the recalls estimated mean percentage of energy from fat at 31·3 % and the screener at 28·4 %. After applying a measurement error model the investigators reported correlations between the two methods of 0·64 and 0·58 for men and women, respectively. This is much higher than the correlations we observed (0·38).
In the original validation study of the BRFSS FV module by Serdula et al., the investigators compared it with 7 d food records in an Arizona population of fifty-one adults (r=0·34) and with results from a series of four 2 d diet records (eight in total; r=0·66) collected quarterly in a Wisconsin population of 169 adults( Reference Serdula, Coates and Byers 9 ). Overall their populations reported higher fruit and vegetable consumption (means of 3·9 and 4·2 daily servings) with the BRFSS module than we observed in the present study (mean 2·79). Interestingly, for the Wisconsin group, diet records found higher intakes of fruit and vegetables (mean 4·3) and for the Arizona group, diet records found lower intakes of fruits and vegetables (mean 2·4) than the respective BRFSS values. The additional days of dietary data may in part explain the more robust correlations observed in these study populations compared with our own results (r=0·22). To our knowledge there are no other published validation studies for this instrument. Investigators have, however, compared the longer NCI fruit and vegetable screener (sixteen-, seventeen- and nineteen-item versions v. six items for BRFSS) with dietary recall data and the majority of results were consistent with those presented here (i.e. screeners consistently under-reporting fruit and vegetable consumption)( Reference Thompson, Midthune and Subar 10 , Reference Yaroch, Tooze and Thomson 27 , Reference George, Thompson and Midthune 28 ).
Our study has at least three strengths. First, we compared 24 h recall data collected with the NDSR computer-directed dietary assessment and analysis program, the premiere software program for nutrition research, with data from two widely used nutrition screeners. Second, all of the interview staff involved in the research were trained to use NDSR and observed strict quality assurance procedures throughout the data collection process. Finally, trained telephone interviewers also collected the dietary screener data, thereby minimizing the possibility for respondents to misinterpret the items or skip questions. Despite the strengths of our study, a few limitations should be noted. First, all of the nutrition data were self-reported by our participants and could be subject to recall and social desirability bias. However, many of the responses confirmed low intake of fruits and vegetables overall. Low intakes of fruits and vegetables among our participants might impact the validity of the BRFSS FV module for this and similar populations because of the difficulty in reporting usual intake of foods consumed infrequently. Furthermore, the narrow range of fruit and vegetable intake could also have resulted in the relatively weak correlations. Our reference standard, the 24 h dietary recall, is not without limitations. For example, two recalls may not be sufficient to accurately estimate usual intake for some nutrients and particularly for episodically consumed foods( Reference Resnicow, Odom and Wang 5 , Reference Cade, Thompson and Burley 7 , Reference Ma, Olendzki and Pagoto 29 ). It is also possible that the 24 h recalls may be more prone to reporting biases among our study participants because of their weight status or educational attainment. We advise other researchers to give careful consideration before judging that a screener is an appropriate measure for both fruit and vegetable intake and fat intake in intervention studies of modest size. In addition, the modest sample size, especially in some of the subgroups, is a limitation.
Future research using screeners to measure fruit and vegetable consumption should attempt to quantify fruits and vegetables included in mixed dishes. Screeners that target fat intake may want to include instructions to remind research participants to include common sources of added fat intake when responding to items. Alternatively, future research could consider utilizing or modifying instruments or processes for determining fat intake obtained from vegetables, soups and gravies seasoned with fatty meat products. These fats are widely used among those in rural areas and those who are low income. Studies would need to be conducted to determine a modified or new instrument’s validity. Lastly, future studies should attempt to examine how well screening instruments capture intervention-related dietary changes or other fluctuations that occur in dietary patterns over time.
Acknowledgements
Acknowledgements: The authors wish to thank members of the Emory Prevention Research Center’s Community Advisory Board for their guidance in the design and implementation of this research. They also wish to thank the interviewers, study participants and community health centre partners for their valuable contributions to this research. Financial support: This publication was supported by Cooperative Agreement #5U48DP001909 from the Centers for Disease Control and Prevention. The findings and conclusions in this article are those of the authors and do not necessarily represent the official position of the Centers for Disease Control and Prevention. Conflict of interest: None. Authorship: I.A., R.H., J.A.G., B.G. and M.C.K. conceptualized the larger study. I.A., R.H. and T.J.H. formulated the specific research questions for the present study. I.A. managed data collection. R.H. performed the analysis. All authors wrote sections of the paper and interpreted the results. All authors reviewed and edited the full manuscript. Ethics of human subject participation: This study was reviewed and approved by the Emory University Institutional Review Board.


