


Childhood obesity is one of the most serious health concerns in the 21st century. Obesity among children is a risk factor for the development of many chronic and metabolic diseases at an early age(Reference Ogden, Carroll and Kit1,Reference Sahoo, Sahoo and Choudhury2) . Moreover, obese children suffer from psychological problems, which lead to social isolation and psychological and behavioural development disorders(Reference Sahoo, Sahoo and Choudhury2,Reference Yılmazbaş and Gökçay3) .
In addition to the changing food habits as a result of a change in the current living conditions, genetic factors, environmental factors, low physical activity, family socio-economic status and psychological factors have an impact on obesity(Reference Pandita, Sharma and Pandita4,Reference Kumar and Kelly5) . Nowadays, many children consume foods that are rich in energy content but low in nutritional value, especially food and beverages such as French fries, hamburgers, pizza, chocolate, soda and juice(Reference Varnaccia, Zeiher and Lange6,Reference Scaglioni, De Cosmi and Ciappolino7) . Additionally, factors such as eating outside of the home, having large portions, frequent snacking, inadequate consumption of vegetables and fruits, excessive eating in different emotional situations such as anxiety and stress, excessive eating due to food restriction and sensitivity to external stimuli (food smell, taste, appearance, etc.) also lead to obesity(Reference Pandita, Sharma and Pandita4,Reference Varnaccia, Zeiher and Lange6,Reference Scaglioni, De Cosmi and Ciappolino7) . Children’s eating behaviours play an important role in child obesity(Reference Freitas, Albuquerque and Silva8), especially as eating habits and tendency to eat fast foods are inculcated in early childhood(Reference Pandita, Sharma and Pandita4,Reference Freitas, Albuquerque and Silva8,Reference Abdella, El Farssi and Broom9) .
Uncontrolled eating (UE), cognitive restraint (CR) and emotional eating (EE) in children’s eating behaviours have been widely studied earlier(Reference Bryant, Thivel and Chaput10). ‘Uncontrolled Eating’ behaviour refers to the tendency to lose control over food when hunger is felt and when exposed to an external stimulus. ‘Cognitive restraint’ behaviour refers to the tendency to control food intake to maintain body weight and body shape. ‘Emotional Eating’ behaviour refers to the relationship between overeating and negative mood such as loneliness, anger, anxiety or demoralisation(Reference Freitas, Albuquerque and Silva8,Reference Bryant, Thivel and Chaput10–Reference Van Strien12) .
The explanations of uncontrolled/external, restrictive and EE behaviours give us clues about the obesity problem in individuals who have high levels of these eating behaviour traits(Reference Hirsch, Kluckner and Brandt13,Reference Muharrani, Achmad and Sudiarti14) . A previous study shows that in normal-weight people, hunger interoception is more likely to elicit an eating episode, whereas, in obese people, external cues often elicit eating episodes(Reference Bilman, van Kleef and van Trijp15). Obese people have been found to be more sensitive to taste cues compared with normal-weight and underweight people(Reference Hirsch, Kluckner and Brandt13,Reference Hardikar, Höchenberger and Villringer16) . In other words, it is assumed that obese people show low sensitivity to internal satisfaction cues but extreme sensitivity to external nutritional cues such as taste and smell. This, coupled with an excessively fast eating rate, under emotional stimulation, leads to a blunted satiety response to a meal(Reference Bilman, van Kleef and van Trijp15–Reference Van Meer, Charbonnier and Smeets17).
Studies on children and adolescents have shown that there is a strong relationship between uncontrolled/external, restrictive and EE behaviours and body composition, which increases BMI and causes weight gain(Reference Bryant, Thivel and Chaput10,Reference Kargar, Sarvestani and Tabatabaee18–Reference Demir and Bektas22) . However, other studies have shown that there is no relationship between these eating behaviours and body composition, and thus they do not affect weight gain(Reference Kargar, Sarvestani and Tabatabaee18,Reference Snoek, Engels and Van Strien19,Reference Jansen, Roza and Jaddoe23,Reference Carnell, Benson and Pryor24) . Hence, further research is needed to explain the relationship between eating behaviours of children and obesity, although research in this area has increased considerably(Reference Demir and Bektas22).
In our country, there are very few valid and reliable standard scales especially in the studies on children’s eating behaviours(Reference Bryant, Thivel and Chaput10,Reference Jauregui-Lobera, Garcıa-Cruz and Carbonero-Carreno11) . The aim of the current study is to adapt the Child Three-Factor Eating Questionnaire(Reference Bryant, Thivel and Chaput10) from English to Turkish and to assess the scale’s validity and reliability in this sample.
Methods
Study design, sample and setting
The current study was carried out as methodological, descriptive and correlational study design in order to evaluate the validity and reliability of the Turkish version of the Child Three-Factor Eating Questionnaire for primary and secondary school students.
The current study was carried out between July and August 2018 at the indoor sports hall and Olympic swimming pools. The venues were selected by a simple random sampling method from primary and secondary schools of Narlıdere Municipality that organised summer schools.
Based on the literature, the number of samples for scale development studies is insufficient if they are up to 100, medium if up to 200, good if up to 300, very good if up to 500 and excellent if up to 1000(Reference DeVellis25–Reference Seçer28). Therefore, our sample included 600 students studying in the third and fourth grades in primary school and in the fifth, sixth, seventh and eighth grades in secondary school who were attending summer school in the two institutions of Narlıdere Municipality during 2017–2018. The inclusion criteria were that participants do not have any chronic disease and do not need to control their body weight. A total of 229 students could not be included in the sample as their parents could not spare time to bring them to the venue on the data collection day. Therefore, the study sample included 371 students who voluntarily agreed to participate in the study and filled the forms completely. A pilot study was carried out with twenty students. These twenty students were not included in the main sample in order not to affect the scale results, as they may show an increased awareness about eating behaviours. The final sample of the study for analyses was thus composed of 351 students. Sampling criteria were defined as children who have the ability to read, write and understand the questions in the survey, have permission from their parents and who voluntarily agree to participate in the study. Children did not have any chronic diseases or need to control their body weight. The participation rate is 61·8 %.
Instruments
Data in the study were collected through ‘Socio-Demographic Data Collection Form’ and ‘Child Three-Factor Eating Questionnaire’(Reference Bryant, Thivel and Chaput10) between July and August 2018. The consent forms explaining the study were given to the parents to get their approval; the questionnaires were distributed to the participants.
Socio-demographic information form
The socio-demographic information form, which is to be filled by the child, consists of nine questions related to age, class, sex, economic status, body weight and height of the child, the child’s evaluation of his/her body weight and height and whether he/she has adequate and balanced nutrition.
Three-Factor Eating Questionnaire for children
Three-Factor Eating Questionnaire for Children was developed by Bryant et al.(Reference Bryant, Thivel and Chaput10) to evaluate three-factor eating behaviours of primary and secondary school students. The scale is composed of seventeen items, all of which are Likert scale type, and the answers are as follows: 1 = definitely false, 2 = mostly false, 3 = mostly true and 4 = definitely true. Item 17 in the questionnaire is in the form of a four-point Likert scale, which includes ‘only during meal times’, ‘sometimes between meals’, ‘often between meals’ and ‘almost always’. The construct validity of the scale was evaluated using exploratory, varimax rotation and principal component factor analysis. The scale shows a three-factor structure referring to UE, EE and CR. The internal consistency analysis of the scale yielded Cronbach’s α coefficient of 0·85. The Cronbach’s α values of the sub-dimensions were 0·85 (UE), 0·83 (EE) and 0·67 (CR). Also, the factor loadings of the three sub-dimensions ranged between 0·61 and 0·81. Thus, it was concluded that the scale developed is a valid and reliable measurement tool that can be used to measure three-factor eating behaviours in children. A high score from any sub-dimension of the scale indicates that the eating behaviour related to that sub-dimension is high.
Statistical analysis
For the analysis of the data, the following were used: percentile and average for descriptive statistics, Shapiro–Wilk normality test (for testing whether the data comply with normal distribution), content validity index (for compatibility analysis of expert opinions), Pearson’s correlation analysis (for item-total score analysis of scale and sub-dimensions), Cronbach’s α coefficient (to determine the internal consistency of scale and sub-dimensions), explanatory factor analysis (EFA) (to determine the substance–factor relationship), confirmatory factor analysis (CFA) (to determine whether the items and sub-dimensions explain the original structure of the scale), t test (for contrasting group comparison), Pearson’s correlation analysis (to determine the relationship between the factors of the scale), one-way ANOVA (for comparison of the mean total score of children according to BMI) and Scheffe’s test (for further analysis). The relationship between the scale and the mean score of the visual analogue scale was evaluated using Pearson’s correlation analysis(Reference Özdamar26–Reference Seçer28). The BMI of the children was evaluated according to 5–19 age group reference ranges based on the guidelines of WHO 2007. According to age and gender, BMI under the 5th percentile was evaluated as weak, between 5th and 85th percentiles as normal, between 86th and 95th percentiles as overweight and over 95th percentile as obese(29). The margin of error was P = 0·05 in the evaluation of data.
Procedure
The authors obtained permission from the scale owner to adapt the scale to Turkish. The scale was translated into Turkish separately by two English language and literature expert translators. Then, the Turkish form of the scale was created from the two translations with the joint effort of the researchers. After that, a Turkish language specialist gave his inputs on the Turkish form. Based on the feedback, only a few grammar corrections were made and the Turkish form was given its final form. The Turkish scale was back translated by an English language and literature expert. The researchers compared the original scale items with the form translated from Turkish into English. After that, the feedback was obtained from the owner of the scale regarding the similarity of two forms. Since there was no negative feedback, the scale was sent to eight specialists, including three specialist dieticians, one public health specialist, one child health specialist and three paediatric nursing professors working in this field. The experts were given the original and the translated form of the scale and were asked to give a score of 1–4 (1 = very little change required, 2 = little change required, 3 = appropriate and 4 = very convenient) to evaluate the suitability of the items of the scale. Item-based content validity index (I-CVI) and scale-based content validity index (S-CVI) were calculated for each item in the scale and in the overall scale. The experts found the Turkish and English forms appropriate, and so a decision was taken to conduct a pilot study, which was carried out with twenty students in the sample. These twenty participants were asked to evaluate the scale in terms of language and expression intelligibility. They stated that the scale was easy and understandable. Thus, no changes were made in the Turkish form, and the researchers decided to apply the scale to the main sampling. The twenty students participating in the pilot study were not included in the main sample in order not to affect the scale results, as these students may have an increased awareness about eating behaviours.
Ethics
The permission for using the Child Three-Factor Eating Questionnaire was obtained via email. Before starting the study, ethics committee approval dated 26 July 2018 with Protocol No. 4167-GOA and Decision No. 2018/19-07 was obtained from the University Ethical Committee for Non-Invasive Researches. In addition, written permission was obtained from the City Municipality (2018/3105). The researchers ensured that the purpose of the study was explained to the students and their parents; the students who accepted to participate in the study voluntarily were included in the study. Verbal consent from the student participants and written consent from their parents were obtained.
Results
In all, 25·3 % of the students (n 89) are in the third grade, 10·3% (n 36) in the fourth grade, 11·4% (n 40) in the fifth grade, 18·2% (n 64) in the sixth grade, 21·4% (n 75) in the seventh grade and 13·4% (n 47) in the eighth grade. In all, 53·6% of the participants are boys (n 188) and 46·4% are girls (n 163). Fifty-nine percentage (n 207) of the children belonged to middle-class families. Of the total participants, 57·5% evaluated their height and weight as normal. In all, 55·8% (n 196) of the children considered their nutrition to be adequate and balanced. The mean age of the children is 10·74 ± 1·79 (min–max = 8–14). According to the BMI of the children, 10·3% (n 36) of the participants are underweight, 40·5% (n 142) are normal weight, 29·6% (n 104) are overweight and 19·6% (n 69) are obese (Table 1).
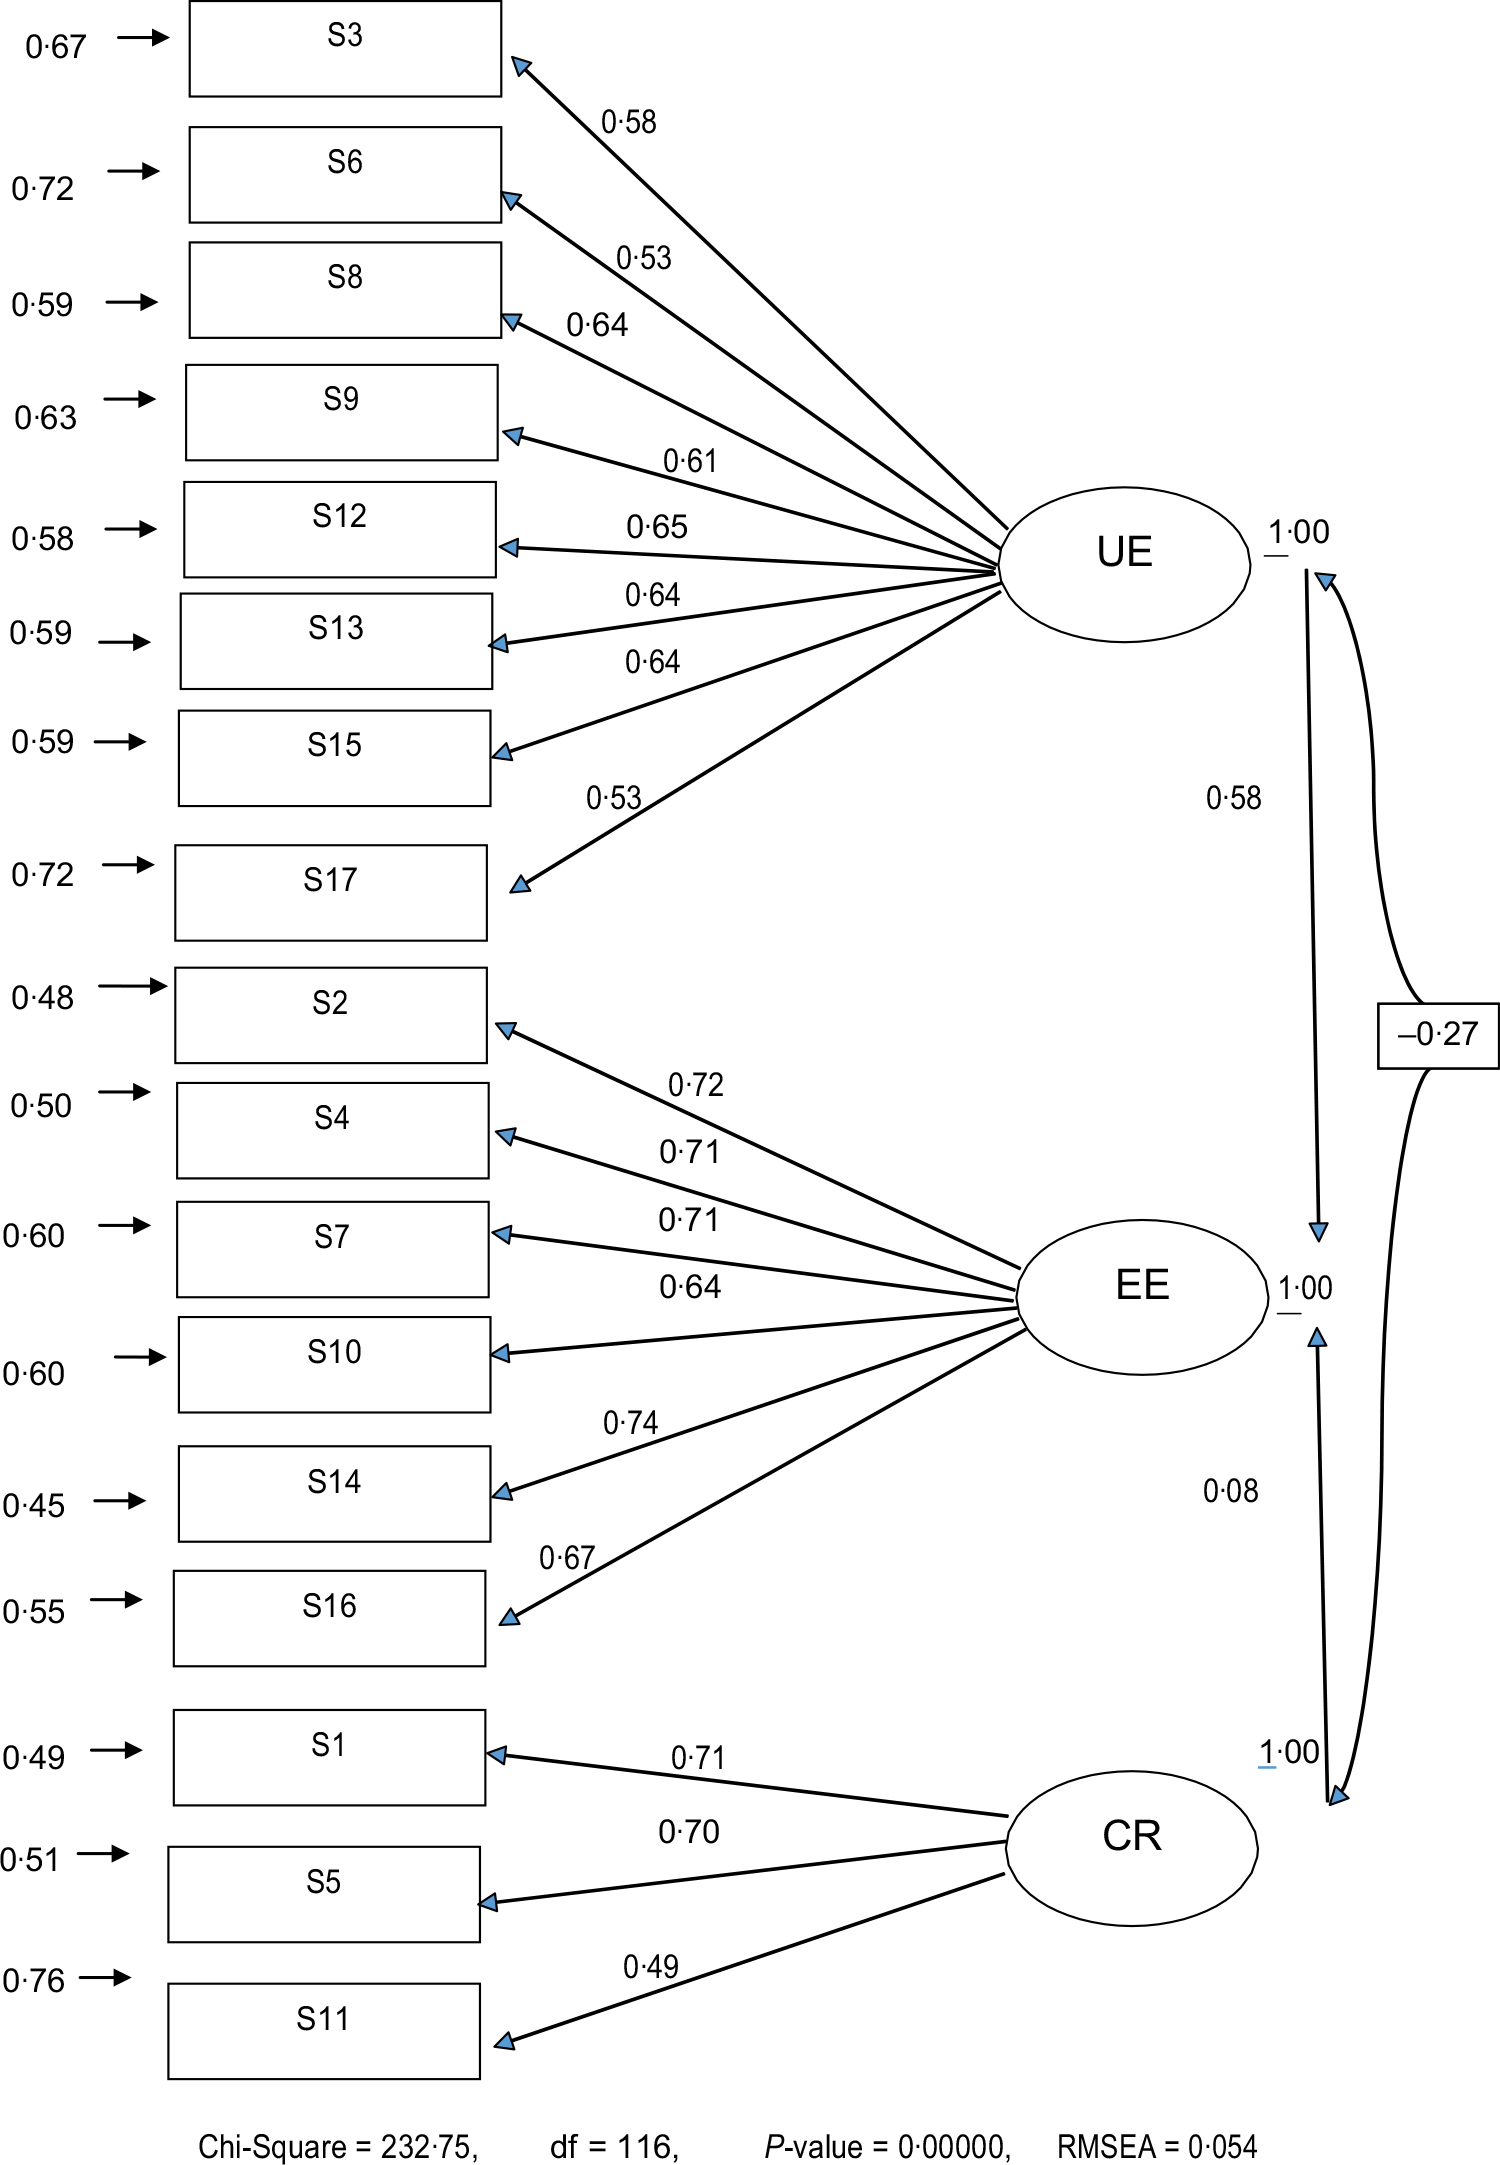
Fig. 1 Confirmatory factor analysis of the Child Eating Questionnaire. UE, uncontrolled eating; EE, Emotional eating; CR, cognitive restraint; RMSEA, root mean square error of approximation
Table 1 Socio-demographic characteristics of children

Content validity
A total of twelve expert opinions were received in the draft scale form. As a result of expert opinions, the I-CVI was found to be between 0·89 and 1·00 and the S-CVI was 0·98.
Explanatory factor analysis
As a result of the EFA, the Kaiser–Meyer–Olkin coefficient was 0·878, Bartlett’s test χ 2 value was 1896·149 and P < 0·01. It was determined that the scale consists of three sub-dimensions: the UE sub-dimension of the scale accounts for 30·84 %, the EE sub-dimension for 13·90 % and the CR sub-dimension for 8·12 % of the total variance. Thus, the three sub-dimensions account for 52·86 % of the total variance. Factor loadings of UE sub-dimension of the scale ranged between 0·53 and 0·76, of EE sub-dimension between 0·64 and 0·78 and of CR sub-dimension between 0·75 and 0·76 (Table 2).
Table 2 Results of explanatory factor analysis of Child Eating Questionnaire (n 351)

UE, uncontrolled eating; EE, Emotional eating; CR, cognitive restraint.
Confirmatory factor analysis
On the basis of the CFA results, fit indices are determined as follows: χ 2 = 232·75, df = 116, χ 2/df = 2·006, root mean square error of approximation = 0·054, goodness of fit index = 0·93, comparative fit index = 0·97, incremental fit index = 0·97, normed fit index = 0·94, Tucker–Lewis index = 0·96 and relative fit index = 0·93. On the basis of the CFA, the factor loadings of the UE sub-dimension of the scale ranged from 0·53 to 0·65, of the EE sub-dimension from 0·64 to 0·74 and of the CR sub-dimension from 0·49 to 0·71 (Tables 3 and 4, Fig. 1). The scale’s total score of the underweight children was found to be 51·97 ± 7·75, while that of normal-weight children was 51·54 ± 8·49, of overweight children was 49·69 ± 7·26 and of obese children was 47·82 ± 8·03. The difference among the scale’s total scores according to BMI of the children was statistically significant. In the post hoc analysis, it was determined that this difference resulted from the scale’s total score of the children with normal weight and those who were obese.
Table 3 Model fit indices of the Child Eating Questionnaire

RMSEA, root mean square error of approximation; GFI, goodness of fit index; CFI, comparative fit index; IFI, incremental fit index; RFI, relative fit index; NFI, normed fit index; TLI (NNFI), Tucker–Lewis index; NNFI, non-normed fit index.
Table 4 Comparison of scale total and subscale scores of children according to BMI (n 351)

The UE subscale score of the underweight children was 22·97 ± 4·71, scale’s total score of normal-weight children was 23·11 ± 5·49, of overweight children was 21·01 ± 4·94 and of obese children was 20·57 ± 5·33. The difference among the UE subscale score according to the BMI of the children was statistically significant (P = 0·001). In the post hoc analysis, it was determined that this difference resulted from the subscale score of the children with normal weight and those who were overweight and obese.
No significant statistical difference was determined between sub-dimension point averages of emotional and CR according to BMI of the children (P > 0·05).
Reliability analyses
Tukey’s test of additivity assessed the additivity of the scale and concluded that F = 1·553 and P = 0·213, which showed that the scale was collectable. Hotelling’s T-squared test was used to determine whether the scale had response bias or not and concluded that at 824·424, F = 49·318 and P < 0·01, there was no response bias in the scale. Cronbach’s α coefficient of the whole scale was 0·81, and the α values of the sub-dimensions were 0·82, 0·85 and 0·70, respectively. As a result of the split-half analysis, the Cronbach’s α value of the first half was 0·70, and that of the second half was 0·71, the Spearman–Brown coefficient was 0·82, the Guttman split-half coefficient was 0·83 and the correlation coefficient between the two halves was 0·70. No floor effect and ceiling effect was detected for the whole scale. For the UE sub-dimension, the base effect was 0·6 % and the ceiling effect was 2·3 %; for the EE sub-dimension, the baseline effect was 0·3 % and the ceiling effect was 24·2 %; and for the CR sub-dimension, the floor effect was 3·4 % and the ceiling effect was 10·0 % (Tables 5 and 6).
Table 5 Results of the reliability analyses of the scale and sub-dimensions (n 351)

Table 6 Correlations of the item-total score and the sub-dimension total score (n 351)

* P < 0 001.
The correlations of the scale items with the scale total score ranged between 0·25 and 0·65, the correlation between the first sub-dimension items and the sub-dimension total score ranged between 0·60 and 0·72, the correlation between the second sub-dimension items and the sub-dimension total score ranged between 0·73 and 0·79 and the correlation between the third sub-dimension items and the sub-dimension total score ranged between 0·72 and 0·80.
Discussion
The content validity of the scale was evaluated by twelve experts, and I-CVI and S-CVI were used to evaluate the expert opinions. Both I-CVI and S-CVI should be above 0·80 to that there is an agreement between the expert opinions(Reference DeVellis25,Reference Jonhson and Christensen30) . Both I-CVI and S-CVI levels were found to be above 0·80. In the current study, the results of I-CVI and S-CVI showed that there was an agreement between the experts, the scale measured the subject adequately and the content validity was ensured.
The data were evaluated using Bartlett’s sphericity test and Kaiser–Meyer–Olkin to determine whether the data were appropriate and sufficient for factor analysis. In the literature, it is emphasised that Bartlett’s sphericity test value should be statistically significant, and that Kaiser–Meyer–Olkin value should be at least 0·60(Reference DeVellis25,Reference Jonhson and Christensen30) . In the current study, the value of Bartlett’s sphericity test was P < 0·05, and the Kaiser–Meyer–Olkin value was >0·60. It was determined that the database and the sample size were suitable for factor analysis of the current study(Reference DeVellis25,Reference Kartal and Bardakçı27,Reference Karagöz31) . On examining the original studies of Bryant et al.(Reference Bryant, Thivel and Chaput10) who developed the Child Three-Factor Eating Questionnaire, and of Martín-García et al.(Reference Martín-García, Vila-Maldonado and Rodríguez-Gómez21) who developed the Spanish version of the Three-Factor Eating Questionnaire for children and adolescents, it was found that the sample size and data sets are similar to those of our study. The eigenvalue is 1 and above in determining the number of factors in the EFA(Reference Özdamar26,Reference Seçer28) , and it is determined that the scale consists of three sub-dimensions. In the current study, the three-factor scale explained 52·88 % of the total variance. In the study of Bryant et al.(Reference Bryant, Thivel and Chaput10), the scale explained 53·5 % of the total variance, while in the study of Martín-García et al.(Reference Martín-García, Vila-Maldonado and Rodríguez-Gómez21), the scale explained 34·44 % of the total variance. The literature emphasises that the variance explained should be between 40 and 60 %, and that the higher the total variance, the stronger the validity of the scale is(Reference Kartal and Bardakçı27,Reference Jonhson and Christensen30,Reference Karagöz31) . It was determined that the total variance obtained in the current study was over 60 %, and therefore the scale had a very high explained variance. This result shows that the scale has a very strong factor structure and supports the construct validity of the scale.
As a result of the EFA, the factor loadings of the three sub-dimensions ranged between 0·53 and 0·78. The literature emphasises that the minimum factor loading should be 0·30 and above in determining the factor in which the items will fall into, and that the items under 0·30 should be excluded from the scale(Reference DeVellis25,Reference Kartal and Bardakçı27,Reference Seçer28,Reference Jonhson and Christensen30) . In the current study, the factor loadings of all the sub-dimensions were >0·30. Bryant et al.(Reference Bryant, Thivel and Chaput10) detected in their study that the factor loadings of the substances in the three subscales ranged from 0·61 to 0·81, while Martín-García et al.(Reference Martín-García, Vila-Maldonado and Rodríguez-Gómez21) determined in their study that the factor loadings of the substances in the three subscales ranged from 0·41 to 0·76. These studies have characteristics similar to our study, and the results show that the scale has a strong factor structure.
The literature recommends examining the structure determined by EFA with CFA(Reference DeVellis25,Reference Kartal and Bardakçı27,Reference Karagöz31) . Because of the CFA in the current study, the factor loads of the three sub-dimensions varied between 0·49 and 0·74. In all sub-dimensions, the factor loadings were 0·30, the fit indexes (goodness of fit index, normed fit index, comparative fit index and incremental fit index) were >0·90 and root mean square error of approximation was <0·08. The division of χ 2 value by the df was <5. There was a strong and significant relationship between the scale and the sub-dimensions. Based on the literature, if the division of >0·85, χ 2/df of the model fit indicators is <5 and root mean square error of approximation < 0·08, it is considered as a good fit indicator(Reference Özdamar26,Reference Jonhson and Christensen30,Reference Karagöz31) . The CFA results were consistent with the criteria specified in the literature. Both in the study of Bryant et al.(Reference Bryant, Thivel and Chaput10) from which the original scale was used and in the study of Martín-García et al.(Reference Martín-García, Vila-Maldonado and Rodríguez-Gómez21), the results could not be compared since the analysis of CFA could not be carried out, and so only the literature has been discussed. The CFA results showed that the data were compatible with the model, confirmed the three-factor structure, showed that the sub-dimensions were correlated with the scale and showed that the items in each subscale defined their factor as adequate. Supporting the construct validity of the scale, the results of the EFA and CFA in the current study suggest that the scale is a valid tool.
In the study, the Cronbach’s α coefficient indicates whether the items measure the same property and whether the items are relevant to the subject to be measured. This value should be as close to 1 as possible. If this value is between 0·60 and 0·80, the scale is quite reliable, and if it is between 0·80 and 1·00, the scale is highly reliable(Reference Kartal and Bardakçı27,Reference Seçer28,Reference Karagöz31) . The results showed that the Cronbach’s α values of the scale were >0·70, and the Cronbach’s α values of the scale and its sub-dimensions had a high degree of reliability. The values obtained from the study showed that the items were able to measure the desired subject adequately, the items were related to the subject and the scale had a quite good level of reliability(Reference Özdamar26–Reference Seçer28,Reference Jonhson and Christensen30) . It was found out that in the studies of Bryant et al.(Reference Bryant, Thivel and Chaput10) and Martín-García et al.(Reference Martín-García, Vila-Maldonado and Rodríguez-Gómez21), the total Cronbach’s α values of the scale were >0·70 and had characteristics similar to our study. This shows that the scale is similar to its original structure and has a strong internal consistency.
In the method of split-half analysis used in the current study, Cronbach’s α values of both divisions were above 0·70 and there was a strong and significant relationship between the two halves; in addition, both Spearman–Brown and Guttman split-half coefficients were above 0·80. These results demonstrate that the scale has a high level of reliability(Reference Özdamar26,Reference Kartal and Bardakçı27,Reference Jonhson and Christensen30) . Despite the internal validity of the scale being high, the results of the current study cannot be compared with the original study and its Spanish version, since these two studies did not have the analysis of division into two halves.
The item-total score analysis explains the relationship between the points taken from the scale items and the points taken from the total score. This is an indicator of whether the items in the scale measure the desired quality(Reference Özdamar26,Reference Kartal and Bardakçı27,Reference Jonhson and Christensen30,Reference Karagöz31) . This value should be >0·20, as close to 1 as possible and should be positive(Reference Özdamar26). In the current study, the correlation of the items with the total score of the scale was found to be between 0·25 and 0·65, and the correlations of the items with the subscale total score ranged between 0·60 and 0·80.The correlation coefficients of both item-total score and item-subscale total score were both positive and >0·20. According to these results, all the items of the scale showed a high level of correlation with its total score and the total score of its sub-dimension; thus, it measures the desired quality adequately, and the item reliability of the scale and the sub-dimensions is high. The item-total score analysis of the scale and the sub-dimensions in the studies of Bryant et al.(Reference Bryant, Thivel and Chaput10) and Martín-García et al.(Reference Martín-García, Vila-Maldonado and Rodríguez-Gómez21) was similar to that of our study. Thus, this proves that our study has a high level of internal consistency.
One of the recommended methods for the reliability and validity of scales in literature is the contrasting group comparison(Reference DeVellis25–Reference Kartal and Bardakçı27,Reference Karagöz31) , and so we used BMI values of children for contrasting group comparison. There was a statistically significant difference between the means of total scores of the children based on their BMI levels (P < 0·05). On analysing further, it was found that the scale score of obese children was significantly different from the scores of the children with normal BMI. These results show that the scale has a good ability to distinguish that it can measure the desired area adequately and that it can distinguish between contrasting groups. Hence, the scale we used is a reliable and valid measurement tool. In addition, based on the literature, there is a significant relationship between the eating habits of children and obesity risk, and there is an increase in BMI of children whose negative eating habits increase. Thus, the eating habits of children are directly related to weight gain(Reference Kargar, Sarvestani and Tabatabaee18,Reference Demir and Bektas22) . In the current study, an increase in the BMI of children whose negative eating habits increase complies with the literature and literature compliance with the current study constitutes evidence for the construct validity of the scale.
Although there is a difference in average scores of UE sub-dimension of the scale in accordance with the BMI of the children in the current study (P < 0·01), there was no statistical difference between the sub-dimension of average scores for EE and CR (P > 0·05). In the literature, while in some studies, a relationship is found between UE and BMI, some other studies show that UE does not have an impact on the BMI(Reference Bryant, Thivel and Chaput10,Reference Snoek, Engels and Van Strien19,Reference Martín-García, Vila-Maldonado and Rodríguez-Gómez21) . Furthermore, some studies indicate that both EE and CR are connected with the BMI; others emphasise that it does not have an impact on the BMI(Reference Bryant, Thivel and Chaput10,Reference Snoek, Engels and Van Strien19,Reference Martín-García, Vila-Maldonado and Rodríguez-Gómez21) . These study results comply with the literature and thus support the structure validity of the scale.
Despite many strengths, there are some limitations in the study. The first is the use of a convenience sample method, which may affect the generalisability of the study. The second limitation is the exclusion of children with a clinical diagnosis of obesity. The third limitation is that the BMI of children was calculated according to his/her self-reported weight and height. In future studies, it is recommended that the height and weight of the children be measured by the researchers.
Conclusion
As a result of the analyses, the Child Three-Factor Eating Questionnaire for primary and secondary school students was found to be a valid and reliable measurement tool for the Turkish sample. The Three-Factor Eating Questionnaire enables predetermining cases of obesity or cases of underweight in children who have recently shown a dramatic change in weight and also allows the necessary follow-up before the changes occur, thereby preventing the occurrence. This scale will provide important information in both defining the eating behaviours of obesity cases and determining the eating behaviours of underweight cases. The authors believe that this measurement tool will provide a theoretical and experimental solid ground for future studies on obesity. The authors recommend using this scale to conduct future studies in which children’s eating attitudes are evaluated according to their BMI levels. The authors also recommend that experimental studies are conducted by determining the factors affecting eating attitudes and evaluating the results of the scale. In addition, studies in the future should examine children’s eating behaviours in different cultures by using the scale. Also, it is recommended to use the scale in evaluating the eating attitudes of children who are diagnosed with clinical obesity and children who are not diagnosed.
Acknowledgements
Acknowledgements: The cooperation of the teacher and students is gratefully acknowledged. Financial support: The authors received no financial support for the research and/or authorship of the current article. Conflict of interests: The authors declare that they have no conflicts of interests. Authorship: D.D., M.B., S.D., İ.B. and E.J.B. conceptualised and designed the study, acquired, analysed and interpreted the data and drafted the manuscript. D.D., M.B., S.D., İ.B. and E.J.B. designed the study, search literature and revised the manuscript. All authors read and approved the final manuscript. Ethics of human subject participation: The current study was conducted according to the guidelines laid down in the Declaration of Helsinki, and all procedures involving research study participants were approved by the University ethics committee. Written informed consent was obtained from all participants. The permission from the persons who developed the Child Three-Factor Eating Questionnaire has been obtained via email. Before starting the study, ethics committee approval dated 26 July 2018 with Protocol No. 4167-GOA and Decision No. 2018/19-07 was obtained from the University Ethical Committee for Non-Invasive Researches. In addition, written permission was obtained from the City Municipality (IRB: 2018/3105).


