


Fermented foods constitute a significant component of the Korean diet. These traditional foods may contribute positive health outcomes, as they have been reported to play a role in the prevention of cancer, obesity, diabetes and constipation(Reference Chilton, Burton and Reid1). During fermentation enzymes are created from micro-organisms such as fungi or bacteria; these enzymes have potential health benefits as they can dissolve blood clots and improve blood circulation in the human body(Reference Shin and Jeong2). In contrast, fermented foods also contribute substantial amounts of Na to the diet from salt added during processing and preparation. Also, in the fermentation process for soya, the development of high levels of nitrate or nitrite and the loss of substantial nutrients could increase the risk of gastric cancer(Reference Kim, Kang and Lee3).
High intake of Na is known to promote or exacerbate hypertension(Reference Du, Neiman and Batis4), a disease that is prevalent in both Korea and the USA. Hypertension is a well-known risk factor for CHD, stroke and kidney disease; and the onset of hypertension increases dramatically with age(Reference Karppanen and Mervaala5). The prevalence for Korean adults has increased from 32·4 % in men in 1998 to 35·0 % in 2016. In women, it has declined from 26·8 to 22·9 % over the same time period(6). In comparison, the prevalence of hypertension in the USA has increased slightly in men aged ≥18 years (28·7 to 30·2 % from 1999–2000 to 2015–2016); in women, it has declined slightly, 28·3 to 27·7 %(Reference Ong, Cheung and Man7,Reference Fryar, Ostchega and Hales8) . However, hypertension was not related to consumption of kimchi, the most popular fermented food in Korea, according to an analysis of the 2007–2012 Korea National Health and Nutrition Examination Surveys (KNHANES)(Reference Song and Lee9). One plausible reason may be that kimchi is rich in K, as well as Na, such that high ingestion of K may counteract effects of excess dietary Na(Reference Song and Lee9). Additionally, Koreans consume a number of other fermented foods that also may influence health. The goal of the present research was to assess fermented food consumption and Na intake among Korean adults using 1998–2016 KNHANES data and to discern changes over time.
Methods
Study design
The present research is a secondary analysis of the data from KNHANES, conducted by the Korea Centers for Disease Control and Prevention (KCDC)(10). KNHANES is a cross-sectional survey to evaluate the health and nutritional status of the Korean population using a stratified and multistage sampling design. The three components of KNHANES are a health examination, a health interview and a nutrition survey. KNHANES was established in 1998; the 2016 KNHANES data are the most recent open-source data available and were released in January 2018. Initially, the surveys were conducted triennially for 1998, 2001 and 2005; in November and December of 1998 and 2001, and April–June in 2005. However, the system was transformed to collect the surveys annually throughout the year starting in 2007 in order to deliver the information in a timely manner. Yet, the data for 3 years are considered a set due to the fact that the sample size per year became smaller from 2007 than the triennial data for 1998, 2001 and 2005. Thus, the present research utilized a KNHANES data set from 1998 to 2016, divided into seven categories based on a suggestion by the KCDC. The data sets used were: 1998 (KNHANES I), 2001 (KNHANES II), 2005 (KNHANES III), 2007–2009 (KNHANES IV), 2010–2012 (KNHANES V), 2013–2015 (KNHANES VI) and 2016 (KNHANES VII). The survey protocol was approved by the KCDC Institutional Review Board and written informed consent was provided by the participants.
Participants
Participants in KNHANES were Korean citizens, aged ≥1 year, residing in representative households who were selected using a stratified and multistage clustered probability sampling method. The response rates of the selected population ranged from 70·2 to 86·5 % in each survey. The present research focused solely on Korean adults, aged 19 years or older, who participated in the 24 h dietary recall from the 1998–2016 KNHANES. It sampled a total number of 76 199 participants, 32 324 men and 43 875 women. These included 7501 in 1998 (KNHANES I), 7092 in 2001 (KNHANES II), 6526 in 2005 (KNHANES III), 16 187 in 2007–2009 (KNHANES IV), 17 394 in 2010–2012 (KNHANES V), 16 069 in 2013–2015 (KNHANES VI) and 5430 in 2016 (KNHANES VII). The adult population was divided into four age groups: 19–29 years, 30–49 years, 50–64 years and ≥65 years, based on the criteria from the 2015 Dietary Reference Intakes for Koreans(11).
Dietary intake assessment
The present research analysed 24 h dietary recall data from 1998 to 2016 KNHANES in order to identify the daily amount of food consumption, with respect to nutrient intake. As part of the overall survey and face-to-face interview process, a trained dietitian visited the homes of participants to conduct the nutrition survey. The 24 h dietary recall provided information on types, quantities, volumes and weight of foods that were consumed within the previous 24 h. Each type of ingredient, the amount of each ingredient, cooking method and total amount of food after being cooked were assessed by the person who prepared the food. Then, this information was applied to each household member for type and amount of each food consumed. Seasonings or processed foods utilized during preparation were measured, differentiated by brand name. The volume of food was determined by the size of bowl/dishes used and changed to weight using the database for volume–weight conversion(12). The open-source data were analysed to examine the consumption of fermented foods and their Na content. Fermented foods were divided into six categories: (i) kimchi; (ii) fermented red pepper paste; (iii) fermented soyabean paste; (iv) soya sauce; (v) salt-fermented seafood; and (vi) pickled vegetables. In Korea, fermented red pepper paste, fermented soyabean paste, salt-fermented seafood and pickled vegetables are known as gochujang, doenjang, jeotgal and jangajji, respectively. The total fermented foods indicated the sum of the six categories. The amount of each fermented food item and its Na content were calculated based on the food composition tables by the Rural Development Administration: 5th edition(13) for 1998 (KNHANES I), 6th edition(14) for 2001 (KNHANES II) and 2005 (KNHANES III), 7th edition(15) for 2007–2009 (KNHANES IV) and 2010–2012 (KNHANES V), and 8th edition(16) for 2013–2015 (KNHANES VI) and 2016 (KNHANES VII).
Statistical analysis
All analyses were completed with the statistical software package SAS version 9.4 using the PROC SURVEY procedure. Multivariate linear regression and logistic regression were conducted to calculate P for trend with applying strata, cluster and sampling weights. Age was adjusted as a confounding factor. Complex sample design, non-response rate of the target population and post-stratification were considered in order to create sampling weights. Multivariate linear regression was applied for continuous variables and multivariate logistic regression for categorical variables. Data for continuous variables were denoted as means with their standard errors; for categorical variables, as percentages with their standard errors. Age was standardized based on the 2005 Korea census for all analyses, except for mean age and percentages of each age group. A two-sided P for trend of ≤0·05 was considered to denote statistical significance.
Results
Characteristics of participants
The mean age of participants increased over time from 1998 to 2016. There was a decline in the percentage of individuals from the 19–29 years and 30–49 years age groups, with an escalation in individuals from 50–64- and ≥65-year-old groups in both men and women (Table 1). In addition, the percentage of individuals who completed middle school or lower in education level diminished, and individuals who completed college or higher rose in both men and women over time. Household monthly income level increased significantly over time.
Table 1 Characteristics of participants, aged ≥19 years, from the 1998 to 2016 Korea National Health and Nutrition Examination Surveys (KNHANES)
KRW, Korean won (approximately 1120 KRW equal to 1 US dollar).
* P for trend by multivariate linear regression or logistic regression.
† Age-standardized based on the 2005 Korea census.
‡ Household monthly income with age standardized.
Trends in fermented food intake
Trends in age-standardized fermented food intake from the 1998 to the 2016 KNHANES are shown in Table 2. Noticeable changes in fermented food consumption occurred. Overall, the mean total fermented food intake declined significantly over time. The highest ingestion reported was 207·0 and 169·1 g in 2001, and the lowest amount observed was 155·4 and 105·5 g in 2016, in men (P < 0·0001) and women (P < 0·0001), respectively. Similarly, the mean kimchi consumption also diminished over time; with a peak of 168·4 and 139·2 g in 2001 and the lowest amount of 118·4 and 79·8 g recorded in 2016 in men (P < 0·0001) and women (P < 0·0001), respectively. Both men and women in the 19–29-year-old group consumed the least amount of total fermented foods and kimchi in the four age groups (Figs 1 and 2). In contrast, the trend for fermented red pepper paste intake increased from 1998 to 2016; however, no trend was found from 2007–2009 to 2016 in men (P = 0·3958) and women (P = 0·1778). On the other hand, the mean fermented soyabean paste intake decreased over time in both men and women. There was a significant decline for soya sauce consumption in women only; the trend was consistent from 2007–2009 to 2016 (P = 0·7900). No tendency was observed in men over time (P = 0·4554). The mean intake of salt-fermented seafood decreased consistently over time in men and women. The trend in pickled vegetable intake elevated persistently over time from 1998 to 2016. However, this represented only approximately 3·0 to 9·0 % of the overall fermented food intake. Participants in the 19–29-year-old category consumed the highest amount of pickled vegetables, according to age group (Fig. 3). Pickled yellow radish (danmuji in Korea) was the most popular of the pickled vegetables (highest of 6·0 g in 2016 for men and 4·3 g in 2001 for women).
Table 2 Trends in age-standardized fermented food intake for Korean adults, aged ≥19 years, from the 1998 to 2016 Korea National Health and Nutrition Examination Surveys (KNHANES)
* P for trend by multivariate linear regression, adjusting for age.
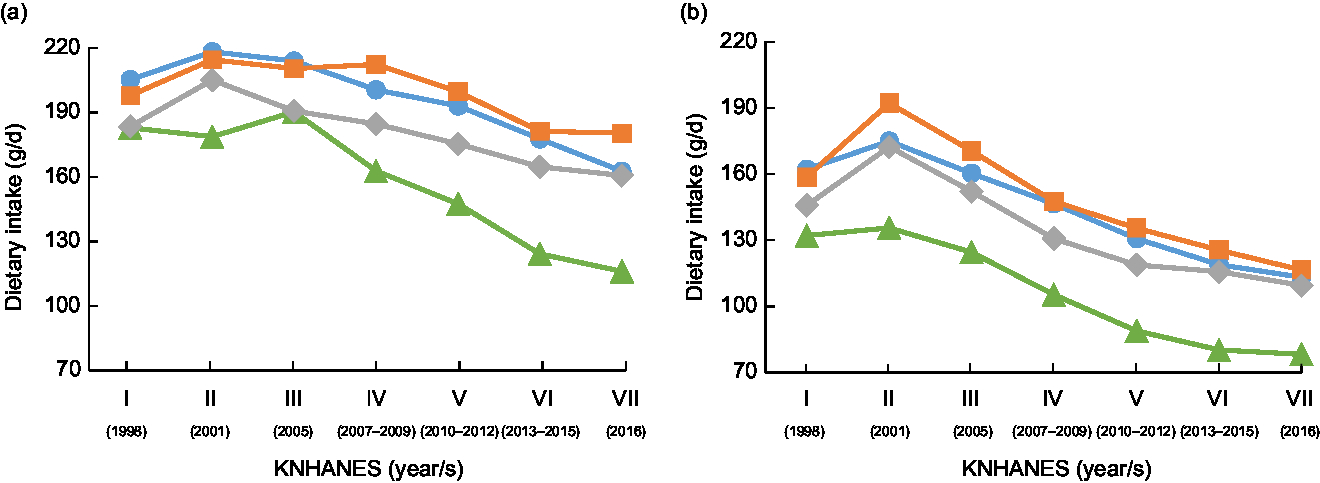
Fig. 1 Trends in total fermented food intake of Korean adults by sex (a, men; b, women) and age category (![]() , 19–29 years;
, 19–29 years; ![]() , 30–49 years;
, 30–49 years; ![]() , 50–64 years;
, 50–64 years; ![]() , ≥65 years) from 1998 to 2016, Korea National Health and Nutrition Examination Survey (KNHANES)
, ≥65 years) from 1998 to 2016, Korea National Health and Nutrition Examination Survey (KNHANES)
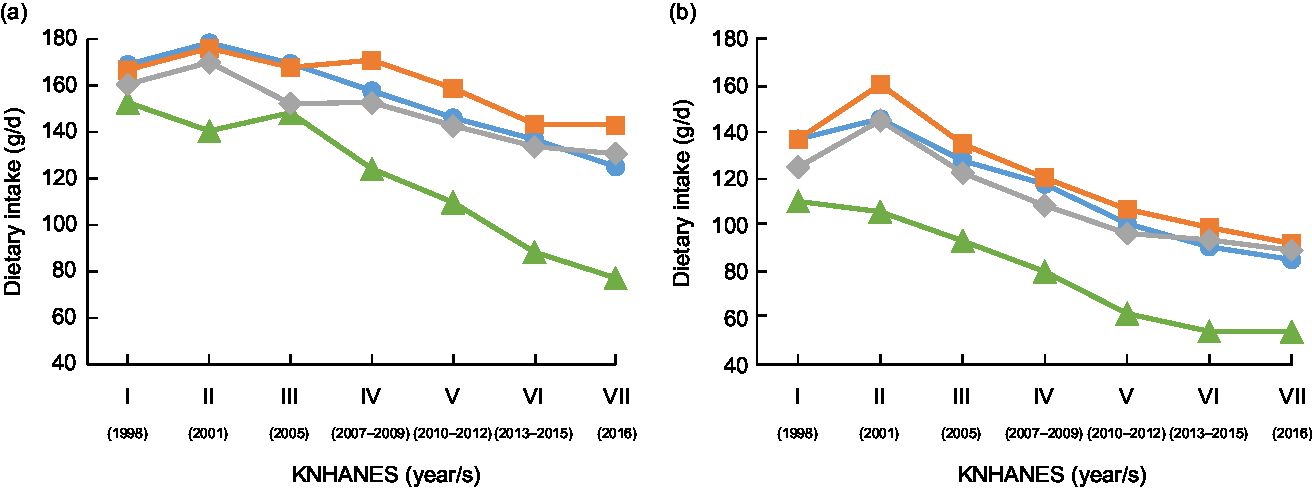
Fig. 2 Trends in kimchi intake of Korean adults by sex (a, men; b, women) and age category (![]() , 19–29 years;
, 19–29 years; ![]() , 30–49 years;
, 30–49 years; ![]() , 50–64 years;
, 50–64 years; ![]() , ≥65 years) from 1998 to 2016, Korea National Health and Nutrition Examination Survey (KNHANES)
, ≥65 years) from 1998 to 2016, Korea National Health and Nutrition Examination Survey (KNHANES)
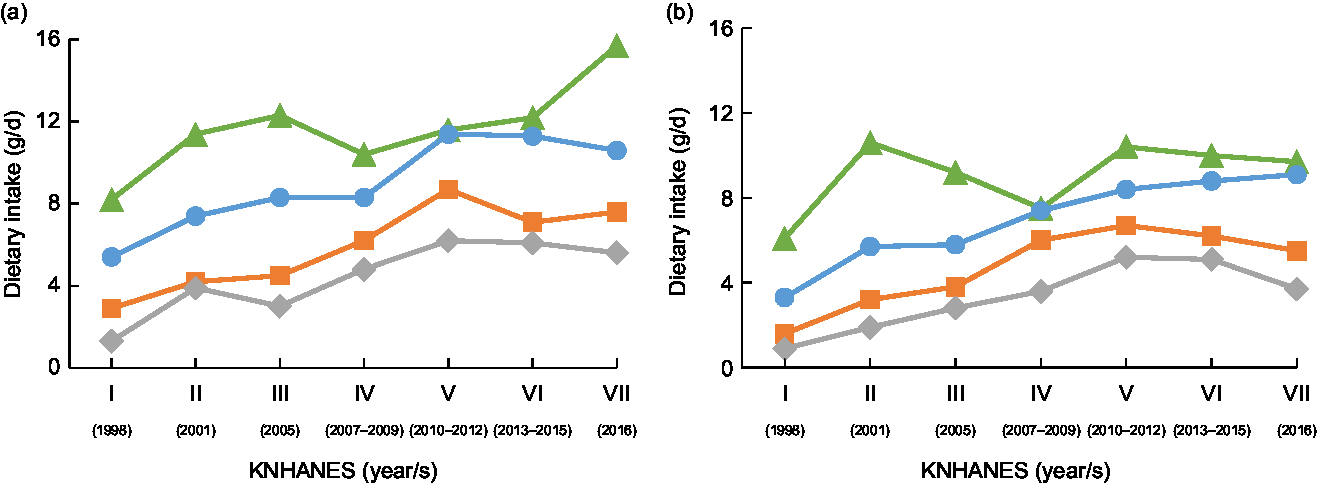
Fig. 3 Trends in pickled vegetable intake of Korean adults by sex (a, men; b, women) and age category (![]() , 19–29 years;
, 19–29 years; ![]() , 30–49 years;
, 30–49 years; ![]() , 50–64 years;
, 50–64 years; ![]() , ≥65 years) from 1998 to 2016, Korea National Health and Nutrition Examination Survey (KNHANES)
, ≥65 years) from 1998 to 2016, Korea National Health and Nutrition Examination Survey (KNHANES)
Trends in sodium consumption from fermented food intake
Trends in age-standardized Na consumption from fermented food intake are listed in Table 3 and trends in percentage of Na consumption from fermented foods to total daily Na intake are described in Table 4. First, the trend for the mean daily intake of total Na reduced significantly overall, but also fluctuated with a peak of 6400·6 and 4971·2 mg in 2005, and was the lowest in 2016 at 4704·8 and 3171·6 mg, for men (P < 0·0001) and women (P < 0·0001), respectively. The Na intake from total fermented foods diminished dramatically over time, ranging from 3264·0 mg in 1998 to 1975·0 mg in 2016 for men (P < 0·0001) and from 2572·9 to 1351·8 mg for women (P < 0·0001). The contribution of Na intake from total fermented foods to total daily Na intake declined from 58·8 to 45·4 % in men (P < 0·0001) and from 59·4 to 47·0 % in women (P < 0·0001). More specifically, the mean Na intakes from kimchi, fermented soyabean paste and salt-fermented seafood, respectively, decreased significantly over time in both men and women. Na intake from kimchi decreased by approximately 63·3 % in men and 69·4 % in women. Na intake from kimchi as part of total daily Na consumption declined from 35·7 to 17·8 % in men (P < 0·0001) and from 36·3 to 18·2 % in women (P < 0·0001). In contrast, the mean Na intake from fermented red pepper paste fluctuated, but increased overall. Similarly, an escalating trend was found in the mean Na intake from pickled vegetables. The mean Na intake from soya sauce fluctuated, but decreased overall in women; however, there was no trend from 2007–2009 to 2016 (P = 0·1582). Unlike women, no change was observed in Na consumption from soya sauce overall in men (P = 0·3754). Yet, a consistent decrease was observed from 2007–2009 to 2016 (P = 0·0009).
Table 3 Trends in age-standardized sodium consumption from fermented food intake for Korean adults, aged ≥19 years, from the 1998 to 2016 Korea National Health and Nutrition Examination Surveys (KNHANES)

* P for trend by multivariate linear regression, adjusting for age.
Table 4 Trend in percentage contribution of sodium intake from fermented foods to total daily sodium intake for Korean adults, aged ≥19 years, from the 1998 to 2016 Korea National Health and Nutrition Examination Surveys (KNHANES)

* P for trend by multivariate logistic regression.
Discussion
These results show that trends in fermented food consumption, particularly kimchi, declined noticeably over time in both men and women, based on the KNHANES from 1998 to 2016.
The trends in total fermented food and kimchi consumption in each age category were similar (Figs 1 and 2), since kimchi contributes the highest percentage to fermented foods consumed in Korea. Estimated energy requirements are highest in Korean young adults (aged 19–29 years); specifically, 10 878 kJ/d (2600 kcal/d) for men and 8786 kJ/d (2100 kcal/d) for women(11). However, adults in this age group consumed the least amount of total fermented foods and kimchi, and the trend decreased significantly.
A study by Yon et al. found that kimchi intake was responsible for the highest contribution to Na consumption, 24·5 % of total daily Na intake, based on the 2008 and 2009 KNHANES(Reference Yon, Lee and Kim17). In our research, the trend analysis from 1998 to 2016 showed that Na intake from total fermented foods and kimchi consumption declined significantly over time.
In contrast, pickled vegetable consumption and Na intake from pickled vegetables increased over time. Specifically, consumption of pickled vegetables was highest in young adults aged 19–29 years (8·2 to 15·7 g in men and 6·1 to 9·7 g in women), and lowest in the elderly aged ≥65 years (1·3 to 5·6 g in men and 0·9 to 3·7 g in women). It appears that young adults, especially those aged 19–29 years, prefer to consume pickled vegetables instead of kimchi. In contrast, the elderly seem to prefer the traditional kimchi.
In Korea, fermented red pepper paste, fermented soyabean paste and soya sauce are usually consumed as a condiment or sauce, or added to soups or stews. Intake of fermented red pepper paste increased significantly over time (by approximately 47·1 % in men and 39·4 % in women); however, fermented soyabean paste intake diminished greatly (by approximately 13·1 % in men and 18·8 % in women). One reason might be that spicy foods have been gaining in popularity and food companies have increased development of different types of spicy foods that have been a great success in Korea, and globally as well. Fermented red pepper paste may be utilized as a condiment for foods or as an addition to soups or stews, rather than the traditional fermented soyabean paste.
Yet, no dramatic changes were observed in the trends for soya sauce intake and Na consumption from soya sauce over time. Soya sauce has been a consistent part of the Korean diet as it is incorporated in a wide variety of foods and recipes. However, Na intake from soya sauce from 2007–2009 to 2016 decreased significantly in men, by approximately 10 %.
A plausible reason for decreases in fermented food intakes over time could be related to changes in overall dietary patterns in Korea. From the 1970s, dramatic economic and sociodemographic changes have occurred(Reference Kim, Moon and Popkin18). For example, the household monthly income in Korea has increased significantly, more than three times from 1998 to 2016 (Table 1). With greater exposure to the world, the diet in Korea has shifted to becoming more Westernized, particularly with convenience foods. An example for grains is ramen: it contributed the highest percentage of Na consumption, 33·1–56·6 % in men and 25·1–42·3 % in women from 1998 to 2010(Reference Song, Park and Shim19). This changing pattern of foods also could be associated with increased dining out, as well as advancing age, income and educational level(Reference Kang, Hong and Choi20). Those who ate outside the home ≥1 times per day were 44·3 % among men and 23·2 % among women in 2016, and even higher in the younger age group of 19–29 years (51·1 % in men and 34·1 % in women)(6). Other reasons might be changing taste preferences with exposure to international foods, and a lack of time or desire for greater convenience(Reference Park21). Young adults may have developed their food choices and habits from early childhood, as the traditional Korean diet has declined with greater intake of Western-style foods. These foods include flour products such as bread; and pizza and hamburgers, particularly among Korean adolescents(Reference Song, Park and Paik22). Furthermore, the food delivery system has become more established and prevalent in Korea. It is common for people to order fast foods such as fried chicken, pizza or noodles to be delivered, rather than consuming a traditional home-cooked meal. Finally, restaurants and take-out establishments generally serve foods accompanied by pickled vegetables such as pickled cucumbers, pickled radish or pickled yellow radish. The presence of these extra side dishes presumably leads to an increased consumption of these fermented foods.
The goal of Na intake for Korean adults is 2000 mg/d according to the Dietary Reference Intakes for Koreans and the WHO(11, 23). This level is higher than the daily 1500 mg recommended in the USA for adults aged 19–50 years (1300 mg for 51–70 years and 1200 mg for >70 years). Yet, it is lower than the US tolerable upper intake of 2300 mg/d(Reference Del Valle, Yaktine and Taylor24). Nevertheless, the overall Na consumption by Koreans is still greater than that of their guidelines. A study by Lee et al. reported that the contribution of dietary Na was highest from foods such as kimchi, soya sauce, soyabean paste and ramen, based on the 1998, 2005 and 2007–2009 KNHANES(Reference Lee, Duffey and Popkin25). Specifically, kimchi is the most popular type of fermented food in Korea and it contributes the highest proportion of Na to the daily diet, 22·8–31·7 %, according to the 1998 and 2010 KNHANES(Reference Song, Park and Shim19). Fermented foods are well known to contain a high amount of Na. However, the trend analysis of the present paper reported a significant decrease in both fermented food consumption and Na intake from fermented foods overall for Korean adults, both men and women, from 1998 to 2016. One of the most important results noted was that total daily Na intake from overall diet decreased noticeably over time, with a decline of approximately 15 % in men and 28 % in women between 1998 and 2016. In addition, this decrease could be attributed to greater awareness of the negative influence of excessive Na consumption in Korea(Reference Kim and Lee26). One plausible reason for the awareness could be a campaign to promote eating less Na that was initiated by the Ministry of Food and Drug Safety in 2012. This campaign even resulted in numerous manufacturers producing low-Na products voluntarily(27). Also, information on the negative impact of high Na intake has been presented in numerous types of media and literature throughout the years. For example, it has been reported that the incidence of osteoporosis and hypertension in Korea is related to high Na consumption for postmenopausal women(Reference Park, Choi and Rhee28). Also, experts have elaborated on the importance of reducing dietary Na as decreased salt intake lowers blood pressure and this could be protective against end-organ damage from diabetes(Reference Ekinci, Clarke and Thomas29). This message may have been effective. A Korean study by Kang et al. observed that those with diabetes consumed less Na (4910 mg) overall than those without the diabetes (5188 mg). Also, women recently diagnosed with diabetes consumed more Na (4314 mg) than those previously diagnosed with diabetes (3813 mg)(Reference Kang, Kim and Jeong30). Although the prevalence of hypertension did not change noticeably over time in Korea, hypertension awareness increased dramatically from 1998 to 2016, specifically from 19·7 to 64·9 % in men and from 29·6 to 66·8 % in women(6). This increased awareness might have been an influence on the decline in Na consumption over time, which may be related to hypertension.
A meta-analysis by Kim et al. showed that greater fresh vegetable intake was inversely related with the risk of gastric cancer. However, the risk of gastric cancer was increased with the consumption of processed vegetables such as pickling or adding salt(Reference Kim, Lim and Lee31). Yet, the incidence rate of stomach cancer decreased from 43·6 % in 1999 to 33·8 % in 2015 in Korea(Reference Jung, Won and Kong32). It is plausible that the significant trend for decreased fermented foods over time could be related to the concomitant declining risk in gastric cancer.
A strength of the present research is that existing KNHANES data from 1998 to 2016 were utilized for the trend analysis. It is the first to examine trends in fermented food intake, specifically six categories which represent the significant types of fermented foods in Korea, and trends in Na consumption from each fermented food over time with a representative Korean population. Estimation of Na consumption of individuals via a 24 h dietary recall is a challenge since the precise amount of Na in cooked dishes is difficult to define. However, KNHANES provides the most accurate examination of the Korean population at this time(Reference Kim and Oh33, Reference Nam34). This trend analysis is important information for health professionals, as fermented foods remain the most popular side dishes of Korean meals. The data suggest that individuals should reduce Na intake and that health professionals should continue to provide education on the effects of Na intake related to health. Yet, a number of limitations exist. Methods used to collect samples changed from triennially to annually between 1998 to 2005 and 2007–2009 to 2016. Thus, P for trend tests were performed separately for 1998 to 2016 and 2007–2009 to 2016 in the tables due to this reason. Also, the 24 h dietary recall method utilized does not capture habitual intake because individuals do not consume the same foods every day. In addition, this trend analysis was not focused on finding associations between fermented food intake and disease, but solely on identifying consumption trends. Therefore, variables such as weight and total energy intake were not adjusted for in the multivariate model. Further research could be undertaken to examine trends in K intake from fermented foods over time to determine if a close relationship with Na exists.
Conclusion
Consumption of fermented foods, especially kimchi, by Korean adults decreased significantly over time from 1998 to 2016. Also, Na intake overall, and Na intake per day, from total fermented foods was considerably reduced. Although pickled vegetable intake and Na intake from pickled vegetables increased noticeably over time, these condiments contribute only a small portion of the Korean diet. The downward trends in Na consumption overall are positive; however, a reduction in the addition of Na to fermented foods during the manufacturing process could help further lower total Na intake. The present research on trends in food consumption can help to identify the influence of fermented foods on potential health and help guide the development of future dietary recommendations in Korea.
Acknowledgements
Financial support: This research received no specific grant from any funding agency in the public, commercial or not-for-profit sectors. Conflict of interest: No potential conflict of interest was reported by the authors. Authorship: All authors contributed to the design and implementation of the research. J.H.F.-G. supervised the work overall, and S.Y.K. and H.J.K. analysed the data. Also, S.Y.K. and J.H.F.-G. co-authored the manuscript. All authors discussed the results and reviewed and commented on subsequent drafts of the manuscript. All authors provided critical feedback and helped shape the research. Ethics of human subject participation: Not applicable; this research was a secondary data analysis.


