


The frequency and time of food intake influence biological cycles and consequently, health(Reference Potter, Janet and Cade1). Irregular eating and eating at unusual times can lead to circadian rhythm disorders(Reference Potter, Janet and Cade1–Reference Oike, Oishi and Kobori3), obesity(Reference Almoosawi, Vingeliene and Karagounis4), metabolic dysfunctions, such as hypertension, diabetes mellitus and metabolic syndrome(Reference Almoosawi, Prynne and Hardy5), and unbalanced levels of leptin and ghrelin, hormones that help control appetite and body weight(Reference Oike, Oishi and Kobori3).
Because meals exert important biological effects(Reference Wehrens, Christou and Isherwood6,Reference Lopez-Minguez, Gómez-Abellán and Garaulet7) , the incorporation of meal and snacks into dietary patterns (DP) analysis has been an emerging field of research in nutrition epidemiology(Reference Leech, Worsley and Timperio8–Reference Murakami, Livingstone and Sasaki13). DP analysis is an exploratory, data-driven analytic approach (also called ‘a posteriori’) that describes the combinations in which foods are consumed incorporating multiple dietary characteristics, such as foods or nutrients in the analysis, as opposed to individual nutrients and foods approaches(Reference Newby and Tucker14). DP analysis is often explored in relation to socio-economic factors(Reference Hinnig, Monteiro and de Assis15), lifestyle behaviour patterns(Reference de Oliveira, Lobo and Kupek16) or a particular health or dietary outcome(Reference Liberali, Kupek and de Assis17). The study of meal-specific DP may be more insightful, given that people consume combinations of foods at a given eating occasion where there are interactions between foods and nutrients. Also, it is important to understand how different meal patterns affect overall diet quality and health(Reference de Oliveira Santos, Fisberg and Marchioni9,Reference de Oliveira Santos, Vieira and Miranda10) .
Only few studies on children and adolescents(Reference Vilela, Oliveira and Milton Severo18,Reference Kupek, Lobo and Leal19) have examined meal-specific DP with some research focusing on breakfast(Reference Lepicard, Maillot and Vieux20,Reference Afeiche, Taillie and Hopkins21) or snacking(Reference Shroff, Perng and Baylin22,Reference LeCroy, Truesdale and Matheson23) patterns. Other Brazilian studies based on adult populations examined DP for main meals (breakfast, lunch and dinner)(Reference de Oliveira Santos, Fisberg and Marchioni9–Reference Baltar, Cunha and Santos11).
In a prospective study conducted with Portuguese children, factor analysis was used to identify patterns of time-of-day of energy and macronutrient intake according to the meals at 4 year of age, and the effect on the weight status at 7 year of age was investigated. A higher proportion of energy and macronutrient intake at the main meals and a lower proportion during the afternoon and evening seemed to be more beneficial for children’s weight, when all daily eating occasions were taken into account(Reference Vilela, Oliveira and Milton Severo18). In a Brazilian cross-sectional study, latent class analysis was applied to derive discriminant DP based on the time-of-day of six eating events in 7–10-year-old schoolchildren. Children having a traditional lunch with rice and beans as the main meal of the day had the lowest obesity risk, independently of socio-economic and demographic factors(Reference Kupek, Lobo and Leal19).
Lepicard et al. (Reference Lepicard, Maillot and Vieux20) found four breakfast patterns in French children aged 9–11 years. The most prevalent pattern was the ‘sweet pattern’ that included mainly flavoured (i.e., chocolate) milk and sweets, especially brioche and chocolate spread, plus water or juice. Afeiche et al. (Reference Afeiche, Taillie and Hopkins21) identified six breakfast patterns in 4–13-year-old Mexican children and the most prevalent was ‘milk and sweetened breads’. The authors also observed that sugar-sweetened beverages were consumed across all patterns.
In a prospective study conducted with 5–12-year-old Colombian schoolchildren, snacks patterns with high energy intake such as sugary drinks, sweets and fried foods were associated with the development of adiposity over a median of 2–5 years of follow-up(Reference Shroff, Perng and Baylin22). In a study conducted with 2–11-year-old American children, two snack patterns were identified using factor analysis: a meal-like pattern (higher factor loadings for non-starchy vegetables, meats and grains) and a beverage pattern (higher loadings for unsweetened milk and sugar-sweetened beverage). The authors observed a positive association between the meal-like pattern and the diet quality(Reference LeCroy, Truesdale and Matheson23).
Aligning healthy eating patterns with types of meals and snacks throughout the day may be a key component for the development of effective dietary interventions based on the 2014 Brazilian Dietary Guidelines (BDG)(24). The proposed guidelines with an emphasis on meals, meal times and cooking at home(24) use the NOVA system groups(Reference Monteiro, Cannon and Moubarac25) (fresh/minimally processed foods, processed culinary ingredients, processed foods and ultra-processed foods) to guide the choice and combination of healthy foods in meals and snacks. The implementation of such strategies may require a better understanding of DP by meal type throughout the day and to build on existing consumption patterns.
Considering the scarcity of studies assessing meal-specific DP in children and adolescents, the current study aimed to identify the meal and snack patterns of public school students aged 7–13 years in a southern Brazilian city.
Methods
Study design and participants
This is a cross-sectional study carried out with second- to fifth-grade students enrolled in public schools in Florianopolis, southern Brazil, between September and November 2017. Florianopolis is the capital of the state of Santa Catarina. It has 421 240 inhabitants, 11 % of which are aged 6–14 years. In the 2010 national census, Florianopolis scored 0·847 on the Human Development Index (ranking first among the 26 Brazilian state capitals) and 0·54 on the Gini Index. The infant mortality rate was 10·8 per 1000 live births, and the life expectancy at birth was 77·4 years(26).
Nine public schools, representing the five regions of the city (north, south, east, continent and centre), were selected by random cluster sampling from a list of nineteen eligible schools, stratified by geographical location and income level. All public schools serving grades 2–5 in both morning and afternoon shifts were considered eligible.
The sample size was calculated to detect eating behaviour shared by at least 1 % of students with a margin of type I error of ±0·9 % and a design effect of 2 after finite population correction. The prevalence of 1 % was based on previous studies with the same population that pointed out the relevance of these behaviours at the population level, while the ±0·9 % margin of type I error was chosen to avoid zero prevalence when the behaviour actually exists in the population (false negative or omission of foods)(Reference Lobo, de Assis and Leal27). As a result, minimum sample size was estimated at 897 schoolchildren. A 10 % safety margin was added for expected non-response due to not providing signed consent to participate in the survey or absenteeism during data collection resulting in 987 schoolchildren.
All students enrolled from second to fifth grades (n 2066) were invited to participate in the study. The final sample included 1200 schoolchildren who provided both child and parental consent and were present at the school during data collection.
Anthropometric, demographic and socio-economic data
Weight and height measurements were performed according to standard procedures(Reference Lohman, Roche and Martorell28). Body weight was measured to the nearest 0·1 kg with a portable digital scale (PP 180, Marte Científica). Height was measured to the nearest 1 mm with a stadiometer (AlturExata). Age- and sex-specific BMI Z-scores were calculated according to the WHO for children and adolescents aged 5–19 years(Reference de Onis, Onyango and Borghi29). The weight status of children was categorised as either non-overweight (thinness and normal weight) (BMI Z-score for age < +1) or overweight including obesity (BMI Z-score for age ≥ +1·0).
Demographic and socio-economic data were collected through a questionnaire sent to parents/guardians. Maternal education was categorised as years of schooling into 0–8 years (primary school not completed to primary school completed), 9–11 years (secondary school not completed to secondary school completed) and ≥12 years (college degree not completed and higher) and was used as a proxy for family income.
Measurement of dietary intake
Data were obtained using the Web-CAAFE (Food Intake and Physical Activity of Schoolchildren), a validated web-based self-reported questionnaire designed for use in the school settings in order to help public health and education professionals to evaluate schoolchildren from the second to the fifth grade regarding: (i) weight status based on BMI, food consumption, physical activity and sedentary behaviours; (ii) assessment of school compliance and children’s acceptability of the National School Meals Program and (iii) participation in and satisfaction with physical education classes at school(Reference Lobo, de Assis and Leal27). Usability tests showed child capacity to understand and respond to Web-CAAFE(Reference Da Costa, Schmoelz and Davies30), and reproducibility showed moderate-to-good values of the intraclass correlation coefficients(Reference Perazi, Kupek and de Assis31). Validity tests of the food consumption section, using direct observation at school meals as the reference method, showed 43 % matches, 29 % intrusions and 28 % omissions(Reference Davies, Kupek and de Assis32), placing this questionnaire’s accuracy close to that of other similar instruments(Reference Wijnhoven, van Raaij and Sjoberg33).
The questionnaire is structured in three sections: registration, diet and physical activity(Reference Da Costa, Schmoelz and Davies30). The registration section collects information about respondents: their name, mother’s name, sex, weight, height, age, date of birth and study period. The diet section is a previous-day recall of frequency of intake of thirty-one dietary items offered for each of the six structured eating events (see details below). For each event, thirty-one images (icons) of foods/beverages or food groups are presented on the computer screen: rice, vegetables (such as carrots, pumpkin and broccoli), green leaves, vegetable soup, beans (cooked), manioc flour, maize/potatoes, pasta, instant pasta, French fries, beef/poultry, sausages, eggs (fried, boiled or omelette), fish/seafood, fruits (all kinds of traditional Brazilian fruits such as bananas and oranges), bread/biscuits, cheese bread, cream cookies, breakfast cereal, cheese, milk, coffee with milk, yogurt, chocolate milk, fruit juices, sodas, sweets (such candies, chocolate bars, ice cream and cakes with icing), chips, pizza/hamburger/hot dog, cakes without icing and water (online supplementary material, Supplemental Fig. 1).
Like other instruments developed for children(Reference Wijnhoven, van Raaij and Sjoberg33), the Web-CAAFE was not designed to provide an estimate of total energy intake or global food intake but to investigate the markers of (un)healthy foods related to weight status. The food items were chosen in order to take into account the food consumption of children of this age group, the food presented in school menus and the food recommended in the guidelines for Brazilian population(24,34) . The frequency of food intake was defined per eating event (consumption or no-consumption for each of the thirty-one food items), assuming that only one serving was consumed on each occasion.
The questionnaire was administered in the school computer room in the presence of trained researchers, who assisted the children when needed. Data were collected once for every child and the day at which the questionnaire was assessed differed between children. This strategy was used in order to describe the daily variability of dietary intake on various days of the week to reflect dietary intake on school days (Monday to Thursday) and non-school days (Sunday and holidays) allowing for the analysis of this behaviour at the group level. As the Web-CAAFE was applied in the school setting and there was no school on Saturdays and Sundays, it was not possible to obtain data representing food consumption for Fridays and Saturdays.
The Demo version of the questionnaire, including English subtitles, is available on http://caafe.ufsc.br/portal/10/detalhes
Definition of meals and snacks throughout the day
The meals and snacks throughout the day were pre-determined in the questionnaire according to the six eating events ordered chronologically and presented sequentially on the screen (breakfast, mid-morning snack, lunch, afternoon snack, dinner and evening snack). A robot-like avatar guides children responding to the questionnaire (see Demo version and online supplementary material, Supplemental Fig. 1). For the diet section, the avatar explains the concept of each meal or snack, the time of the day and the importance of reporting food consumption from the previous day. For each event, thirty-one images (icons) of foods and beverages are presented on the computer screen, so that a child can select items by clicking in order to report the ingested meal or snack composition. For example, for a child who was studying in the morning shift and who answered the Web-CAAFE on Wednesday, the avatar explains: ‘Breakfast is the first meal of the day after waking up’, ‘Click on the foods you ate for breakfast yesterday, Tuesday; ‘The morning snack is what you ate after breakfast and before lunch’. ‘This is the snack you usually make at school’; ‘Click on the foods you ate for morning snack yesterday, Tuesday’. ‘Now let’s talk about lunch’. ‘Click on the foods you ate for lunch yesterday, Tuesday’. This set of questions was repeated for each meal or snack illustrated in the questionnaire. At the end of each meal or snack, the avatar explains ‘Remember, if you didn’t eat anything, click the nothing button’. The avatar also instructs the child not to click on any food not consumed during the preceding day.
Statistical analysis
For data analysis, fifty-five children were excluded for not having completed the Web-CAAFE and seventy-one children for recalling implausible dietary data. As the Web-CAAFE does not provide data on quantities (portion size or grams) of foods, we were not able to apply the exclusion criterion based on energy misreporters to exclude children with implausible consumption. Thus, assuming a Poisson distribution for the frequency of food consumption(Reference Lobo, de Assis and Leal27), so that the Standard Deviation (sd) equaled the square root of the mean, we considered implausible dietary data such as reporting fewer than three food items per day or more than the mean + 3 sd.
Qualitative data were described using absolute and relative frequencies. In order to identify DP, exploratory factor analysis with principal component estimation was applied to the consumed food/beverage items without grouping, considering that each eating event contains the same thirty-one food items. For meal and snacks patterns analysis, only data of children who consumed at least one food item (except water) in the meals or snacks were considered. Food items consumed by < 3·0 % of the sample in mid-morning and evening snacks and those consumed by < 3·5 % of the sample at breakfast, lunch, dinner and afternoon snacks were excluded from the analysis. Like other studies that used cut-offs for the inclusion of foods in factor analysis to derive patterns stratified by meals(Reference de Oliveira Santos, Fisberg and Marchioni9,Reference Baltar, Cunha and Santos11) , the cut-offs applied in the present study were based on the proportion of children who consumed each food item per meal (data presented in the ‘Results’ section).
The Kaiser–Meyer–Olkin statistical test was used to verify the applicability of the factor analysis. A Kaiser–Meyer–Olkin value of < 0·50 was deemed unacceptable(Reference Kaiser35). Eigenvalues > 1·5 and the observation of the scree plot were considered to retain the number of factors(Reference Biazzi Leal, Altenburg de Assis and Hinnig36). Varimax orthogonal rotation was used to simplify data interpretation(Reference Kaiser35). Food items with factor loads ≥ 0·30 were considered representative of each DP and were deemed to be the most informative in describing the DP. Foods failing to load on any factor were removed from the analysis (maize/potatoes from lunch, cheese bread from afternoon snack, and maize/potatoes and pasta from dinner), as they did not explain any factor. After exclusions, the factor analysis was performed again to identify the best number of factors that represents the pattern.
Patterns were labelled according to the food items with the highest positive factor loadings per DP in each meal or snack, and taking into account the recommendations of the 2014 BDG(24) as: ‘healthy’ (prevailing unprocessed or minimally processed foods), ‘unhealthy’ (prevailing ultra-processed foods) and ‘mixed’ (including unprocessed/ minimally processed foods and ultra-processed foods). We also named ‘Brazilian traditional’, patterns describing combinations of foods traditionally eaten in the country. While these labels do not perfectly describe each underlying pattern, they aid in the reporting and discussion of the results.
All statistical analyses were performed using Stata version 13.0.
Results
The analysed sample included 1074 schoolchildren with complete socio-demographic, anthropometric and plausible dietary recall data (Fig. 1).

Fig. 1 Flow chart of the study design. n*, number of students who reported consumption at least one food item (excepting water) in the meal
Children were aged 7–13 years, with a mean (sd) age of 9·6 (1·2) years. Most students were female (54·4 %) and attended school in the afternoon shift (50·5 %). The mothers of 49·0 % of the children had 9–11 years of schooling. More than one-third (37·5 %) of students were overweight or obese. The majority of dietary reports (70·9%) referred to the weekday. Most children (83·8 %) ate four or more meals/snacks per day. Lunch was reported by the majority of children (96 %), followed by dinner (86·4 %) and breakfast (85·3 %). Among the snacks, mid-afternoon snack was the most frequent (81·7 %), followed by evening (59·4 %) and mid-morning snacks (59·1 %) (Table 1).
Table 1 Characteristics of 7–13-year-old schoolchildren included in the study

Table 2 shows the consumers by meals and snacks, the percentage of children reporting dietary items consumed within each meal and snack and daily consumption frequency of food items. The food items that had the highest daily average of frequency of consumption were rice (1·04), breads (0·96), beef/poultry (0·83) and beans (0·81). During lunch and dinner, rice, beans, beef/poultry, sodas and fruit juices were the top five foods reported, whereas at breakfast, the top foods were bread/biscuits, coffee with milk, chocolate milk, fruits and cream cookies. At mid-morning and mid-afternoon snacks, the same top five foods/beverages were reported (fruits, bread/biscuits, cream cookies, fruit juices and chocolate milk), whereas the top foods at evening snack were fruits, sweets, cream cookies, chocolate milk and sodas. At lunch and dinner, the percentage of children reporting consumption of water (11 and 9 %, respectively) was lower than the percentage of children reporting sodas (19 and 16 %, respectively) and fruit juices (17 and 14 %, respectively). Water consumption was more reported at evening snack (17 %) than in the remaining meals and snacks (around 10 %).
Table 2 Percentage of schoolchildren who reported food and beverage intake in each eating event and description of daily consumption frequency (n 1074)
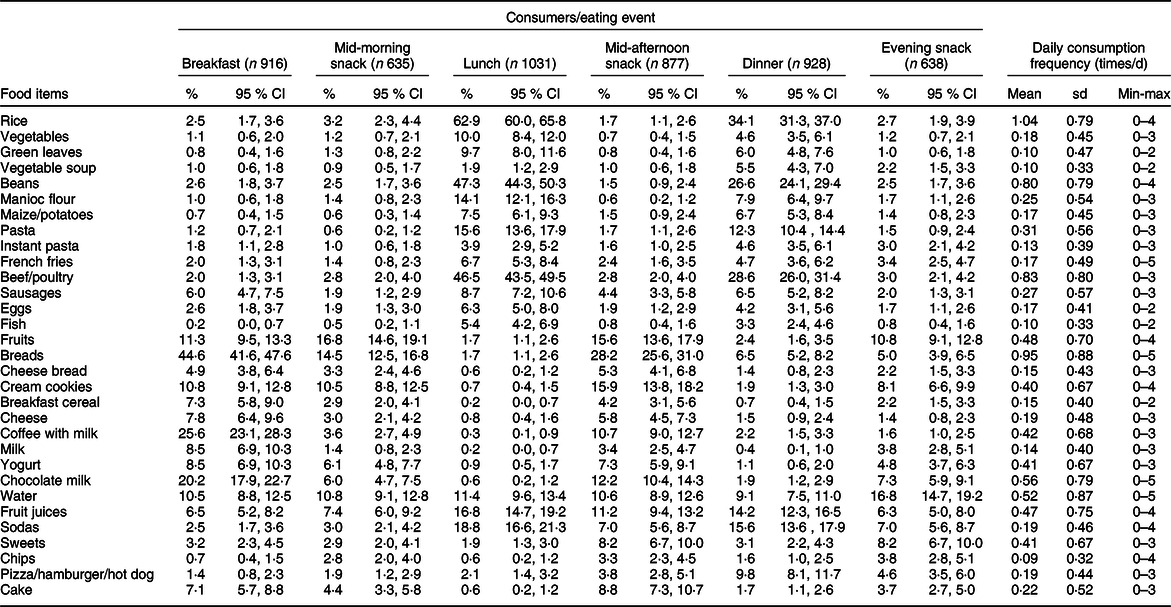
Min: Minimum; Max: Maximum.
Factor analysis identified four DP for breakfast (57·1 % of variance explained), lunch (52·9 % of variance explained), dinner (63·7 % of variance explained), mid-morning snack (62·4 % of variance explained) and evening snack (56·6 % of variance explained). Three DP were identified for mid-afternoon snack (47·7 % of variance explained) (Tables 3 and 4).
Table 3 Factor loadings for meal patterns (breakfast, lunch and dinner) in 7–13-year-old schoolchildren
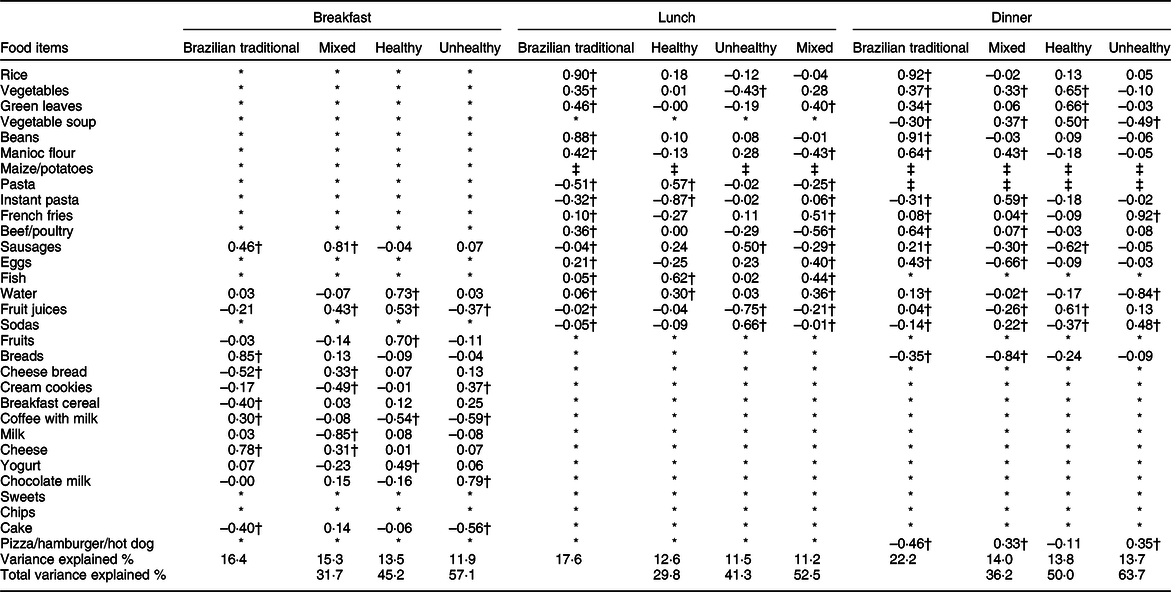
* Food items not included in pattern analysis because their consumption frequencies at breakfast, lunch and dinner were < 3·5 %.
† Factor loadings ≥ 0·30 are shown in bold.
‡ Food items not included in the analysis because did not contribute significantly to any pattern.
Table 4 Factor loadings for snacks dietary patterns (mid-morning snack, mid-afternoon snack, and evening snack) in 7–13-year-old schoolchildren
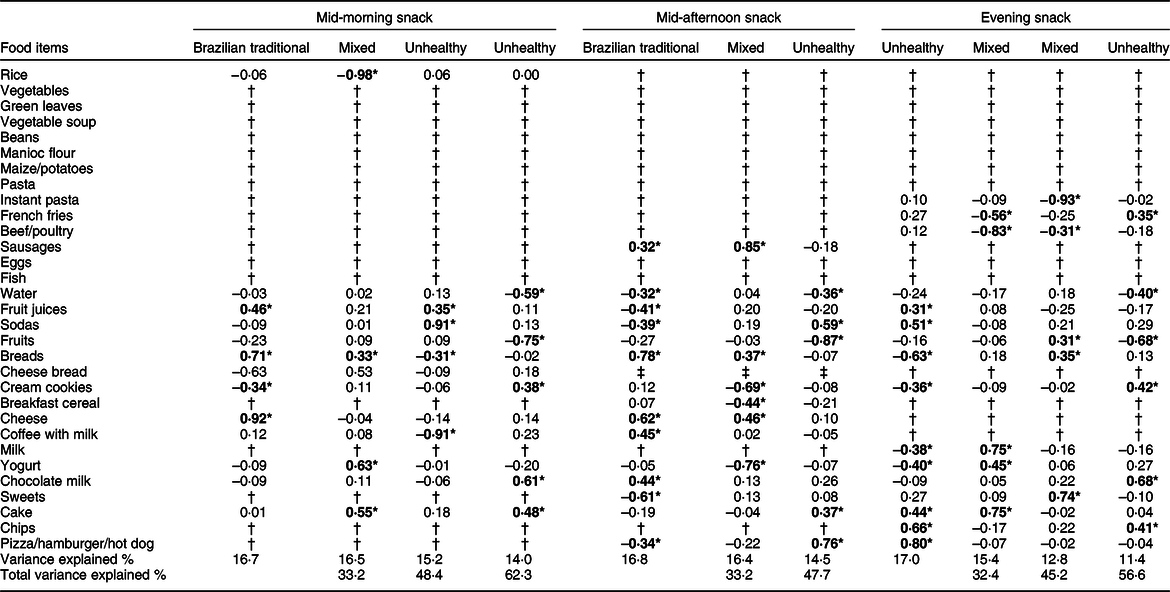
* Factor loadings ≥ 0·30 are shown in bold.
† Food items not included in pattern analysis because their consumption frequencies were < 3·0 % in mid-morning and evening snacks or < 3·5 % in mid-afternoon snack.
‡ Food items not included in the analysis because they did not contribute significantly to any pattern.
Table 3 describes the factor loadings for each meal pattern (breakfast, lunch and dinner). The first breakfast pattern (BP) was named ‘Brazilian traditional’ and had positive loadings for breads, cheese, sausages and coffee with milk, and negative loadings for cheese bread, breakfast cereal and cake. The second pattern had positive loadings for sausages, fruit juices, cheese bread and cheese, and negative loadings for milk and cream cookies, and was therefore labelled ‘mixed’ BP. The ‘healthy’ BP was described by water, fruits, fruit juices and yogurt and had negative loading on coffee with milk. The ‘unhealthy’ BP consisted of positive loadings for chocolate milk and cream cookies, and negative loadings for coffee with milk, cake and fruit juices.
Lunch pattern 1 named ‘Brazilian traditional’ was loaded highly on rice, beans, green leaves, manioc flour, beef/poultry and vegetables but had negative loadings for pasta and instant pasta. Fish, pasta and water were the foods loading highly on the ‘healthy’ lunch pattern and had negative loading for instant pasta. The ‘unhealthy’ lunch pattern was highly associated with sodas and sausages and was negatively associated with fruit juices and vegetables. lunch pattern 4 was positively associated with French fries, fish, green leaves, eggs and water but negatively associated with beef/poultry and manioc flour. We therefore chose to label this pattern as ‘mixed’.
Dinner pattern 1 could be described as a ‘Brazilian traditional’. It was positively associated with rice, beans, beef/poultry, manioc flour, eggs, vegetables and green leaves and was negatively associated with pizza/hamburger/hot dog, breads, instant pasta and vegetable soup. The ‘mixed’ dinner pattern was loaded highly on instant pasta, manioc flour, vegetable soup, vegetables and pizza/hamburger/hot dog but was negatively associated with breads, eggs and sausages. The ‘healthy’ dinner pattern had positive high loadings on green leaves, vegetables, fruit juices and vegetable soup, while having negative loadings on sausages and sodas. The high loading foods items on ‘unhealthy’ dinner pattern included French fries, sodas and pizza/hamburger/hot dog but had negative loadings on water and vegetable soup (Table 3).
Table 4 describes the factor loadings for each snacks pattern. The mid-morning snack pattern 1 named ‘Brazilian traditional’ included cheese, breads and fruit juices and had negative loadings for cheese bread and cream cookies. The second mid-morning snack pattern had high factor loadings on yogurt, cake, cheese bread and breads and negative loadings for rice and therefore could be interpreted as a ‘mixed’ mid-morning snack pattern. A pattern labelled ‘unhealthy’ included only sodas and fruit juices and had negative loadings for coffee with milk and breads. Another ‘unhealthy’ mid-morning snack pattern was characterised by high loadings for chocolate milk, cake and cream cookies and negative loadings for fruits and water (Table 4).
For mid-afternoon snack patterns, pattern 1 named ‘Brazilian traditional’ was characterised by positive loadings for breads, cheese, coffee with milk, chocolate milk and sausages and by negative loadings for sweets, fruit juices, sodas, pizza/hamburger/hot dog and water. The ‘mixed’ afternoon snack pattern was represented by sausages, cheese and breads and was negatively associated with yogurt, cream cookies and breakfast cereal. The high loadings food items on ‘unhealthy’ afternoon snack pattern included pizza/hamburger/hot dog, sodas and cake and had negative loadings on fruit and water (Table 4).
The first evening snack pattern (ESP) was named ‘unhealthy’ and had positive loadings for pizza/hamburger/hot dog, chips, sodas, cake and fruit juices and negative loadings for breads, yogurt, milk and cream cookies. The second ESP had positive loadings for milk, cake and yogurt and negative loadings for beef/poultry and French fries, and was therefore labelled ‘mixed’ ESP. The other ‘mixed’ ESP was described by sweets, breads and fruits and had negative loading on instant pasta and beef/poultry. The other ‘unhealthy’ ESP consisted of positive loadings for chocolate milk, cream cookies, chips and French fries and was negatively associated with fruits and water (Table 4).
Discussion
The current study presents an original assessment of meal-specific DP in Brazilian schoolchildren. Previous data in the literature had mostly focused on eating patterns at isolated time periods of the day, disregarding other eating occasions(Reference Lepicard, Maillot and Vieux20–Reference LeCroy, Truesdale and Matheson23). Almost all children ate the traditional three main meals (breakfast, lunch and dinner), while more than two-thirds of them reported eating the mid-afternoon snack, and about half of the children reported the mid-morning and evening snacks.
In our study, we identified four DP at breakfast, lunch and dinner, labelled ‘Brazilian traditional’, ‘healthy’, ‘mixed’ and ‘unhealthy’. At mid-morning snack, four patterns were derived termed ‘Brazilian traditional’ and ‘mixed’, and two of them named ‘unhealthy’. At mid-afternoon snack, we identified three patterns, labelled ‘Brazilian traditional’, ‘mixed’ and ‘unhealthy’. For the evening snack, four DP were extracted, two of them named ‘mixed’ and the other two patterns labelled ‘unhealthy’.
The ‘Brazilian traditional’ pattern of the main meals included typical Brazilian foods, such as rice, beans, beef and breads(Reference de Oliveira Santos, Fisberg and Marchioni9,Reference Pereira, de Castro and Hopkins37) . Mid-morning and mid-afternoon snack patterns were similar to breakfast patterns but also included sugary beverages. At evening snack, the first and fourth patterns named ‘unhealthy’ were characterised by the consumption of foods high in sugars, fats and sodium.
The breakfast patterns of the present study included at least one dairy food and one beverage. The ‘Brazilian traditional’ BP consisted of foods typically eaten for breakfast in Brazil, such as breads, cheese, processed meats and coffee with milk(Reference de Oliveira Santos, Fisberg and Marchioni9–Reference Baltar, Cunha and Santos11,Reference Kupek, Lobo and Leal19,Reference Pereira, de Castro and Hopkins37,Reference Andrade, da Costa Louzada and Azevedo38) . In Mexican children aged 4–13 years, milk and sweet breads constituted the most common breakfast pattern, and the three other patterns comprised typical Mexican foods (tortillas, beans and quesadillas)(Reference Afeiche, Taillie and Hopkins21). Despite cultural and geographical differences between Mexico and Brazil, sugary sweetened beverages were identified in breakfast patterns (juice in two patterns and chocolate milk in one) of schoolchildren from both countries. In French children aged 9–11 years(Reference Lepicard, Maillot and Vieux20), the two breakfast patterns identified were similar to the breakfast patterns ‘healthy’ and ‘unhealthy’ of the current study. The most frequent breakfast pattern included flavoured milk and sweets, particularly brioche and chocolate spread, plus water or juice, similar to the ‘unhealthy’ BP of the present study (chocolate milk and cream cookies).
Only one breakfast pattern observed in our study is in agreement with the recommendations of the BDG(24). Processed meats (classified as ultra-processed foods) were identified in two patterns, whereas fruits were part of only one pattern. Examples of food combinations suggested by BDG(24) include milk, cheese or yogurt (dairy products), breads or cakes (cereals) and fruits or fruit juice. In addition to the suggested examples, the BDG recommends that the diet should be based on natural or minimally processed foods, the consumption of processed foods should be limited and ultra-processed foods should be avoided(24). In the Web-CAAFE questionnaire, the option fruit juices includes juices with added sugars(Reference Lobo, de Assis and Leal27).
Brazilian traditional lunch and dinner DP were observed in the present study, consisting of rice, beans, beef/poultry, vegetables and green leaves, which are among the foods with the highest mean daily per capita consumption in Brazil(39). This traditional DP was associated with a lower risk for obesity in Brazilian children aged 7–10 years who eat rice and beans for lunch(Reference Kupek, Lobo and Leal19). Cooked beans are high in dietary fibre, high-quality plant protein, B-complex vitamins and has low energy density and glycaemic index(Reference Mudryj, Yu and Aukema40). Many Brazilian adults (>20 years of age) from the São Paulo Health Survey(Reference de Oliveira Santos, Fisberg and Marchioni9) consumed this traditional dish for lunch and dinner, but some adopted a Western DP for lunch, consisting of soft drinks and processed meats, similar to the ‘unhealthy’ pattern identified in the present study. Other Brazilian studies conducted with children analysed the whole day DP and also identified the traditional DP consisting of rice, beans, vegetables, cooked roots and tubers, and red meat(Reference Lobo, de Assis and Leal27,Reference Villa, Ribeiro and Santos41) .
Fast foods and sugary beverages were part of at least one DP in all three snack periods. Regarding to the mid-morning and mid-afternoon snacks, we identified patterns characterised by soda consumption. According to the government laws(42,43) which prohibited the commercialisation of sodas and artificial juices at public schools in the city where the present research was conducted, it is possible that children consumed sodas during out of school hours or in the weekends, or even brought this beverage to school.
Two patterns in the evening snack named ‘unhealthy’ included fruit juices, sodas, cake, chips and pizza/hamburger/hot dog, and the other comprised French fries, cream cookies and chips. Because the evening snack represents foods that are consumed after dinner but before bedtime, it is possible that these food items are eaten in front of a screen, such as the TV. In a systematic review by Rossi et al., a significant positive association between TV time and consumption of snacks, sweets and sugary beverages was observed(Reference Rossi, Albernaz and Vasconcelos44).
Other Brazilian studies conducted with children and adolescents from different geographical regions than the present study showed a significant consumption of fast foods and sugary beverages, when the global DP was evaluated(Reference D’Innocenzo, Marchioni and Prado45,Reference Silva, Assis and Szarfarc46) .
Because foods usually consumed at specific meals will most likely not be consumed at other times, nutritional interventions for a healthy diet may be tailored according to meal-specific DP instead of issuing a general recommendation based on the whole day for a healthy diet.
There are three important aspects to take into account for nutritional policies and dietary intervention programmes when we examined the findings of the present study. First, most of the children reported ate the traditional three main meals (breakfast, lunch and dinner). Children in the age range (7–13 year) of the present study probably have the main meals with the family. Second, in public schools, where children typically spend 4 h a day, a mid-morning or mid-afternoon snack/meal is usually offered. Third, the prevalence of overweight or obese children is high. So, dietary messages regarding the three main meals and the evening snack may be tailored to the children’s families, whereas those focusing on the mid-morning and mid-afternoon snacks should be addressed to children’s families and schools.
The maintenance of the ‘Brazilian traditional’ DP and the ‘healthy’ DP found in the three main meals of the present study may be reinforced regarding the benefits for health and well-being. The ‘mixed’ DP (healthy and unhealthy food items) merits attention, mainly because it also includes highly processed foods like sausages at breakfast, French fries at lunch and instant pasta and pizza/hamburger/hot dog at dinner. Messages regarding the ‘unhealthy’ DP at breakfast should be to replace chocolate milk with milk and cream cookies by bread. At lunch and dinner, sodas should be replaced with water, and messages may reinforce the importance of home-prepared dishes, choosing healthy items like vegetable soups, meat, poultry or fish, instead of sausages and pizza/hamburger/hot dogs.
For the mid-morning and mid-afternoon snacks, whereas the ‘Brazilian traditional’ DP found in the snacks events is typical in this age range, school’s menus should offer more healthy options like a variety of fruits (including fruit salads), fresh vegetables stuffed sandwiches and regional sea foods dishes prepared at school. Also, milk and plain water consumption should be promoted instead of sodas and fruit juices. Ensuring access to safe, free drinking water in schools may be an important initiative in order to increase water consumption and reduce energy intake when substituted for sugar-sweetened beverages(53) (chocolate milk, sodas and fruit juices).
A major strength of the current study is that we examined three main meals and three snacks across the day.
The current study has limitations. First, the study population is from public schools and presents homogeneity in terms of socio-economic status. Therefore, meal patterns may not reflect the dietary intake of private school students, who generally have a higher socio-economic level.
Second, it is possible that the frequency and composition of meals and snacks reported by children for a single day may not represent their usual intake(Reference Gibson, Charrondiere and Bell47,Reference Dodd, Guenther and Freedman48) . However, in the current study, different children answered the Web-CAAFE questionnaire on different days, allowing analysis of food consumption at the group level(Reference Dodd, Guenther and Freedman48). Memory bias may represent a source of error in previous-day dietary recalls, but the reproducibility and validity of the Web-CAAFE for school-age children were assessed and confirmed(Reference Perazi, Kupek and de Assis31,Reference Davies, Kupek and de Assis32) . The subjectivity in choosing the number of food items per meal and the numbers of factors to retain in the factor analysis should also be considered(Reference Newby and Tucker14). As the proportion of reported foods differs in each meal or snack, the decision for choosing different cut-off points for entering in factor analysis, in our view, benefits the analysis, allowing a greater number of food items to derive patterns and a higher percentage of variance explained by them. The use of a single cut-off point for all meals can impair the analysis in the sense of not taking into account the specificity of each meal, since each one has its characteristic and the most prevalent foods. Moreover, methodological decisions were based on well-known statistical procedures described in the literature, and the analysis steps are reported in detail.
Conclusion
In the present study, schoolchildren were found to have traditional Brazilian DP at breakfast, lunch and dinner and also patterns consisting of fast foods and sugary beverages in between-meal snacks, especially in the evening snack. These results may complement dietary guidelines and support policies and strategies aimed at improving the meal patterns of this population, as it identifies specific problems in DP. Attention should be given to the promotion of healthy habits in mid-morning, mid-afternoon and evening snacks. Future studies should focus on trend and longitudinal analysis of meal-specific DP to investigate changes and compliance with the 2014 BDG.
Acknowledgements
Acknowledgements: The authors gratefully acknowledge the children, parents/guardians and the school authorities for their participation in the study. Financial support: V.G.C., L.J.P. and D.M.T.R. received financial support by Brazilian Coordination for the Improvement of Higher Education Personnel (CAPES). Conflict of interest: There are no conflicts of interest. Authorship: V.G.C. participated in the concept, data analysis, interpretation and writing the manuscript; L.J.P., M.T.d.O., D.M.T.R., F.G.K.V., P.F.D.P., A.P.G.G., C.S., G.R. and F.H. participated in the study design, supervised the study implementation, interpretation and revised the manuscript. P.d.F.H. participated in the coordination of the study, supervised the study implementation and writing the manuscript; M. A. A. d. A. developed the measurement instruments and writing the manuscript. All authors read and critically reviewed the manuscript. Ethics of human subject participation: The current study was conducted according to the guidelines laid down in the Declaration of Helsinki and all procedures involving research study participants were approved by the Human Research Ethics Committee of the Federal University of Santa Catarina (UFSC, protocol number 63089016.9.0000.0121). Signed informed consent according to the Helsinki Declaration was required for all participants.
Supplementary material
For supplementary material accompanying this paper visit https://doi.org/10.1017/S1368980020003808


