


Previous studies have shown a seasonal variation in vitamin D status as reflected by higher blood concentrations of 25-hydroxyvitamin D (25(OH)D) in summertime than in wintertime( Reference Harris and Dawson-Hughes 1 , Reference Macdonald, Mavroeidi and Barr 2 ). At high northern latitudes, season greatly influences circulating 25(OH)D concentrations. Indeed, dermal generation of vitamin D declines dramatically from October to March so that even a long time spent doing outdoor activities cannot provide enough endogenous vitamin D for the body( Reference Seckmeyer, Schrempf and Wieczorek 3 ). Moreover, even living in sunny regions cannot guarantee sufficient dermal vitamin D synthesis because of such lifestyle factors as reduced outdoor activities and sunscreen use( Reference Sayre and Dowdy 4 ). On the other hand, the scarcity of natural dietary sources of vitamin D in amounts needed to reach adequate concentrations of circulating 25(OH)D is a major contributor to the vitamin D deficiency epidemic( Reference Holick 5 , Reference Webb, Kline and Holick 6 ).
The main source of vitamin D in most populations is photo-conversion of the precursor 7-dehydrocholesterol to previtamin D upon skin exposure to solar UV radiation (UVB; wavelength=290–315 nm). Several modifiable as well as non-modifiable factors can influence vitamin D status including age, latitude, skin pigmentation, body fat and season( Reference Kull, Kallikorm and Tamm 7 , Reference Holick 8 ). Poor vitamin D status, even in its subclinical form, is now recognized as one of the contributing factors in a wide range of human diseases including cancers, autoimmune diseases, diabetes, infectious diseases and cardiovascular disorders( Reference Grant 9 – Reference Nikooyeh, Neyestani and Farvid 11 ). Several population-based studies have reported the high prevalence of hypovitaminosis D among all age groups worldwide( Reference Neyestani, Hajifaraji and Omidvar 12 – Reference Park and Johnson 14 ).
A growing body of evidence indicates an association between poor vitamin D status and increased risk of CVD( Reference Wang, Pencina and Booth 15 – Reference Lee, O’Keefe and Bell 17 ). A meta-analysis of cross-sectional and observational studies demonstrated a 43 % reduction in CVD occurrence in individuals with sufficient circulating 25(OH)D concentrations( Reference Parker, Hashmi and Dutton 16 ).
There are several ways through which vitamin D deficiency could potentially influence CVD, including increased insulin resistance, hypertension, increased pro-inflammatory cytokine formation, obesity and dyslipidaemia( Reference Zittermann, Schleithoff and Koerfer 18 , Reference Nkooyeh and Neyestani 19 ). Several studies have reported an association of serum 25(OH)D with body fat and certain metabolic indicators( Reference Looker 20 , Reference Wang, Xia and Yang 21 ).
Alarming high prevalence of poor vitamin D status among Iranians in almost all age and sex groups( Reference Neyestani, Hajifaraji and Omidvar 12 , Reference Hashemipour, Larijani and Adibi 22 – Reference Rabbani, Alavian and Motlagh 26 ) convinced stakeholders at the Iranian Ministry of Health to take immediate action. As the first step, monthly vitamin D supplementation was started in 2014 for schoolchildren, first in girls’ schools in thirteen provinces. This was then extended to boys’ schools and other provinces. Obviously, many other subpopulations than schoolchildren were out of the coverage of this programme. Later, policy makers at the Ministry of Health decided to implement a national fortification programme to alleviate vitamin D deficiency in the many subpopulations not covered by the schoolchildren’s supplementation programme. A national vitamin D fortification programme would provide a sustainable approach with a wider coverage of individuals at risk of vitamin D deficiency. Before implementation of a national vitamin D fortification programme, it is necessary to first determine how the country’s wide range of latitudes (29 to 37°N), climatic and seasonal changes impact circulating 25(OH)D in Iranian adults and children( Reference Allen, de Benoist and Dary 27 ). Prior to launching a national fortification programme, it is also critical to determine the possible effects of vitamin D status on different health aspects of the population which may vary with latitude, climate and season( Reference Allen, de Benoist and Dary 27 ). The goal of the present paper is to provide important information on the seasonal variation of vitamin D status in different regions of Iran and to determine if these changes are accompanied by corresponding variations in anthropometric as well as blood lipid components of children. To do this, a longitudinal study on a sample of apparently healthy children across a broad latitudinal range in Iran was conducted.
Participants and methods
The participants were part of the study population of the National Food and Nutrition Surveillance Program (NFNSP), a population-based study to examine and monitor the nutritional status of the Iranian population.
In total, 530 (51·5 % girls, 48·5 % boys) apparently healthy children aged 5–18 years were randomly selected from the registered population, and stratified for age and gender, from six regions of Iran with a latitudinal gradient from 29°N to 37·5°N. They included (latitude, longitude): West Azarbaijan (province 1: 37·5°N, 45·0°E), Semnan (province 2: 35·5°N, 53·3°E), Lorestan (province 3: 33·4°N, 48·3°E), South Khorasan (province 4: 32·8°N, 59·2°E), Khoozestan (province 5: 31·3°N, 48·6°E) and Fars (province 6: 29·6°N, 52·5°E).
None of the children had a history of hepatic or renal disorders and none were taking vitamin D supplements or medications affecting vitamin D metabolism such as anticonvulsants or corticosteroids. All children provided written informed consents and all questionnaires and procedures were approved by the Ethical Committee of the National Nutrition and Food Technology Research Institute (NNFTRI). All children were visited twice during a year, summer (August–September) and winter (February–March).
Questionnaires
Demographic data were obtained by face-to-face interview and completing the questionnaires. Two different measures were used to express the usual sun exposure habits: (i) the duration of direct sun exposure during typical days, dichotomized as <1 h/d and >1 h/d; and (ii) the time of day of sun exposure, dichotomized as 10.00–15.00 hours (the peak time of solar UV radiation reaching the Earth) and other times of day( Reference Chen, Chimeh and Lu 28 ).
Anthropometrics
Height was measured using a wall-mounted stadiometer accurate to the nearest 0·1 cm, and weight was measured while participants were wearing light clothing and no shoes with a digital scale accurate to the nearest 0·1 kg. Both instruments were calibrated daily. BMI was defined as [weight (kg)]/[height (m)]2. Overweight and obesity were categorized using BMI-for-age Z-score (BMIZ): overweight, BMIZ=+1 to +2; obesity, BMIZ >+2.
Laboratory investigations
Blood samples, drawn in the morning (08.00–10.00 hours) after an overnight fast, were centrifuged at room temperature for 10 min at 800 g to separate sera, which were then aliquoted and stored immediately at −80°C until the day of analysis.
Total cholesterol, TAG, LDL cholesterol and HDL cholesterol concentrations were measured using enzymatic methods (Pars-Azmoon, Tehran, Iran) and an auto-analyser (Selecta E; Vitalab, Holliston, the Netherlands). High BMI (BMIZ>+1), low HDL cholesterol (<40 mg/dl in males and <50 mg/dl in females) and high TAG (>150 mg/dl) were considered cardiometabolic risk factors.
Serum concentrations of 25(OH)D were determined by a direct ELISA method (DIAsource ImmunoAssays, Louvain-la-Neuve, Belgium). According to the manufacturer, the intra- and inter-assay CV were 2·5–7·8 % (for values 13·7–203 nmol/l) and 4·3–9·2 % (for values 44·25–213·7 nmol/l), respectively. Considering the importance of comparability of 25(OH)D assay results in future studies( Reference Calvo and Lamberg-Allardt 29 ), the accuracy of 25(OH)D concentration measurements was ensured using HPLC( Reference Neyestani, Gharavi and Kalayi 30 ) in the Laboratory of Nutrition Research, NNFTRI, that has been participating in the Vitamin D External Quality Assessment Scheme (DEQAS) since 2012. Calibrated systems and control sera were also employed as the main steps of standardization of the 25(OH)D assay( Reference Sempos, Betz and Camara 31 ).
Vitamin D status was defined based on serum concentrations of 25(OH)D as follows: vitamin D deficiency, 25(OH)D <25 nmol/l; vitamin D insufficiency, 25(OH)D=25–50 nmol/l; and optimal status, 25(OH)D >50 nmol/l( Reference Nikooyeh, Neyestani and Farvid 11 , Reference Vieth, Chan and MacFarlane 32 ).
Statistical analyses
Continuous variables were expressed as mean and sd; categorical variables as frequencies and percentages. Normality of distribution was checked for all variables using the Kolmogorov–Smirnov test. Tests for differences in continuous variables among latitudes were performed using ANOVA or the Kruskal–Wallis test. Significant differences for categorical variables were determined by the χ 2 test. Comparisons of change of variables between summer and winter were made by the paired t test or Wilcoxon’s test, as appropriate. A two-way ANOVA was conducted to examine the effect of latitude (>33°N v. <33°N) and gender (boys v. girls) on change in 25(OH)D between summer and winter. Two-way multivariate ANOVA was used to assess the effect of latitude and gender on the combined change in BMI and lipid profile variables. Pearson’s correlation coefficient and multiple linear and logistic regression analysis were used to assess relationships between variables. A two-tailed P<0·05 was considered significant. Analyses were conducted using the statistical software package IBM SPSS Statistics for Windows, version 21.0.
Results
Study population
General characteristics of the study population are presented in Table 1. At the beginning of the study, the mean of age of children was 11 (sd 4) years. No age difference was found between boys and girls (11 (sd 4) v. 11 (sd 4) years; P=0·24).
Table 1 Comparison of serum 25-hydroxyvitamin D (25(OH)D), lipid profile and duration of sun exposure between summer and winter in boys, girls and the total sample: 530 apparently healthy children aged 5–18 years from six Iranian provinces with a latitudinal gradient from 29°N to 37·5°N (summer, August–September; winter, February–March)

TC, total cholesterol; LDL-C, LDL cholesterol; HDL-C, HDL cholesterol.
Vitamin D status
Mean serum 25(OH)D showed a between-season variation, with significantly higher concentration in summer than in winter (43·2 (sd 29·2) v. 27·4 (sd 18·0) nmol/l; P<0·001). Both serum concentration in winter and the summer rise of 25(OH)D were higher in boys than in girls (winter: 31·0 (sd 16·1) v. 24·2 (sd 18·2) nmol/l; P<0·001; summer rise: +19·0 (sd 25·0) v. +11·5 (sd 20·4) nmol/l; P<0·001; Table 1).
Vitamin D status in latitudes below and above 33°N is shown in Table 2. Two-way ANOVA was performed to examine the effect of latitude (>33°N v. <33°N) and gender (boys v. girls) on change in 25(OH)D between summer and winter. It was shown that change in 25(OH)D concentration was significantly associated with both latitude (19·0 (sd 19·0) nmol/l in <33°N v. 13·1 (sd 31·0) nmol/l in >33°N; P=0·02) and gender (19·3 (sd 28·0) nmol/l in boys v. 12·0 (sd 25·0) nmol/l in girls; P<0·001). No significant interaction between latitude and gender was found (P=0·06).
Table 2 Comparison of vitamin D status by latitude and season, and by season among the total sample: 530 apparently healthy children aged 5–18 years from six Iranian provinces with a latitudinal gradient from 29°N to 37·5°N (summer, August–September; winter, February–March)

* Vitamin D status was defined based on serum 25-hydroxyvitamin D (25(OH)D) concentration as: deficiency, 25(OH)D ≤25 nmol/l; insufficiency, 25(OH)D=25–50 nmol/l; sufficiency, 25(OH)D >50 nmol/l.
During winter and summer, 36·2 and 46·2 % of the children reported outdoor sun exposure for >1 h/d, respectively. The children who had outdoor sun exposure for >1 h/d in summer, as compared with those with less solar exposure, had higher serum 25(OH)D concentration (48·0 (sd 30·0) v. 38·1 (sd 27·1) nmol/l; P<0·001).
A very high percentage of the children had circulating 25(OH)D concentration below 50 nmol/l during winter (93·4 %); this decreased in summer (71·7 %), although the prevalence of hypovitaminosis D was still remarkable. Vitamin D deficiency (25(OH)D <25 nmol/l) was detected in 71·2 % of girls and 41·7 % of boys in winter and 39·1 % of girls and 11·2 % of boys in summer (Fig. 1). In fact, 24·3 % of children who had suboptimal vitamin D status in the winter were in the sufficient vitamin D category in summer.
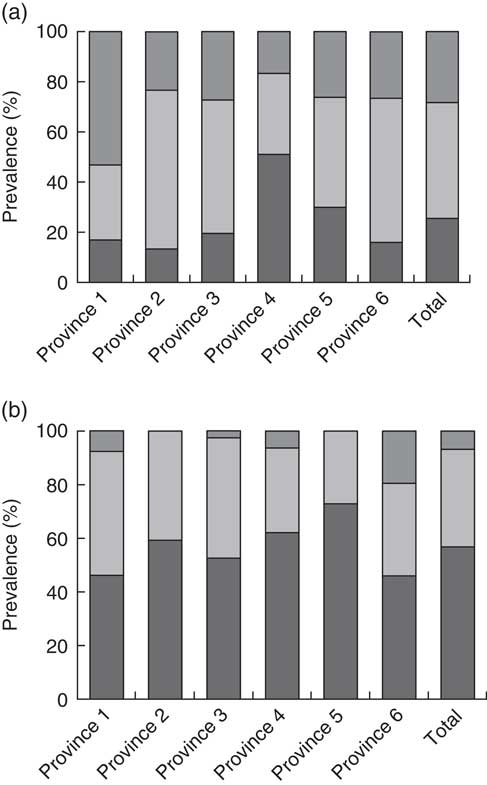
Fig. 1 Prevalence of vitamin D deficiency (![]() ; 25-hydroxyvitamin D (25(OH)D) ≤25 nmol/l), insufficiency (
; 25-hydroxyvitamin D (25(OH)D) ≤25 nmol/l), insufficiency (![]() ; 25(OH)D=25–50 nmol/l) and sufficiency (
; 25(OH)D=25–50 nmol/l) and sufficiency (![]() ; 25(OH)D >50 nmol/l) in 530 apparently healthy children aged 5–18 years from six Iranian provinces with a latitudinal gradient from 29°N to 37·5°N: (a) summer (August–September) and (b) winter (February–March)
; 25(OH)D >50 nmol/l) in 530 apparently healthy children aged 5–18 years from six Iranian provinces with a latitudinal gradient from 29°N to 37·5°N: (a) summer (August–September) and (b) winter (February–March)
Anthropometry and lipid profile
About 2·4 and 3·9 % of children had height-for-age Z-score (HAZ)<−2 in summer and winter, respectively (Table 3). There was a significant increase in HAZ in summer, as compared with winter (0·6 (sd 1·2) v. 0·22 (sd 1·2); P<0·001). The change in circulating 25(OH)D concentration between summer and winter was negatively correlated with the change in BMI (r=−0·16; P<0·001), TAG (r=−0·09; P=0·04) and total cholesterol (r=−0·10; P=0·02) and directly correlated with the change in HAZ (r=0·09; P=0·04).
Table 3 Comparison of the occurrence of stunting, underweight, overweight and obesity between summer and winter in boys, girls and the total sample: 530 apparently healthy children aged 5–18 years from six Iranian provinces with a latitudinal gradient from 29°N to 37·5°N (summer, August–September; winter, February–March)

HAZ, height-for-age Z-score; BMIZ, BMI-for-age Z-score.
According to BMIZ, 20·5 and 20·2 % of the children were overweight/obese in winter and summer, respectively (Table 3). In summer, the overweight/obese children had 2·5 times higher risk of having undesirable vitamin D status (serum 25(OH)D <50 nmol/l) than the normal-weight children (OR=2·54; P=0·001).
Among blood lipid profile components, only HDL cholesterol showed a seasonal variation (P<0·001) with no gender difference (Table 1). However, only in summer was circulating 25(OH)D inversely correlated with serum total cholesterol (r=−0·18; P<0·001) and LDL cholesterol (r=−0·12; P=0·01). The prevalence of undesirable serum HDL cholesterol concentration was 27·4 and 31·7 % in summer and winter, respectively.
The results showed that 43·8 and 36·7 % of children had at least one of the predefined cardiometabolic risk factors in winter and summer, respectively, and this prevalence was significantly higher in winter compared with summer (P<0·001). Moreover, about 10 % of children had a combination of two cardiometabolic risk factors. Figure 2 summarizes the change in undesirable vitamin D status and cardiometabolic risk factors between the two seasons among the studied children.
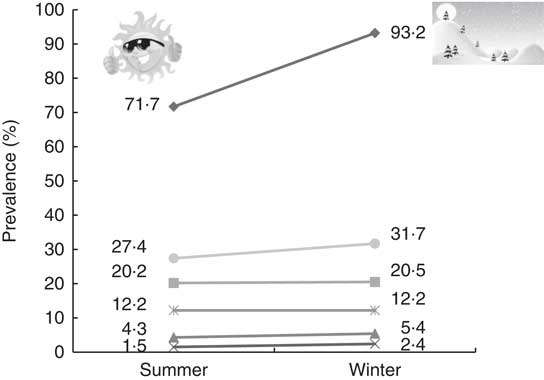
Fig. 2 The annual trend of change in undesirable vitamin D status and cardiometabolic risk factors (![]() , poor vitamin D status;
, poor vitamin D status; ![]() , high BMI;
, high BMI; ![]() , high TAG;
, high TAG; ![]() , high total cholesterol;
, high total cholesterol; ![]() , high LDL cholesterol;
, high LDL cholesterol; ![]() , low HDL cholesterol) among 530 apparently healthy children aged 5–18 years from six Iranian provinces with a latitudinal gradient from 29°N to 37·5°N (summer, August–September; winter, February–March)
, low HDL cholesterol) among 530 apparently healthy children aged 5–18 years from six Iranian provinces with a latitudinal gradient from 29°N to 37·5°N (summer, August–September; winter, February–March)
Predictors of 25-hydroxyvitamin D concentration
In linear regression, the duration of sun exposure after adjusting for gender was found to be a significant predictor of serum 25(OH)D concentration in summer (β=5·2; 95 % CI 0·2, 10·2; P=0·04). The preference for sun exposure when outside led to an increase of about 21 % in circulating 25(OH)D in summer. However, after stratification by latitude (>33°N and <33°N), duration of sun exposure was a predictor only in children living in regions with latitude <33°N (β=7·9; 95 % CI 0·5, 15·3; P=0·04).
Logistic regression analysis revealed that in winter, the risk of having serum 25(OH)D <50 nmol/l increased about twofold by being a girl (OR=2·2; 95 % CI 1·05, 4·63; P=0·04) and decreased by about 50 % with exposure to the sun at 10.00–15.00 hours v. other times of the day (OR=0·5; 95 % CI 0·22, 0·99; P=0·04). In summer, gender (girls v. boys: OR=3·2; 95 % CI 2·1, 5·0; P<0·001), duration of direct sun exposure (>1 h/d v. <1 h/d: OR=0·6; 95 % CI 0·4, 0·94; P=0·03) and BMI status (overweight/obese v. normal weight; OR=1·8; 95 % CI 1·2, 2·6; P=0·002) were the important predictors of having undesirable vitamin D status (serum 25(OH)D <50 nmol/l).
Multiple stepwise linear regression analysis was performed with change in serum 25(OH)D as the dependent variable and gender, age, latitude and winter concentration of serum 25(OH)D as independent variables. The final model predicting 25(OH)D included winter serum 25(OH)D concentration (β=−0·3; 95 % CI −0·4, −0·2; P<0·001), gender (boys v. girls: β=9·7; 95 % CI 5·2, 14·1; P<0·001) and latitude (>33°N v. <33°N: β=4·5; 95 % CI 0·09, 9·0; P=0·045) as statistically significant parameters.
Basal serum 25(OH)D was inversely correlated with the seasonal change in serum 25(OH)D (r=−0·16; P<0·001). Summer rise in serum 25(OH)D among the children with vitamin D sufficiency (25(OH)D >50 nmol/l) was negligible, whereas among those with undesirable vitamin D status (25(OH)D <50 nmol/l) the summer rise was significant (0·5 (sd 33·0) v. 16·1 (sd 22·0) nmol/l; P=0·01).
Discussion
To our knowledge, the present study is the first to report seasonality of vitamin D status of children in six locations in Iran covering a latitudinal gradient. Our results showed a very high prevalence of hypovitaminosis D in Iranian children of both genders residing in latitudes of 29–37°N of Iran, all year round.
Several studies have demonstrated low serum 25(OH)D concentrations in children across the world. Ninety-two per cent of healthy 9–12-year-old schoolchildren in Iran( Reference Neyestani, Hajifaraji and Omidvar 12 ), 76 % of 12–59-month-old Jordanian children( Reference Nichols, Khatib and Aburto 33 ), 19·5 % of 6–8-year-old Finnish children( Reference Soininen, Eloranta and Lindi 34 ) and 40 % of 3–17-year-old Turkish children( Reference Erol, Yigit and Kucuk 35 ) were reported to have circulating 25(OH)D concentration lower than 50 nmol/l. Although vitamin D deficiency during childhood does not necessarily extend through adolescence and adulthood, it may exert deleterious effects on the affected child.
We found no significant association of 25(OH)D status with age, while male gender was a predictor of higher 25(OH)D concentration in both seasons. Higher vitamin D status in boys, compared with girls, has been reported previously( Reference Neyestani, Hajifaraji and Omidvar 12 ). Data from the US National Health and Nutrition Examination Survey (NHANES) 2003–2004 showed that, with the exception of children aged 1–5 years, females had greater risk of suboptimal 25(OH)D concentration than males( Reference Yetley 36 ). Gender-specific clothing differences in outdoor activities as well as percentage of body fat( Reference Neyestani, Hajifaraji and Omidvar 12 , Reference Moore and Liu 37 , Reference Moore and Liu 38 ) can be suggested as explanations for the gender difference in vitamin D status of children.
Our data showed that direct sun exposure for more than 1 h in a typical summer day is a predictor of sufficient vitamin D status. However, despite higher concentration of circulating 25(OH)D during summer, prevalence of undesirable vitamin D status was still remarkable (62·6 %). Surprisingly, suboptimal vitamin D status was common even among children residing in sunny regions like Khoozestan (province 5: latitude 31·3°N, longitude 48·6°E) and Fars (province 6: latitude 29·6°N, longitude 52·5°E), possibly due to avoidance of direct sun exposure. Considering the potential hazards of UV radiation, the most fundamental message has been avoidance of needless sunlight exposure and usage of physical means of sun protection, particularly during midday hours( 39 ). This suggests that not only environmental conditions, but also individual sun behaviours and type of clothing could determine the vitamin D status of children( Reference van der Mei, Ponsonby and Engelsen 40 – Reference Holick 42 ). Besides, for individuals residing at latitudes far from the equator, the summer accumulation of vitamin D stores could not be adequate to maintain optimal levels of circulating 25(OH)D( Reference Kull, Kallikorm and Tamm 7 ). Using data from three cohort studies, the main predictors of serum 25(OH)D were reported as race, UVB flux, BMI, physical activity and season of blood sampling. In general, the predictive models developed in that study could explain 25–33 % of the variation in circulating 25(OH)D concentrations( Reference Bertrand, Giovannucci and Liu 43 ). In contrast, the current study revealed that the effect of sun exposure on vitamin D status of children could be significant only at latitudes lower than 33°N.
The reports of an association between latitude and vitamin D status have not been consistent. It is expected that living in a low-latitude region is accompanied by higher serum 25(OH)D concentration due to more suitable conditions for dermal vitamin D biosynthesis( Reference Mithal, Wahl and Bonjour 13 ). Some studies, including ones from Argentina( Reference Oliveri, Plantalech and Bagur 44 ), Australia( Reference van der Mei, Ponsonby and Engelsen 40 ) and China( Reference Wat, Leung and Tam 45 ), endorsed this notion. However, a meta-analysis of 394 studies demonstrated a significant decline in 25(OH)D concentration with increasing latitude just in healthy, white subjects and not in other race/ethnicities( Reference Hagenau, Vest and Gissel 46 ). Population-based studies should, therefore, assess individual-specific sun exposure when possible instead of relying on region of residence( Reference Millen and Bodnar 47 ).
High occurrence of at least one of the predefined cardiometabolic risk factors among the studied children is noteworthy. The importance of this finding lies in the fact that CVD in adulthood originates in the early years of childhood( Reference Kavey, Daniels and Lauer 48 ).
We found a significant association between change in circulating 25(OH)D and change in BMI among the studied children. An inverse association of serum 25(OH)D concentration with BMI in children is well established( Reference Neyestani, Hajifaraji and Omidvar 12 , Reference Gagnon, Baillargeon and Desmarais 49 , Reference Prakash, Mehta and Dabhi 50 ). Although little is known about the association between low 25(OH)D concentration and adiposity, it has been suggested that entrapment of vitamin D in fat cells reduces its bioavailability( Reference Wortsman, Matsuoka and Chen 51 ).
One of the interesting findings of the current study was that physiological elevation of serum 25(OH)D concentration during summer was accompanied by a decrement in serum TAG, LDL cholesterol, total cholesterol and BMI in the children. Along the same line of evidence, a study on 8–11-year-old Danish children showed an inverse association between vitamin D status and certain cardiometabolic markers, including blood pressure, serum lipid profile and metabolic syndrome score, independent of body fat and physical activity( Reference Petersen, Dalskov and Sørensen 52 ). The association between serum 25(OH)D and lipid profile has been reported in some previous studies( Reference Jorde and Grimnes 53 , Reference Jorde, Figenschau and Hutchinson 54 ), but the results are not consistent. Only a few studies have examined the relationship between vitamin D and lipid profile in children( Reference Nikooyeh, Abdollahi and Hajifaraji 55 , Reference Liu, Xian and Min 56 ).
The seasonality of vitamin D status and its effects on cardiometabolic risk factors imply that keeping the vitamin D status of children adequate throughout the year, through a nationally regulated vitamin D fortification programme, could serve as a cost-effective measure against development of non-communicable diseases later in life. The strong case for vitamin D fortification is supported by studies demonstrating the efficacy of daily consumption of fortified bread, milk and orange juice in healthy adults and children( Reference Nikooyeh, Neyestani and Zahedirad 57 , Reference Neyestani, Hajifaraji and Omidvar 58 ). The other important health aspects of vitamin D seasonality relate to higher oxidative stress and immune alterations due to lower vitamin D status and resulting increased susceptibility to infections( Reference Nikooyeh and Neyestani 59 ). Some studies have reported an association between poor vitamin D status and urinary tract and respiratory as well as skin or soft tissue infections in children( Reference McNally, Leis and Matheson 60 – Reference Ovunc Hacihamdioglu, Altun and Hacihamdioglu 64 ).
The strengths of the present study include the large sample size and coverage of a rather broad latitudinal range, with fairly good distribution across the country. Serum 25(OH)D assay results were checked using the HPLC method as an attempt to harmonize the results( Reference Nikooyeh, Samiee and Farzami 65 ). However, some limitations must be acknowledged. First, we used no direct measures of the time spent in the sun or the actual intake of vitamin D from foods. It is noteworthy that despite decades of assessing sunlight exposure, no validated sunlight questionnaires exist( Reference McCarty 66 ). Moreover, no dietary intake assessment to determine the contribution of food sources of vitamin D to circulating 25(OH)D was performed. However, our previous studies demonstrated that the contribution of dietary intake of vitamin D to serum 25(OH)D is probably negligible because the typical Iranian diet is poor in naturally occurring vitamin D( Reference Nikooyeh, Neyestani and Farvid 11 , Reference Neyestani, Gharavi and Kalayi 67 ).
Conclusion
In conclusion, seasonality of vitamin D status is accompanied by corresponding changes in certain cardiometabolic risk factors in children. Therefore, it is likely that measurements from June to September may camouflage vitamin D as well as blood lipid problems at other times of the year. These findings support the urgent need for the national vitamin D fortification programme proposed by the Ministry of Health in Iran. Improvement of vitamin D status of the population through such community-based interventions as fortification could potentially bring about many health benefits beyond bone health. Several studies have documented the reduction of burden of disease and all-cause mortality via increasing serum concentrations of calcidiol( Reference Grant, Schwalfenberg and Genuis 68 – Reference Grant 70 ). Enhanced responsiveness of children to vaccination due to raised circulating 25(OH)D is another issue that must be addressed in future studies( Reference Sadarangani, Whitaker and Poland 71 ).
Acknowledgements
Acknowledgements: All of the laboratory benchwork was conducted at the Laboratory of Nutrition Research, NNFTTRI. The authors wish to thank the children and their parents for taking part in this project. They also appreciate the provincial contributors, their teams and the provincial deputies of health for their assistance, especially: Somayeh Asghari, Fariba Babai, Fariboz Bojdi, Mostafa Hosseini, Razieh Shenavar, Mahnoosh Sahebdel, Maasoomeh Moradi and Sekine Noori. Financial support: This research received no specific grant from any funding agency in the public, commercial or not-for-profit sectors. Conflict of interest: None of the authors declared a conflict of interest. Authorship: T.R.N., B.N. and Z.A. designed and supervised the study. T.R.N. and B.N. were involved in all stages of the research, including all laboratory benchwork. H.A.-M. supervised the estimation of the sample size and the statistical analyses. M.H., A.H.Y. and F.S. were involved in fieldwork arrangements and data acquisition. Ethics of human subject participation: This study was conducted according to the guidelines laid down in the Declaration of Helsinki and all procedures involving human subjects were approved by the Ethical Committee of the NNFTRI. Verbal consent was witnessed and formally recorded.


