


Low physical activity (PA) is an important and modifiable risk factor for CVD and obesity(Reference Sesso, Paffenbarger and Lee1, Reference Lee and Paffenbarger2). Like other CVD risk factors, there is some evidence that PA is influenced by genetic factors. Heritability estimates for PA from studies of twins range from 30 % to 83 %(Reference Maia, Thomis and Beunen3–Reference Wolfarth, Bray, Hagberg, Pérusse, Rauramaa, Rivera, Roth, Rankinen and Bouchard7). In studies examining nuclear and extended families these estimates are typically lower, ranging from 9 % to 57 %(Reference Mitchell, Rainwater, Hsueh, Kennedy, Stern and Maccluer8–Reference Cai, Cole, Butte, Bacino, Diego, Tan, Goring, O’Rahilly, Farooqi and Comuzzie10).
Despite studies showing genetic effects on PA, associations between PA and obesity have not been examined at the genetic level. In many genetic studies of PA, obesity (typically BMI) is treated as a covariate, or the effect of obesity is regressed out at the phenotypic level. Conversely, many genetic studies of obesity (justifiably) include PA as a covariate(Reference Mitchell, Rainwater, Hsueh, Kennedy, Stern and Maccluer8, Reference Pérusse, Tremblay, Leblanc and Bouchard9). Interestingly, candidate gene association studies and quantitative trait linkage studies of obesity and PA traits have identified several chromosomal regions in common(Reference Wolfarth, Bray, Hagberg, Pérusse, Rauramaa, Rivera, Roth, Rankinen and Bouchard7, Reference Cai, Cole, Butte, Bacino, Diego, Tan, Goring, O’Rahilly, Farooqi and Comuzzie10–Reference Rankinen, Zuberi, Chagnon, Weisnagel, Argyropoulos, Walts, Pérusse and Bouchard17). For example, quantitative trait loci related to obesity on chromosomes 11q23 and 18q22(Reference Chagnon, Chen, Pérusse, Chagnon, Nadeau, Wilkison and Bouchard11, Reference Comings, Flanagan, Dietz, Muhleman, Knell and Gysin13, Reference Norman, Thompson, Foroud, Garvey, Bennett, Bogardus and Ravussin15, Reference Rankinen, Zuberi, Chagnon, Weisnagel, Argyropoulos, Walts, Pérusse and Bouchard17) have also been implicated in genetic linkage analyses of PA(Reference Wolfarth, Bray, Hagberg, Pérusse, Rauramaa, Rivera, Roth, Rankinen and Bouchard7, Reference Cai, Cole, Butte, Bacino, Diego, Tan, Goring, O’Rahilly, Farooqi and Comuzzie10, Reference Loos, Rankinen, Tremblay, Pérusse, Chagnon and Bouchard12, Reference Simonen, Rankinen, Pérusse, Leon, Skinner, Wilmore, Rao and Bouchard14, Reference Rankinen, Bray, Hagberg, Pérusse, Roth, Wolfarth and Bouchard16). Identifying common genetic pathways between PA and obesity would provide insight into how and why PA is related to obesity and diabetes, and may lead to better strategies for weight maintenance and improving cardiovascular health(Reference Bassuk and Manson18–Reference Ford, Williamson and Liu20).
Few studies to date have directly examined the genetic relationship between adiposity and PA. In a study of Finnish twin males(Reference Simonen, Levälahti, Kaprio, Videman and Battié5), percentage body fat (%BF) was associated with PA at the genetic level. However, there were several limitations to that study, chief among them being that the results could not be extended to singletons, who comprise the majority of births. Instead, examining PA levels in adults from large extended families who live in many different households allows for the separate influences of genetic and shared household effects on PA level to be estimated. Using different domains of PA (e.g. sport, leisure and work activity) as they relate to adiposity may also help to resolve conflicting results concerning the inheritance of PA levels and its relationship to obesity. Moreover, including MRI measures of visceral adipose tissue, which may be more closely related to PA levels than total adiposity(Reference Lee, Kuk, Davidson, Hudson, Kilpatrick, Graham and Ross21), may help in investigations of obesity and PA. Using an extended pedigree design, the purposes of the present study were to: (i) to examine to what extent genetic and household effects influence PA; and (ii) determine the extent to which PA and adiposity traits share genetic and common household effects.
Materials and methods
The Southwest Ohio Family Study
The Southwest Ohio Family Study(Reference Siervogel, Frey, Kezdi, Roche and Stanley22–Reference Choh, Czerwinski, Lee, Demerath, Cole, Wilson, Towne and Siervogel24) is a genetic epidemiological study of CVD risk factors, and comprises five large multi-generational families (one predominantly African American and four predominantly European American) from the Dayton, Ohio area. Participants were originally recruited for a National Institutes of Health-funded genetic study of blood pressure and CVD risk in the late 1970s. Initially, each family was ascertained on a single male proband aged 35–58 years with essential hypertension. Family members of these five men were recruited for participation regardless of hypertensive status. Given the large family size and the small number of probands, adjustment for ascertainment was not performed. The current phase of data collection began in 2003 and includes numerous measures of CVD risk, including self-reported PA. Data collected during the current phase of the study were analysed for the present paper. The Southwest Ohio Family Study was approved by the Institutional Review Board of Wright State University and informed consent was obtained from the participants.
Study sample
The study sample consisted of a subset of 521 (219 males, 302 females) adults from the Southwest Ohio Family Study whose visits occurred between January 2003 and November 2006. Participants ranging in age from 18 to 86 years had data for PA, adiposity traits measured through MRI and dual-energy X-ray absorptiometry (DEXA), and covariates such as tobacco use. Of the 521 participants, 423 were of European descent, while ninety-eight were African American.
Pedigree and household structure
The five families in the study contained between forty-seven and 188 individuals, with a mean family size of 104 and median family size of ninety. In all, there were a total of 18 295 relative pairings of varying degrees of relationship to one another that contributed familial information to the analyses. There were 652 first-degree relative pairs, 741 second-degree relative pairs, 1369 third-degree relative pairs and 2723 fourth-degree relatives. The remaining 12 810 relative pairs were fifth-degree relatives or higher. Among these pair-wise relationships, at least four generations were represented. Current residential address was used to define households for the determination of shared household effects.
Physical activity
PA was assessed using the Baecke Questionnaire of Habitual Physical Activity(Reference Baecke, Burema and Frijters25). The Baecke questionnaire is a sixteen-question form that delineates PA into work (work PA), sport (sport PA) and non-sports leisure (leisure PA) indices. Each activity consists of questions scored mostly on a 5-point, sometimes a 3-point, Likert scale with higher scores indicating greater PA levels. Questions related to sitting, standing, walking, lifting, sweating during work hours and occupation are incorporated into the work index, while questions related to sport PA include the type of sport, how often participants engage in it and how much they sweat while they do so. Leisure PA is based on questions regarding mode of transportation to school and work, television watching, walking and cycling. Total activity is the sum of the three indices(Reference Baecke, Burema and Frijters25).
The sport PA index incorporates questions related to energy expenditure. The first question (question 9) of the sport PA index is an estimate of energy expenditure (EE) from sport activities(Reference Baecke, Burema and Frijters25, Reference Durnin and Passmore26). The estimated EE is then converted into a 5-point Likert score. This value and three additional sport PA-related questions (questions 10–12) are averaged to get the sport PA index, which ranges from 1 to 5(Reference Baecke, Burema and Frijters25).
The Baecke questionnaire has been repeatedly validated against accelerometer measures of activity EE(Reference Miller, Freedson and Kline27, Reference Philippaerts, Lefevre, Delvaux, Thomis, Vanreusel, Vanden Eynde, Claessens, Lysens and Beunen28), doubly labelled water measures of total EE(Reference Bonnefoy, Normand, Pachiaudi, Lacour, Laville and Kostka29, Reference Philippaerts, Westerterp and Lefevre30) and other activity questionnaires(Reference Pereira, FitzerGerald, Gregg, Joswiak, Ryan, Suminski, Utter and Zmuda31, Reference Richardson, Ainsworth, Wu, Jacobs and Leon32). The strongest correlation between EE measured through doubly labelled water and Baecke questionnaire sub-indices was for sport PA (r = 0·55)(Reference Bonnefoy, Normand, Pachiaudi, Lacour, Laville and Kostka29). The instrument is also reported to be highly reliable, both over short- and long-term periods, with correlations ranging from 0·86–0·95 for a 1-month period(Reference Philippaerts and Lefevre33) to 0·65–0·84 for an 11-month period(Reference Pols, Peeters, Bueno-De-Mesquita, Ocke, Wentink, Kemper and Collette34).
Adiposity measurements and other covariates
Abdominal adipose tissue was assessed using MRI. MR images were obtained using a Magnetom Vision 1·5 Tesla whole-body scanner (Siemens, Mississauga, Canada). Contiguous, 1 cm thick axial images were acquired across the entire abdominal region (T9–S1). Adipose tissue areas within each image were identified and tagged by trained technicians using Slice-O-Matic software version 4·2 (Tomovision Inc., Montreal, Canada). Adipose tissue areas were summed across all images to obtain volumes and then converted into abdominal visceral (VAT) and subcutaneous (SAT) adipose tissue mass (kg) by multiplying the volumes by the density of adipose tissue (0·916). More details regarding the MRI protocols have been given elsewhere(Reference Demerath, Shen, Lee, Choh, Czerwinski, Siervogel and Towne35, Reference Demerath, Ritter and Couch36).
Weight (kg) and height (cm) were measured using standard protocols(Reference Lohman, Roche and Martorell37). BMI was calculated as weight (kg)/height2 (m2). Total body fat mass (BFM, kg) and trunk fat mass (TFM, kg) were measured using a Hologic 4500E DEXA instrument (Hologic Inc., Waltham, MA, USA). Total %BF was calculated as BFM/weight × 100. BFM, TFM, VAT and SAT were also adjusted for height by dividing by height2 (m2), to obtain fat mass index (FMI), trunk fat index (TFMI), visceral fat index (VFI) and subcutaneous fat index (SFI), respectively. Height2 was used so that the indices were on the same scale as BMI(Reference VanItallie, Yang, Heymsfield, Funk and Boileau38).
Covariates included age, sex, self-reported race, current smoking status and educational attainment. Current smokers were individuals who were smoking a pipe, cigars or cigarettes at the time of their visit. Males, African Americans, non-smokers and participants with less than a university education were treated as the reference groups.
Statistical analysis
PA and adiposity traits were treated as continuous variables and all dependent variables were normalized by either log or square root transformations where necessary. Phenotypic partial correlations adjusting for age, sex, age2, age-by-sex, age2-by-sex, race, race-by-sex, smoking and university education(Reference Demerath, Shen, Lee, Choh, Czerwinski, Siervogel and Towne35, Reference Elia39–Reference Flegal and Troiano41) were estimated between measures of PA and adiposity traits using the Statistical Analysis System statistical software package version 9·1 (SAS Institute, Cary, NC, USA).
Quantitative genetic analysis
Quantitative traits are influenced by sources that may be genetic, environmental and/or interactions between the two. Genetic epidemiological methods are used to determine and characterize the effects of (many) genes influencing variation in complex phenotypes. The heritability of a trait is simply the proportion of the phenotypic variation attributable to additive genetic variation and is given by ![]() , where
, where ![]() is the variance due to additive effects of genes and
is the variance due to additive effects of genes and ![]() is the phenotypic variance(Reference Falconer and Mackay42, Reference Hartl and Clark43). This relationship is derived from the same variance components methods used by Fisher(Reference Fisher44) to develop linear regression and analysis of variance methods. Heritabilities are squared correlation coefficients (R 2)(Reference Lynch and Walsh45).
is the phenotypic variance(Reference Falconer and Mackay42, Reference Hartl and Clark43). This relationship is derived from the same variance components methods used by Fisher(Reference Fisher44) to develop linear regression and analysis of variance methods. Heritabilities are squared correlation coefficients (R 2)(Reference Lynch and Walsh45).
Maximum likelihood variance decomposition methods were used to estimate heritability (h 2) and household effects (c 2) for each study trait using procedures implemented in SOLAR version 4 (Southwest Foundation for Biomedical Research, San Antonio, TX, USA)(Reference Almasy and Blangero46). Heritabilities were estimated for each PA trait (i.e. sport, leisure, work PA) and for the obesity-related traits that represented overall adiposity (weight, BMI, BFM, %BF) and central adiposity (TFM, VAT, SAT). For continuously distributed quantitative traits, the covariance matrix for a pedigree is given by:
where Φ is the n × n matrix of kinship coefficients that structures ![]() ; H is a matrix that structures
; H is a matrix that structures ![]() , the variance due to common household effects; and I is an identity matrix of order n that serves as the structuring matrix for
, the variance due to common household effects; and I is an identity matrix of order n that serves as the structuring matrix for ![]() , the variance due to residual environmental factors(Reference Almasy and Blangero46).
, the variance due to residual environmental factors(Reference Almasy and Blangero46).
The trait mean and mean effects of age, sex, age2, age-by-sex, age2-by-sex, race, race-by-sex, smoking and education were also estimated for each trait. Significance of h 2 and c 2 (P < 0·05) was determined using the likelihood ratio test(Reference Edwards47) by comparing the log-likelihood of the general model, where h 2 and c 2 were estimated, against models where either h 2 or c 2 was fixed to zero. Covariates were selected to determine the most parsimonious models and were tested for significance (P < 0·05) in a similar manner. Only significant covariates were retained in the model and used in the bivariate analyses.
Bivariate extensions(Reference Almasy, Dyer and Blangero48, Reference Williams, Van Eerdewegh, Almasy and Blangero49) of the univariate quantitative genetic procedure were used to obtain estimates of the additive genetic (ρ G) correlation as well as the common household correlation (ρ C) between the PA traits and obesity traits. The phenotypic covariance between two individuals for two traits is given by a 2 × 2 covariance matrix whose elements are defined as:
where ρ G is the additive genetic correlation between traits a and b, ρ C is the common environmental (household) correlation between the two traits, and ρ E is the unmeasured environmental correlation between the two traits(Reference Almasy, Dyer and Blangero48, Reference Hopper and Mathews50). In the bivariate analyses, only significant (P < 0·05) covariates in the univariate analysis were included in the model. For the bivariate analysis, if both traits did not have significant household effects, the c 2 terms and ρ C were not analysed. If one of the two traits had a significant c 2 term, each of the c 2 terms was estimated, but ρ C was fixed to zero. If both traits had significant household effects, then all parameters were estimated.
Significance of genetic, household and random environmental correlations was evaluated using the likelihood ratio test. Shared genetic or pleiotropic effects (i.e. |ρ G| > 0) and household effects (i.e. |ρ C| > 0) each were tested by comparing the log-likelihood of the general model to nested models where ρ G and ρ C were fixed to zero respectively. Models positing completely shared genetic effects (i.e. |ρ G| = 1, or complete pleiotropy) and completely shared household effects (i.e. |ρ C| = 1) were tested in a similar manner. Each was tested by fixing ρ G and/or ρ C to (positive or negative) 1 respectively, and comparing the log-likelihoods of the nested model to the general model. Genetic correlations that are statistically different from 0 and 1 (incomplete pleiotropy, 0 < |ρ G| < 1) indicate that some of the genetic effects are shared by both traits, but that each trait also has unique genetic effects influencing their phenotypic variation.
Results
Table 1 shows the descriptive statistics for the study sample. The mean age of the participants was 45 (sd 15·3) years. On average the participants were overweight (i.e. BMI ≥ 25 kg/m2) with participants having a mean BMI of 28·6 (sd 6·2) kg/m2.
Table 1 Descriptive statistics of the study sample: subset of adults from the Southwest Ohio Family Study whose visits occurred between January 2003 and November 2006

PA, physical activity; BFM, total body fat mass; %BF, percentage body fat; TFM, trunk fat mass; VAT, visceral adipose tissue; SAT, subcutaneous abdominal adipose tissue; BFMI, fat mass index; TFMI, trunk mass index; VFI, visceral fat index; SFI, subcutaneous fat index.
Data are presented as means with their standard deviation for continuous variables or as percentages and number of individuals for categorical variables (indicated by †).
Additive genetic and household effects
Table 2 shows the estimated parameters from the univariate analysis from the final model. Sport, leisure and total PA were significantly (P < 0·05) influenced by additive genetic effects (h 2), but only leisure PA was significantly influenced by a common household environment (c 2). Work PA was influenced neither by additive genetic effects nor by common household effects. Height was significantly influenced by additive genetic (h 2 = 0·82) and household effects (c 2 = 0·11). Adiposity traits were significantly heritable (h 2 = 0·35 to 0·47), but were not significantly influenced by common household effects.
Table 2 Final univariate estimates of heritability, trait means and covariate effects for physical activity and body composition traits, and their standard errors: subset of adults from the Southwest Ohio Family Study whose visits occurred between January 2003 and November 2006

Combined covariate effects accounted for between 0% and 20·6 % of the phenotypic variation in PA. Generally, covariate effects accounted for much more of the variation in the adiposity traits and height (13·3 % to 61·6 %) than for the variation in PA levels (Table 2). Leisure PA was not significantly influenced by any of the covariates analysed in the present study. Smokers had significantly lower sport PA than non-smokers. Higher education levels were significantly associated with lower work and higher sport PA. Males and younger individuals tended to have significantly higher sport PA than females and older participants, respectively.
Age influenced all adiposity traits, with increased age leading to higher levels of adiposity. Females had lower VAT and VFI (VAT adjusted by height2) than males but had higher levels of adiposity for the rest of the traits examined. Higher education was associated with lower adiposity levels. African Americans had lower VAT levels. For all adiposity variables, there was a significant race-by-sex interaction; thus the effect of race on adiposity traits is not consistent across the sexes. For example, white males had the highest levels of VAT. Among females, there was no race difference. These results have also been observed elsewhere(Reference Demerath, Shen, Lee, Choh, Czerwinski, Siervogel and Towne35, Reference Hoffman, Wang, Gallagher and Heymsfield51).
Phenotypic correlations
Partial phenotypic correlations adjusting for the same final covariates from the univariate analysis indicated that work PA was not associated with any of the adiposity traits (Table 3). Correlations between leisure PA and adiposity were significant (P < 0·05) but weak, ranging from r = −0·11 to −0·16, while sport PA was moderately and negatively associated with all adiposity traits examined (r = −0·23 to −0·32).
Table 3 Phenotypic correlations among physical activity scores and body composition traits adjusted for all covariates: subset of adults from the Southwest Ohio Family Study whose visits occurred between January 2003 and November 2006
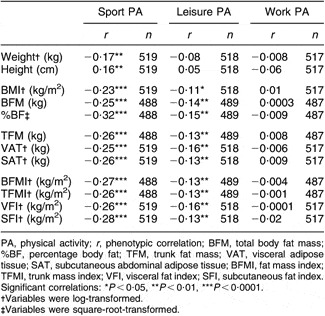
PA, physical activity; r, phenotypic correlation; BFM, total body fat mass; %BF, percentage body fat; TFM, trunk fat mass; VAT, visceral adipose tissue; SAT, subcutaneous abdominal adipose tissue; BFMI, fat mass index; TFMI, trunk mass index; VFI, visceral fat index; SFI, subcutaneous fat index.
Significant correlations: *P < 0·05, **P < 0·01, ***P < 0·0001.
†Variables were log-transformed.
‡Variables were square-root-transformed.
Genetic, household and environmental correlations
Table 4 shows the additive genetic correlations, the common household correlations and the random environmental correlations from the bivariate genetic analysis. Because work PA did not have a significant heritable component, it was not included in this analysis. Total PA also was not examined in the bivariate analyses because the different PA components (sport, leisure, work) had significantly different genetic and household effects and the underlying genetic effects from these sub-domains would be obscured by results for total PA.
Table 4 Bivariate analyses of physical activity and body composition traits: subset of adults from the Southwest Ohio Family Study whose visits occurred between January 2003 and November 2006

PA, physical activity; ρ G, genetic correlation; ρ C, household correlation; ρ E, random environmental residual correlation; BFM, total body fat mass; %BF, percentage body fat; TFM, trunk fat mass; VAT, visceral adipose tissue; SAT, subcutaneous abdominal adipose tissue; BFMI, fat mass index; TFMI, trunk mass index; VFI, visceral fat index; SFI, subcutaneous fat index.
*Significantly different from 0, i.e. shared genetic, household or environmental effects (P < 0·05).
†Variables were log-transformed.
‡Variables were square-root-transformed.
§No household terms were modelled because neither trait had a significant c 2 (i.e. both c 2 terms and ρ C were fixed to zero).
||Fixed at zero because one trait did not have significant household effects (c 2).
¶Significantly different from 0 and not significantly different from 1 (P < 0·05).
Significant (P < 0·05) negative genetic correlations (ρ G) were found between sport PA and %BF (ρ G = −0·46), VAT (ρ G = −0·46), TFMI (ρ G = −0·42), VFI (ρ G = −0·47) and SFI (ρ G = −0·40). All of these genetic correlations were significantly different from −1, indicating shared and some unique genetic influences between sport PA and %BF, TFMI, VAT, VFI and SFI. None of the genetic correlations between leisure PA and adiposity traits was significant except for %BF (ρ G = −0·66), which was not statistically different from −1, indicating completely shared genetic effects. None of the estimated household correlations (ρ C) or any of the random, unmeasured, environmental correlations (ρ E) between PA and adiposity traits was significant.
Discussion
While habitual PA is certainly modifiable to some extent, numerous studies including ours demonstrate that it is also significantly heritable. Our results indicate that sport and leisure PA are significantly influenced by genetic components. Our h 2 estimates for PA (0·17–0·26) are lower than those found among twin studies, which range from 0·30 to 0·85(Reference Maia, Thomis and Beunen3–Reference Simonen, Levälahti, Kaprio, Videman and Battié5, Reference Wolfarth, Bray, Hagberg, Pérusse, Rauramaa, Rivera, Roth, Rankinen and Bouchard7), but they are within the range of estimates derived from studies of non-twin relatives, which range from 0·09 to 0·57(Reference Mitchell, Rainwater, Hsueh, Kennedy, Stern and Maccluer8–Reference Cai, Cole, Butte, Bacino, Diego, Tan, Goring, O’Rahilly, Farooqi and Comuzzie10). Not only have others also found significant genetic effects using the same index(Reference Maia, Thomis and Beunen3) and other ‘habitual’ activity instruments(Reference Pérusse, Tremblay, Leblanc and Bouchard9), but the similarities in h 2 exist despite the fact that the research protocols of these studies differ from ours(Reference Mitchell, Rainwater, Hsueh, Kennedy, Stern and Maccluer8–Reference Cai, Cole, Butte, Bacino, Diego, Tan, Goring, O’Rahilly, Farooqi and Comuzzie10), such as adjusting for BMI(Reference Mitchell, Rainwater, Hsueh, Kennedy, Stern and Maccluer8, Reference Pérusse, Tremblay, Leblanc and Bouchard9) or examining different age ranges(Reference Cai, Cole, Butte, Bacino, Diego, Tan, Goring, O’Rahilly, Farooqi and Comuzzie10).
While confounding of genetic effects by within-family transmission of behavioural norms is an issue in quantitative genetic studies, we specifically modelled and tested for household effects in our study, so that the estimates of heritability have been adjusted for household environment. Furthermore, the extended pedigree design of our study means that the related individuals reside in different households and are exposed to varying environments across multiple generations, so that the independent environmental and genetic sources of variance on PA can be estimated with greater confidence. With regard to household environment we found significant household effects on leisure PA, indicating that walking to work, engaging in gardening, housework and other kinds of non-sport, and non-work time PA are significantly influenced by one’s spouse or other shared household influences. Estimates of the magnitude of c 2 on PA are inconsistent across previous studies. In one study, significant household effects were found for females(Reference Beunen and Thomis6) but not for males(Reference Lauderdale, Fabsitz, Meyer, Sholinsky, Ramakrishnan and Goldberg4, Reference Beunen and Thomis6) and in another, household effects were observed for adolescents but not in adults(Reference Simonen, Levälahti, Kaprio, Videman and Battié5). Using the same Baecke questionnaire sport and leisure PA indices, Maia et al.(Reference Maia, Thomis and Beunen3) found significant c 2 among both male and female twins for sport PA, but only among female twins for leisure PA. Among family studies, significant c 2 have been found for exercise participation, but not habitual exercise(Reference Pérusse, Tremblay, Leblanc and Bouchard9). Mitchell et al.(Reference Mitchell, Rainwater, Hsueh, Kennedy, Stern and Maccluer8) did not find significant c 2 for PA but did find that spousal correlations were stronger than cross-generation correlations, indirectly indicating the presence of household effects. These inconsistencies are not surprising as potential household effects may be heterogeneous and may represent unmeasured factors such as diet, attitudes towards PA, family composition, neighbourhood characteristics and cultural background.
To date, most genetic studies have treated measures of obesity as covariates when investigating PA, or have treated PA as a covariate when studying obesity measures. We found only a few studies that directly attempted to identify genes with pleiotropic effects on both obesity and PA(Reference Simonen, Levälahti, Kaprio, Videman and Battié5, Reference Cai, Cole, Butte, Bacino, Diego, Tan, Goring, O’Rahilly, Farooqi and Comuzzie10, Reference Nelson, Gordon-Larsen, North and Adair52). In a study based on Finnish twins, shared additive genetic effects between lifetime exercise and %BF(Reference Simonen, Levälahti, Kaprio, Videman and Battié5) were estimated at −1, indicating complete negative pleiotrophy, where the gene(s) that increase activity levels also decrease %BF levels. In that study, the genetic correlation between BMI and exercise was not reported because their statistical genetic models did not attain a reasonable model fit. These findings are similar to our results. We found significant additive genetic effects between sport and leisure PA and %BF, but not with BMI. One study reported a significant genetic correlation between PA and BMI(Reference Nelson, Gordon-Larsen, North and Adair52). In that study of adolescent siblings the genetic correlation between BMI Z score and physical inactivity (i.e. television watching) was 0·10(Reference Nelson, Gordon-Larsen, North and Adair52). In our analyses, we found negative genetic correlations between measures of abdominal adiposity (VAT, TFMI, VFI, SFI) and sport PA. Thus, our data suggest that the established association between PA and lower total and abdominal adiposity is due, in part, to a jointly inherited genetic mechanism or pathway, although this mechanism has yet to be identified. This has important public health implications in that, at the population level, obese individuals in need of increased PA may carry a genetic disposition for lower PA and therefore modifying therapeutic methods and targeting public health awareness to this group is essential.
We observed that sport and leisure PA had slightly different relationships with adiposity, which may relate to differences in the relationship of sport and leisure PA to total EE. In validity studies, sport PA and EE are moderately correlated (r = 0·55) while leisure PA is more weakly correlated (r = 0·21) with EE(Reference Philippaerts, Lefevre, Delvaux, Thomis, Vanreusel, Vanden Eynde, Claessens, Lysens and Beunen28). Alternatively, greater sport PA may also reflect greater opportunities to exercise, lower limitations related to higher socio-economic status and resources, lower physical disability, and/or better recall associated with vigorous activity such as sport PA(Reference Sallis53, Reference Jacobs, Ainsworth, Hartman and Leon54).
The significant genetic correlation between sport PA and measures of central adiposity, but not with more general measures of fat such as BMI, may reflect tissue differences in metabolic response to exercise. In exercise trials, weight (BMI) loss may not always be attained but VAT and SAT loss does occur(Reference Lee, Kuk, Davidson, Hudson, Kilpatrick, Graham and Ross21, Reference Ross, Janssen, Dawson, Kungl, Kuk, Wong, Nguyen-Duy, Lee, Kilpatrick and Hudson55). Reductions in total abdominal fat (VAT+SAT) are greater than fat loss in lower limbs(Reference Lee, Kuk, Davidson, Hudson, Kilpatrick, Graham and Ross21). As abdominal tissue is more metabolically active than limb adipose tissue(Reference Lee, Kuk, Davidson, Hudson, Kilpatrick, Graham and Ross21, Reference Wong, Janssen and Ross56), the shared genetic influence between abdominal fat and PA may point to genetic pathways linking PA to tissue-specific glucose or fat metabolism. Moreover, our findings of stronger genetic correlations using central adiposity adjusted for size (i.e. height2) indicates that body size adjustment is necessary in order to reveal the underlying relationship between sport PA and central adiposity, as taller individuals tend to be absolutely larger in all aspects but may have relatively less fat in critical visceral regions than shorter individuals (i.e. they are able to distribute more of their adipose tissue in the vertical plane).
Our study has a number of strengths including the use of an extended family study design, the incorporation of common household effects, and the use of criterion measures of central adiposity. To our knowledge, the present study is the first to directly estimate common genetic effects between PA and adiposity using DEXA and MRI to quantify adiposity. In our analyses, we did not perform the regression of PA on BMI or use BMI as a covariate as others have(Reference Mitchell, Rainwater, Hsueh, Kennedy, Stern and Maccluer8, Reference Pérusse, Tremblay, Leblanc and Bouchard9). When performing regression on adiposity levels at the phenotypic level, information pertaining to the common genetic pathways between PA and adipose tissue, as suggested by our findings, may be lost. Studies that do not take account of the heritability of PA and its common genetic influences with adiposity may actually underestimate the role of PA in chronic disease outcomes relative to that of obesity, because their joint contributions are not fully addressed.
One of the limitations of the present study is the use of self-reported PA. While the more intense PA level captured by the sport PA index accurately reflects sport activity records and aerobic fitness(Reference Richardson, Ainsworth, Wu, Jacobs and Leon32), it does not measure EE directly but rather self-reported participation in sport PA activity. Thus it is possible that our h 2 and c 2 estimates on self-reported PA might be lower or have greater standard errors than if more direct measurements were used. Further, other factors related to PA such as musculoskeletal health, physical disability, socio-economic status and neighbourhood factors, cardiopulmonary fitness level, or other behavioural, physiological or psychological traits influencing PA(Reference Davis and Kaptein57) are likely to be reflected in this measure. None the less, significant correlations (genetic and phenotypic) were observed between PA and body composition, while controlling for shared household effects and individual effects of education and smoking, which suggests that this measure is explanatory for familial risk of combined low activity and elevated adiposity. Another limitation to the study may be our measurement of household effects. Current household residence was used to identify common households and thus may not capture long-term cumulative household effects, particularly those that would take place during an individual’s formative years.
In summary, our study indicates that sport and leisure PA are under additive genetic effects and that leisure PA is additionally influenced by household effects. Our novel finding is that the likelihood of engaging in sport and leisure PA is, at least in part, inherited jointly with adiposity level. As increasing PA at the individual and population levels is integral to the prevention and treatment of obesity and CVD risk, it is important to attempt to elucidate the genetic as well as the behavioural and environmental factors influencing it. Current and future work involves identification of specific chromosomal regions and genetic variants acting in the physiological pathway between PA and reductions in abdominal adipose tissue, weight loss or weight maintenance.
Acknowledgements
This work was performed at the Lifespan Health Research Center, Wright State University Boonshoft School of Medicine, Dayton, OH, USA, and supported by National Institutes of Health grants (NHLBI HL69995, HL070167, and NIDDK-DK064870). The authors declare that they have no conflicts of interest to report. Author contributions were are follows. Design and concept of study: A.C.C., E.W.D., M.L. and S.A.C.1; data analysis and interpretation: A.C.C., M.L., S.A.C.1 and E.W.D.; manuscript draft: A.C.C., S.A.C.1, E.W.D., M.L., K.W.D., B.T., R.M.S. and S.A.C.3; acquisition of funding: R.M.S., E.W.D., S.A.C.3, S.A.C.1 and B.T. We thank the participants of the Southwest Ohio Family and research staff at the Lifespan Health Research Center for their assistance.


