


The WHO estimates that 17 % of the world’s population is at risk of Zn deficiency( Reference Wessels, Singh and Brown 1 ), with prevalence estimates highest in sub-Saharan Africa, particularly among children( Reference Brown, Rivera and Bhutta 2 ). Zn deficiency is associated with growth deficits, compromised immunity and higher risk of gastrointestinal and respiratory tract infections. A common cause of Zn deficiency is the habitual consumption of foods low in bioavailable Zn. A contributing factor may also be high Zn losses caused by frequent diarrhoea episodes( Reference Brown, Rivera and Bhutta 2 ). In settings where diarrhoea is endemic, Zn deficiency often coexists( Reference Young, Mortimer and Gopalsamy 3 ).
Preventive Zn supplementation improves plasma Zn (PZn) status and decreases morbidity due to diarrhoea( Reference Mayo-Wilson, Junior and Imdad 4 ). There is a lack of evidence on the effectiveness of Zn fortification on growth and morbidity in children( Reference Das, Kumar and Bhutta 5 ), which has been attributed to factors such as the choice of fortificant, food vehicle( Reference Hess and Brown 6 ) and excessive Zn losses( Reference Young, Mortimer and Gopalsamy 3 ). A promising approach for delivering Zn in diarrhoea-endemic, Zn-deficient communities is through microbiologically purified Zn-fortified water. Zn from drinking-water consumed away from meals is highly absorbed to the absence of absorption-inhibitory dietary components such as phytate( Reference Galetti, Kujinga and Mitchikpè 7 ).
In a proof-of-concept study, a household filtration device simultaneously removing microbiological contamination and fortifying water with Zn from ZnO embedded in phosphate-based glass plates at a concentration of ≈8 mg/l has been reported to be effective in improving Zn status in a randomised controlled trial in school-aged children in northern Benin( Reference Galetti, Kujinga and Mitchikpè 7 ). This water filtration and fortification system has been described in full elsewhere( Reference Galetti, Kujinga and Mitchikpè 7 ). We aimed to quantify the effectiveness of the same household water treatment device as a home-based intervention in pre-school children, a high-risk group for gastrointestinal and respiratory infections in resource-poor settings. We assessed its impact on Zn intake, Zn status and morbidity in a 6-month, prospective, double-blind, randomised controlled trial in a low-income area exposed to unimproved water in rural Kenya.
Methods
Study setting, design and randomisation
The present study was conducted between February 2014 and August 2014 in western Kenya, Kisumu West District. The study area consisted of fifteen villages in the sub-location Kajulu Koker located along the shores of Lake Victoria. This rural population lacks access to many basic health-care services and poverty is prevalent. The estimated literacy rate in women 15 years old or above is 90·8 %( 8 ). The study population relies on water from Lake Victoria or rainwater for domestic purposes, with main economic activities being small-scale farming and fishing. Western Kenya has a tropical climate with two rainy seasons, typically taking place as long rains from March to May and as short rains from October to December.
Eligible study households were randomly assigned to two groups using the household listing and the random function on Microsoft® Excel version 14 (2010). The randomisation was repeated until groups were comparable in anthropometric, demographic and haematological parameters. One child aged 2–6 years was enrolled per eligible household; when there was more than one child between 2 and 6 years old, only one of them was randomly selected to participate. The control group received a normal water purification filter which did not deliver Zn (FW), while the intervention group received a purification filter containing Zn-delivery glass plates (ZFW). Control and intervention filters were identical in presentation and were weight-matched. Randomisation was performed by a member of the investigating team who was not present at screening and enrolment, nor was involved in data analysis. All study personnel and participants were blinded to treatment assignment for the duration of the study. Number codes were used to identify the two treatment arms. Treatment assignment (the code) was revealed to the investigators at the end of primary and secondary analysis.
Study population
Children were enrolled into the study if they were aged 2–6 years, residing in Kajulu Koker, apparently healthy, with Hb concentration >70 g/l. Children were excluded if they were chronically ill or were participating in other clinical trials in the area.
Dietary intake and water consumption
Dietary intake in 112 children was assessed using a quantitative multi-pass 24 h recall method( Reference Moshfegh, Raper and Ingwersen 9 ) for all seven days, with all recall days evenly distributed throughout the week, and repeated for each child on a non-consecutive day to permit adjustment for day-to-day variation. The sample size was estimated to be adequate to determine a mean daily Zn intake deviating less than 0·3 mg from the true intake with 80 % power and 95 % confidence, assuming an expected mean intake of 2·8 mg/d with an anticipated sd of 1·5 mg/d( Reference Gegios, Amthor and Maziya-Dixon 10 , Reference Gibson and Ferguson 11 ). Caregivers were informed of the visits but not the exact day they would be interviewed. The interviews were carried out by local, trained interviewers fluent in speaking Dholuo language. Children were randomly allocated to day of the week, interviewers were randomly allocated to households and repeated household visits by the same interviewer were avoided. Caregivers were first asked to list all the foods and drinks the child had consumed at home and away in the previous 24 h from waking up the day before the interview until waking up the day of interview. Then they were requested to mention all the ingredients and cooking methods for each food/dish. Duplicate amounts of all foods, beverages and ingredients were weighed to the nearest 1 g using a digital precision balance scale (Kern EMB, Germany). If duplicate amounts were not available in the household during the interview, amounts were estimated using household units, such as volume (such as using a cup), size (small, medium, large) or as monetary equivalents. Conversion factors were determined by the supervisors and these were used to determine the amount consumed by the child. Caregivers were systematically probed for any food, beverage or snack omitted during the interview. Standard recipes were generated to estimate the amount of ingredients consumed from mixed dishes purchased or eaten outside the home by averaging three recipes of different caregivers or vendors in the local area. For foods consumed at school, crèche or day care, recipes were collected from the school cook. In all cases, the proportion given to child was calculated as the total volume given to the child minus any leftovers divided by the total volume of food cooked by the caregiver/vendor/school cook. This proportion was multiplied by the total amount of ingredients used in preparing the dish to determine the amount consumed by the child.
Consumption of both unfiltered and filtered water was assessed for each child during the 25 weeks of the intervention. Study children were provided with cups of standard 300 ml volume graduated at 75, 150 and 300 ml. A personal diary was filled out by each caregiver every day to record the participating child’s water intake by placing a tally mark under the image corresponding to the day of week, type of water consumed and administered volume whenever the index child consumed water. The personal diaries using tallies were the most reliable method out of four other methods (tally counter, 24 h recall, graduated water jug, observation) tested in a pilot study( Reference Broersen 12 ).
For PZn determination, a total sample size of 180 children in total was determined sufficient to detect a difference in PZn of 5 µg/dl assuming an sd of 9 µg/dl at a two-tailed 5 % significance level with 80 % power and an attrition rate of 20 %.
Blood collection and biochemical analysis
All blood samples were collected between 08.00 and 13.00 hours from fasting and non-fasting child participants for PZn analysis according to the International Zinc Nutrition Consultative Group protocol( 13 ) at baseline, 3 months and 6 months. Samples were collected in different communities using a central location as sampling site (school or health centre). Venous blood was drawn into a trace-element-free lithium heparin tube (Monovettes; Sarstedt system tubes, Numbrecht, Germany) and placed in a cooler box. To avoid endogenous and exogenous contamination we adhered to the standardised sampling and processing protocols recommended by the International Zinc Nutrition Consultative Group( 13 ). To obtain plasma, blood was centrifuged at 3000 rpm for 10 min using a field centrifuge within 40 min from collection. Time of blood collection and time of the last meal were recorded in field log sheets. Plasma samples were stored at −20°C until analysis. Hb was analysed in the field using a HemoCue photometer (HemoCue HB 201, Sweden). Plasma Zn was measured at ETH Zurich, Switzerland by atomic absorption spectrometry (AA240FS; Varian Inc., Australia) as previously described( Reference Galetti, Kujinga and Mitchikpè 7 ). C-reactive protein and α1-acid glycoprotein (AGP) were analysed using sandwich ELISA at a laboratory in Freiburg, Germany( Reference Erhardt, Estes and Pfeiffer 14 ). We coded specimens from all time points and analysed them without knowledge of study arm and in a random order. All values represent the mean of an independent duplicate measurement. We re-ran analysis if the CV exceeded 5 % and removed obvious outliers. We calculated prevalence of low PZn by using the time of day- and age-specific lower cut-offs of the International Zinc Nutrition Consultative Group( Reference Brown, Rivera and Bhutta 2 ). Subclinical inflammation was defined as C-reactive protein>5 mg/l and/or AGP>1 g/l. Anaemia was defined as Hb<110 g/l in children aged 0·5–4·9 years and as Hb<115 g/l in children aged 5 years or older( 15 ).
Anthropometry
At baseline, midpoint and endpoint, weight and height were measured according to WHO guidelines to the nearest 0·1 kg and 0·1 cm, respectively, using an electronic scale (Ashton Meyers, UK) and a UNICEF wooden measuring board with a sliding head piece. Measurements were taken twice and values represent the mean of duplicate measurements. The accuracy of the weighing scale was checked daily with a known weight. The same research assistant took the measurements at the three time points. Age was calculated using verifiable records (birth certificate, health record) or estimated based on a traditional calendar. Z-scores for height-for-age (HAZ) and weight-for-age (WAZ) were determined for each child using WHO ANTHRO PLUS software version 1.0.4. Children were classified as stunted or underweight if their HAZ or WAZ, respectively, was less than –2.
Morbidity
Prevalence of diarrhoea and other symptoms (upper respiratory infection, rapid breathing, cough, abdominal pain, fever, headache) in the study children was assessed weekly by field assistants who completed a forced-choice questionnaire by interviewing the caregivers. The recall period for symptoms was 1 week, except for diarrhoea, where a recall period of 48 h was applied( Reference Ramakrishnan, Venkatarao and Koya 16 ). Diarrhoea was defined using the WHO definition of three or more loose stools passed in 24 h( 17 ). Clinic visit records when available were asked for proof to verify symptoms reported.
Monitoring device usage and effectiveness
All households were provided with a tally counter to record each time they refilled one jerry can (10litres) with filtered water. During the weekly visit by the field assistant, the number on the tally counter was recorded and set back to zero. One count was assumed to be equal to one filtering event of 10litres. Device effectiveness was assessed by measuring Zn content in effluent water samples from thirty-five randomly selected households representing 19 % of the study households (eighteen from the ZFW group, seventeen from the FW group). Water was sampled for Zn analysis by atomic absorption spectrometry at the Laboratory for Human Nutrition, ETH Zurich, Switzerland at four random time points over the intervention period.
Data analysis
Dietary zinc intake
Compl-eat© version 1.0 (Wageningen University, the Netherlands) was used to calculate Zn and energy intakes from the 24 h recalls. Nutrient intake calculations were based on a food composition table developed specifically for the study using the Kenya national food composition table as primary source( Reference Sehmi 18 ). US Department of Agriculture retention factors( 19 ) were applied to raw ingredients and foods to account for nutrient losses during food preparation. Nutrient intake analysis was done using the statistical software package IBM SPSS Statistics version 21. Normality of distributions was tested by visually comparing the sample distribution with a standard normal distribution using quantile–quantile (Q–Q) plots. Non-normal nutrient intake data were log-transformed, resulting in normal distributions, and then back-transformed to facilitate interpretation. All nutrient intakes were adjusted for day-to-day variation according to the method developed by the National Research Council( 20 ). The percentage of children below the WHO Estimated Average Requirement for children aged 1–3 years (6·9 mg/d) and 4–6 years (8·0 mg/d) for Zn intake was determined, assuming 15 % Zn bioavailability from food. The contribution that Zn-fortified water made to WHO physiological requirements in children aged 1–3 years (0·83 mg/d) and 4–6 years (0·97 mg/d) was determined( Reference Brown, Rivera and Bhutta 2 ).
Intervention effectiveness
Data were analysed using IBM SPSS Statistics version 21. Normality of distributions was tested visually using Q–Q plots. We excluded outliers, defined as more than 3sd from the overall mean, at baseline, midpoint and endpoint. One outlier was identified at baseline for PZn (22·4 µg/dl), one at midpoint (173·4 µg/dl) and one at endpoint (28·0 µg/dl). We tested baseline or overall group differences using the independent-samples t test for normally distributed data, the Mann–Whitney U test when the data were non-normal and the sign test for paired non-normal data. The χ 2 test was used to test group differences between withdrawal rates. We tested the intervention effect on continuous outcomes and binary outcomes using linear mixed-effect models and generalized estimating equations( Reference Hanley 21 ), respectively, with unstructured covariance matrix. Participants were defined as random components, and time, treatment and the time-by-treatment interaction as fixed effects on the variance. Models with different covariates (e.g. fasting status) were compared and we selected the best-fit model by the Akaike information criterion and the Bayesian information criterion. Statistical dependence was tested using the Pearson product-moment correlation coefficient (r) for normally distributed data and with Spearman’s rank correlation coefficient (r s) for non-normally distributed data. Risk ratios (RR) and 95 % CI for disease incidence were calculated by means of Ken Rothman Epi Sheet (http://www.epidemiolog.net/studymat/), which compared the number of visits with reported events with the total number of visits. The significance level was set at P<0·05. Compliance to treatment was defined as median water consumption >500 ml/d. The primary analysis was intention to treat and included all children enrolled at baseline. Per-protocol analysis was restricted to children who completed 25 weeks of the trial.
Results
Participants were recruited from 31 January 2014 until 14 February 2014. In total, 235 caregivers initially consented to the study on behalf of the children. After forty-three refusals between consenting and baseline, 192 were screened. Of these, six had severe anaemia and two phlebotomies were unsuccessful. Thus, a total of 184 children were included in the study and randomised to the intervention or control group. The study was completed by 167 children with a dropout rate of 9·2 % (Fig. 1) and no significant difference in withdrawals between the ZFW group (8·0 %) and FW group (10·6 %; P<0·05). One of the main reasons for non-completion of the trial was migration out of the study area.
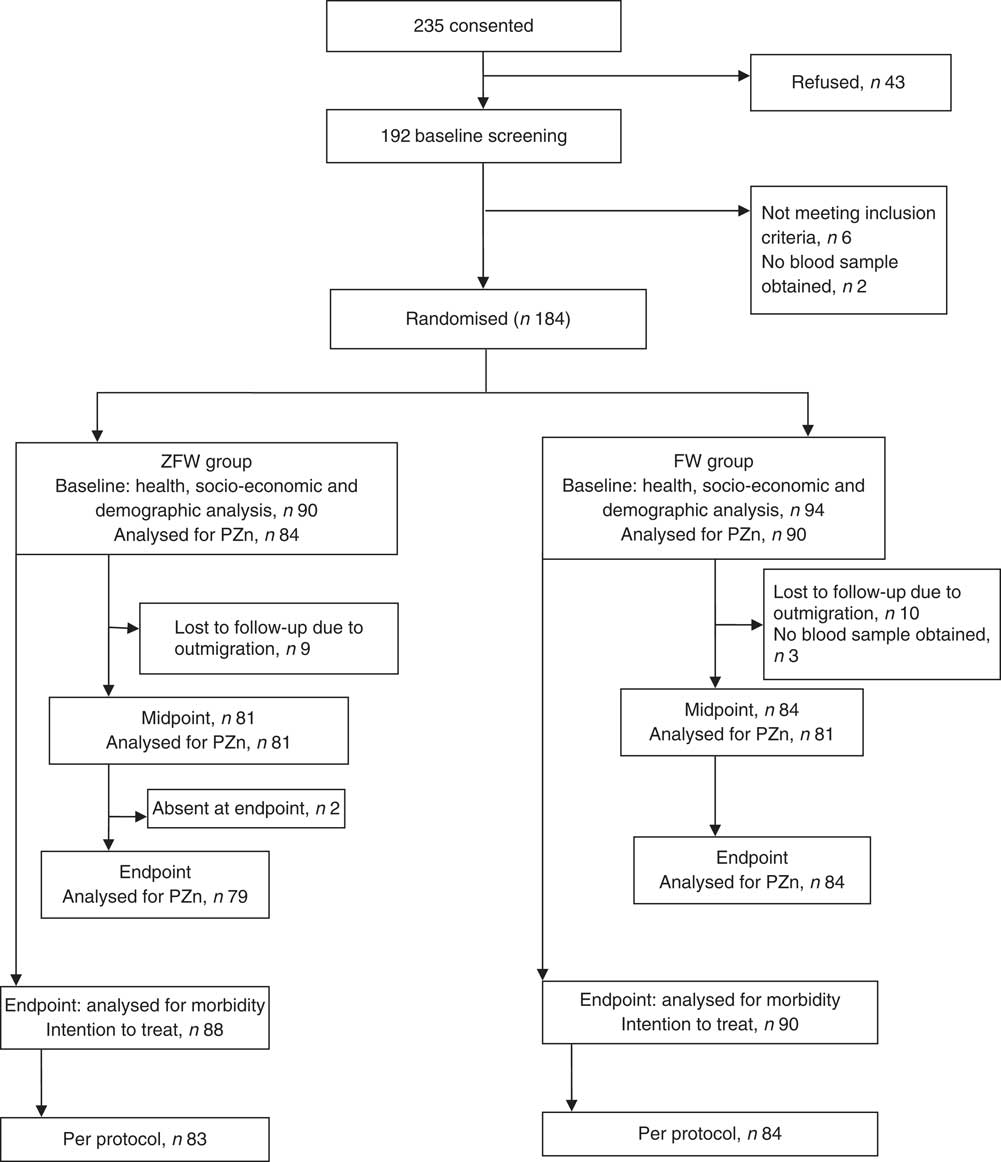
Fig. 1 Trial profile (ZFW, zinc-fortified filtered water; FW, filtered water; PZn, plasma zinc)
ZFW and FW participants were not different at baseline in demographic, socio-economic characteristics and nutritional status (Table 1). Similarly, there was no difference in baseline dietary Zn intake with no drinking-water added (6·0 (sd 1·7) mg/d v. 5·7 (sd 1·6) mg/d; P=0·37; Table 2) or energy intake (6146 (sd 1385) kJ/d (1469 (sd 331) kcal/d) v. 6343 (sd 1222) kJ/d (1516 (sd 292) kcal/d; P=0·43), or in the proportion of participants below the WHO age-specific Estimated Average Requirement for Zn intake, being 81·1 and 87·3 % (P=0·41) in the ZFW group and FW group, respectively. Similarly, there was no difference in compliance (39 and 42 % for ZFW and FW group, respectively) between the two groups during the intervention (P=0·63).
Table 1 Demographic, socio-economic and nutritional status of the study children aged 2–6 years from rural western Kenya, February–August 2014
FW, filtered water; ZFW, Zn-fortified filtered water; IQR, interquartile range.
Group-wise differences were analysed by the independent-samples t test and the Mann–Whitney U test for normal and non-normal data, respectively, and the χ 2 test for categorical data. There was no significant difference (P >0·05) between the groups for all variables analysed.
* Values are median and IQR.
† n 82 for the ZFW and FW group for height-for-age Z-score only due to missing date of birth. Children with height-for-age Z-score<–2 and weight-for-age Z-score<–2 were considered stunted and underweight, respectively, according to the WHO growth standards for children aged<59 months and the WHO 2007 growth reference for children aged >60 months.
‡ Values are mean and sd.
§ Multiple responses were possible.
║ Includes crop sales, trade, small business, formal employment and unemployed.
¶ Includes private tap, public tap, protected/unprotected well, tank and one non-response.
** Includes private tap, public tap, unprotected well, tank and rain harvesting.
†† Includes electricity from solar energy and gas.
Table 2 Zinc intake from the diet, filtered fortified water and filtered non-fortified water by children aged 2–6 years from rural western Kenya, February–August 2014
ZFW, Zn-fortified filtered water; FW, filtered water; IQR, interquartile range.
a,bMedian values within a row with unlike superscript letters were significantly different (P<0·05) by the Mann–Whitney U test.
* Values are mean and sd.
† Values are median and IQR.
Median device usage was 3 (interquartile range (IQR) 2–5) filtration events per week for households of both groups (Fig. 2). Median unfiltered water intake was 0 (IQR 0–0) ml/d and did not differ between groups (P=0·17). There was an overall slight decrease of filtration events over time (P<0·001). Notable peaks of increase in filter usage were observed at the start of the intervention, midpoint and endpoint. Median filtered water intake for ZFW and FW groups was 450 (IQR 289–675) ml/d and 471 (IQR 300–718) ml/d, respectively, over the intervention period with no significant difference between the two groups (P=0·17). Water treatment devices were effective (P<0·01) in delivering higher Zn concentration in ZFW-group water samples (n 74), median 1·0 (IQR 0·5–2·5) mg Zn/l, compared with the FW group (n 76), median 0·3 (IQR 0·1–0·6) mg Zn/l (Fig. 3). Median Zn intake from filtered water was 0·5 (IQR 0·3–0·6) mg Zn/d for the ZFW group and 0·0 (IQR 0·0–0·1) mg Zn/d for the FW group (Table 2 and Fig. 3). Zn-fortified water at an absorption rate of 65·9 %( Reference Galetti, Kujinga and Mitchikpè 7 ) contributed 36 and 31 % of the WHO daily requirements for absorbable Zn in children aged 2–3 years (0·83 mg/d) and 4–6 years (0·97 mg/d), respectively( Reference Brown, Rivera and Bhutta 2 ).
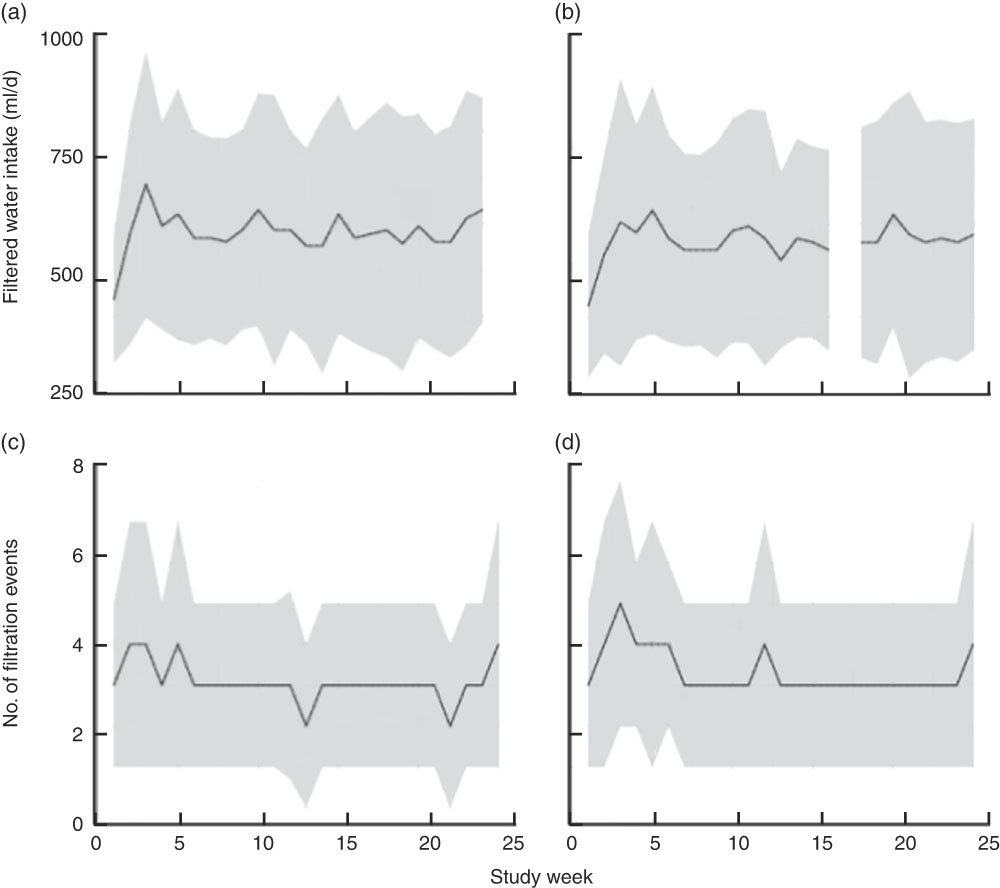
Fig. 2 Filtered water intake (a, b) and filter usage (c, d) over the study period, by treatment group (a and c, FW group; b and d, ZFW group), among children aged 2–6 years, rural western Kenya, February–August 2014. Solid line represents the median and the shaded area represents the interquartile range (FW, filtered water; ZFW, zinc-fortified filtered water)

Fig. 3 Box-and-whisker plots of water zinc concentrations in samples collected in the households of the two treatment groups at four time points over the 6-month intervention period (n total 150), rural western Kenya, February–August 2014. The bottom and top edge of the box represent the first and third quartiles (interquartile range); the line within the box represents the median; the ends of the bottom and top whiskers represent the minimum and maximum values; and the average value is marked with +. There was a significant difference in zinc concentrations between intervention (ZFW) and control households (FW; Mann–Whitney U test, P<0·05). (FW, filtered water; ZFW, zinc-fortified filtered water)
There was no significant time-by-treatment effect on uncorrected PZn (P=0·11) nor on the prevalence of Zn deficiency (P=0·51; Tables 3 and 4). There was a trend towards a time effect (P=0·07) and a significant positive time-by-treatment interaction effect on the prevalence of elevated AGP (P=0·019), with the ZFW group having generally higher levels of AGP than the FW group. There was no significant time effect (P=0·69) or time-by-treatment effect on HAZ (P=0·97) or prevalence of stunting (P=0·88).
Table 3 Effect of the 6-month intervention (daily consumption of fortified or non-fortified filtered water) on plasma zinc and acute-phase protein concentrations and height-for-age Z-scores by treatment group in children aged 2–6 years from rural western Kenya, February–August 2014

ZFW, Zn-fortified filtered water; FW, filtered water; IQR, interquartile range; PZn, plasma Zn; CRP, C-reactive protein; AGP, α1-acid glycoprotein; HAZ, height-for-age Z-score.
* Testing the time-by-treatment effect by linear mixed-effect models for continuous variables and generalized estimating equations binary logistic models for binary variables (P<0·05).
† Values are mean and sd.
‡ Corrected using the four-level inflammation correction factor approach. Participants were allocated to the reference group unless plasma CRP concentration was >5 mg/l and/or plasma AGP was >1 g/l when they were allocated to the incubation (only CRP elevated), early convalescence (both CRP and AGP elevated) or late convalescence (only AGP elevated) groups.
§ Values are median and IQR.
Table 4 Effect of the 6-month intervention (daily consumption of fortified or non-fortified filtered water) on zinc status markers by treatment group in children aged 2–6 years from rural western Kenya, February–August 2014
ZFW, Zn-fortified filtered water; FW, filtered water; HAZ, height-for-age Z-score.
* Testing the time-by-treatment effect by linear mixed-effect models for continuous variables and generalized estimating equations binary logistic models for binary variables (P<0·05).
There were lower numbers of occasions of reported cold with runny nose (RR=0·91; 95 % CI 0·83, 0·99; P=0·034), abdominal pain (RR=0·70; 95 % CI 0·56, 0·89; P=0·003) and a trend for diarrhoea (RR=0·78; 95 % CI 0·59, 1·04; P=0·09) in the ZFW group compared with the FW group. Per-protocol analysis showed similar results, except for reported diarrhoea which was significantly lower in the ZFW group, 3·6 % (73/2022), than in the FW group, 5·0 % (103/2043; RR=0·72; 95 % CI 0·53, 0·96; P=0·03; Table 5).
Table 5 Effect of the 6-month intervention (daily consumption of fortified or non-fortified filtered water) on the occurrence of common infectious morbidities in children aged 2–6 years, rural western Kenya, February–August 2014

ITT, intention to treat; PP, per protocol; ZFW, Zn-fortified filtered water; FW, filtered water.
Recall period was 2 d for diarrhoea only and 1 week for all other conditions assessed.
* Risk ratios (RR) and 95 % CI for disease incidence were calculated by means of contingency tables.
Discussion
We investigated the effect of Zn-fortified water on Zn intake and morbidity in young rural Kenyan children. Consumption of fortified water over a 25-week intervention period increased daily Zn intake. This was associated with lower morbidity due to abdominal pain and upper respiratory tract infection, and a trend towards lower reports of diarrhoea which was significant in the per-protocol analysis. Our findings build upon a previous study demonstrating the efficacy of Zn-fortified water to increase Zn status in schoolchildren( Reference Galetti, Kujinga and Mitchikpè 7 ) in a controlled school setting, where water portions were administered under close supervision. Our current study was designed as an ‘effectiveness’ household-based trial, under similar conditions to real life: filtering devices were distributed to the households and participants were responsible for operating the water treatment device, such as in a donor-driven initiative. By the nature of the effectiveness intervention, 40 % of the participants consumed on average 500 ml of treated water daily, compared with the closer adherence to the target of 600 ml water/d in the Benin trial( Reference Galetti, Kujinga and Mitchikpè 7 ). In addition, the Zn concentration in the consumed water was limited to average 2·4 mg/l compared with ≈4 mg/l in the Benin study. In the current study, Zn concentration was limited due to the natural variability in water consumption and possible differences in Zn elution rates when the device was used in households, where varying usage patterns may have resulted in fluctuating Zn concentrations. High Zn concentrations in eluted water would be of concern because Zn may impart an astringent taste to water at concentrations higher than ≈4 mg/l( 22 ). The International Zinc Nutrition Consultative Group has set revised Tolerable Upper Intake Levels for Zn intake in children aged 2–3 years and 4–6 years, namely 8 and 14 mg/d, respectively( Reference Brown, Rivera and Bhutta 2 ).
In the current study, the target group comprised younger children (aged 2–6 years) who generally are more vulnerable to critical water quality and paediatric infections than school-aged children( Reference Galetti, Kujinga and Mitchikpè 7 ); a difference that could explain the decrease in infections in the current study as compared with the study in Benin schoolchildren. Another difference could be that the pre-school Kenyan children almost exclusively consumed filtered water as this was available at home. In Benin, schoolchildren drank purified water only in school. Similar to our findings, daily Zn supplementation (5 mg/d in 5 ml sterile water) reduced incidence of diarrhoea and upper respiratory tract infection in Tanzanian infants( Reference McDonald, Manji and Kisenge 23 ), and comparable benefits of Zn supplementation on diarrhoea and acute respiratory infection have been observed in a systematic review( Reference Mayo-Wilson, Junior and Imdad 4 ).
In contrast, we did not detect increase in the secondary outcome PZn and in the prevalence of Zn deficiency. PZn responds to intake but it is not a sensitive marker of Zn status, and a marker reflecting body Zn pools is yet to be identified( Reference King, Brown and Gibson 24 ). A previous Zn supplementation study in Zn-deficient children has shown improvement in clinical features of Zn deficiency such as linear growth and immune function with no change in PZn( Reference Schlesinger, Arevalo and Arredondo 25 ), while several studies have shown improvements in growth indices in Zn-supplemented children with no increase in serum Zn( Reference Friis, Ndhlovu and Mduluza 26 , Reference Castillo-Durán, Rodríguez and Venegas 27 ). These latter children were small-for-gestational age, stunted or malnourished at baseline. It could be that in nutritionally deficient children, functional response is higher due to a higher sequestration rate of Zn by tissues in need of Zn. Furthermore, in a review to assess the therapeutic value of Zn supplementation in acute and persistent diarrhoea, the efficacy of Zn therapy on acute diarrhoea was not predicted by PZn( Reference Patel, Mamtani and Dibley 28 ).
The current study was conducted in rural Kisumu in villages along Lake Victoria. The households are exposed daily to unclean water and the risk of Zn deficiency and infections was expected to be high. This was confirmed by the high prevalence of inflammation, Zn deficiency as well as anaemia at baseline. A high proportion (81·1 and 87·3 % in the ZFW and FW group, respectively) of the children were below the WHO Estimated Average Requirement for Zn intake without contribution of Zn-fortified water, suggesting elevated risk of zinc deficiency. At a fortification level of at least 1·0 mg/l, the consumption of 500 ml of fortified water daily contributed about 0·5 mg additional Zn/d. This amount though seemingly low is highly bioavailable (approximately 65 %) when consumed away from meals( Reference Galetti, Kujinga and Mitchikpè 7 ) and can contribute up to 36 and 31 % of the WHO’s set physiological requirements for absorbed Zn of children aged 2–3 years (0·83 mg/d) and 4–6 years (0·93 mg/d), respectively( Reference Brown, Rivera and Bhutta 2 ). This may be particularly the case in this population, which has a diet rich in inhibitors of Zn absorption and an estimated low Zn bioavailability from the diet of 15 %.
The lack of an overall effect on PZn concentration and stunting could also have been due to the low dosage delivered by the fortification device. Trials on Zn fortification of cereals that have used fortification levels below 5 mg/d have shown mixed results. A recent review on Zn fortification trials (fortification levels ranged from 3·2 to 15 mg/l) reported a significant impact on PZn concentration but a non-significant effect on growth( Reference Das, Kumar and Bhutta 5 ). Although the ZFW group reported lower morbidity, the inflammatory marker AGP was significantly higher in the ZFW group. A possible explanation may be that increased Zn intake resulted in a more effective immune response as reflected in an elevated AGP( Reference Aydemir, Blanchard and Cousins 29 ). Supplementation with Zn has previously been shown to amplify markers of the acute-phase response, as shown by increased body temperature, cytokine concentrations, ceruloplasmin and IL-6 in human and animal studies( Reference Krones, Klosterhalfen and Fackeldey 30 , Reference Braunschweig, Sowers and Kovacevich 31 ).
Our study has several strengths and limitations. It was a randomised controlled trial and there was a low dropout rate (9·7 %). We studied pre-school children, an age group particularly vulnerable to both poor sanitation and Zn deficiency, and therefore most likely to benefit from a household-based intervention. A limitation of the study was that although daily consumption of Zn-fortified water was associated with lower morbidity due to abdominal pain and upper respiratory tract infection, the study lacked statistical power to measure effects on growth or morbidity and hence these results should be interpreted with caution. Although active weekly surveillance was systematically performed in all study children, morbidity data were collected based on recall from the mother, a method that can introduce recall bias. We minimised this bias by carefully blinding the participating families and rigorously standardising data collection protocols. We conducted the study during the peak infection season; this may have increased our ability to detect an effect on infectious morbidity but also may have confounded our ability to detect a positive effect on PZn concentration, due to the higher variability in this marker elicited by the high prevalence of infection. Furthermore, we cannot exclude that a longer observation period would have allowed us to detect stronger effects on morbidity and significant effects on PZn. Nevertheless, PZn has been reported to react rapidly to changes in intake( Reference Wessells, Jorgensen and Hess 32 ). Kenya has adopted a national policy of Zn supplementation as first-line treatment for diarrhoea. Thus, a potential confounder in our study was the dispensing of Zn tablets by the local clinic to study children for treatment of diarrhoea. However, the ZFW and FW groups reported to have received Zn tablets on a comparable number of occasions (eleven and twelve, respectively) and PZn concentrations decline rapidly after supplementation is withdrawn( Reference Wessells, Jorgensen and Hess 32 ). Our findings suggest that when households are provided with a water purification filter, compliance is likely to decrease in the absence of external reinforcement. This trend was particularly evident at periods close to baseline, midpoint and endpoint (Fig. 2). Although the present study did not set out to investigate determinants of compliance to filter usage, a previous study has recommended a change in design of the filter to encourage and increase compliance( Reference Galetti 33 ).
Conclusion
In conclusion, our results show that Zn-fortified water provided as a household intervention contributes to dietary Zn intake and may result in a decrease in reported childhood infections. This suggests a high public health potential of Zn fortification of water when integrated in water treatment and supply systems. Combining sanitation and nutritional interventions in public health programmes may be particularly beneficial in communities affected by both high rates of paediatric infections and nutritional deficiencies. More research is required concerning feasibility on a large scale and safety of the approach.
Acknowledgements
Financial support: Financial support for the study was provided by Vestergaard SA (Lausanne, Switzerland) and NUFFIC (Netherlands Organisation for International Cooperation in Higher Education, The Hague). Vestergaard SA and NUFFIC had no role in the design, analysis or writing of this article. Conflict of interest: None. Authorship: P.K., V.G., I.D.B., D.M., P.A. and M.B.Z. designed the research; P.K., E.O., V.G., V.J. and D.M. conducted the effectiveness trial; P.A., I.D.B. and D.M. supervised the fieldwork; P.K. analysed data; P.K. wrote the first draft of the paper and all authors edited and approved the final version of the paper. Ethics of human subject participation: This study was conducted according to the guidelines laid down in the Declaration of Helsinki and all procedures involving human subjects were approved by the Ethical Review Committee of Kenyatta National Hospital/Nairobi University (KNH-ERC/A/335) and ETH Zurich Ethical Committee (EK 2013-N-31). Written informed consent was obtained from the head of household and caregiver on behalf of their children before the study commenced. The trial was registered at www.clinicaltrials.gov (NCT02162238).


