


Obesity is a major and increasing public health concern worldwide which is associated with several adverse health consequences(Reference Finucane, Stevens and Cowan1). In high-income countries, the USA has the highest adult obesity prevalence at about 30 %(Reference Finucane, Stevens and Cowan1). In Finland, over half of the adult population is at least overweight (BMI ≥ 25 kg/m2) and every fifth adult of them is obese (BMI ≥ 30 kg/m2)(Reference Männistö, Laatikainen and Harald2). Vitamin D inadequacy is associated with impaired skeletal function, and it may increase the risk of many other chronic diseases and public health concerns(Reference Holick3). It has also been suggested that there may be a link between vitamin D status and obesity(Reference Earthman, Beckman and Masodkar4).
Two recent meta-analyses based on cross-sectional data have shown that there is an inverse association between vitamin D status and BMI in adults(Reference Saneei, Salehi-Abargouei and Esmaillzadeh5) and that vitamin D insufficiency is more common in obese than normal-weight subjects(Reference Pereira-Santos, Costa and Assis6). There are some suggested biological mechanisms behind this association, for example, decreased bioavailability of vitamin D in obese subjects(Reference Wortsman, Matsuoka and Chen7). On the other hand, the inverse association may be explained by the lifestyle differences between normal-weight and obese subjects(Reference Pourshahidi8). However, the evidence from longitudinal studies is limited and the results are controversial also suggesting the possibility that the association between vitamin D status and obesity may work both ways, vitamin D status as a predictor of obesity and vice versa. In brief, the previous longitudinal studies have shown that (i) low vitamin D status predicts obesity(Reference Mai, Chen and Camargo9,Reference Gonzalez-Molero, Rojo-Martinez and Morcillo10) ; (ii) BMI at baseline is inversely associated with the change in vitamin D status(Reference Jamal-Allial, Griffith and Tucker11); (iii) increase in BMI is associated with a decrease in vitamin D status and vice versa(Reference Jorde, Sneve and Emaus12) or (iv) no statistically significant association(Reference Young, Engelman and Langefeld13,Reference LeBlanc, Rizzo and Pedula14) . Thus, more information based on large-scale, longitudinal population-based studies are needed to clarify the temporal aspects of the inverse association between vitamin D status and obesity. The present study fills this gap in the literature by examining whether vitamin D status predicts weight gain or increase in waist circumference during 11-year follow-up in general adult population.
Materials and methods
Study populations
The current study is based on a nationally representative sample of Finnish adults from the Health 2000 Survey (H2000), conducted in 2000–2001(Reference Heistaro15), and its follow-up, the Health 2011 Survey (H2011), conducted in 2011–2012(Reference Lundqvist and Mäki-Opas16). In H2000, a two-stage stratified cluster sample (n 9922) was drawn from the nationwide population register in Finland. All members of the H2000 sample, who were living in Finland in 2011 and had not refused to be invited to further studies, were invited to H2011 (n 8135). The participation rates in baseline and follow-up health examinations were 85 and 59 %, respectively. The present study included participants who were 30–64 years old at baseline, for whom serum 25-hydroxyvitamin D (S-25(OH)D) concentration, a measure of vitamin D status, was available at baseline, whose weight and height were measured both at baseline and follow-up and who were not pregnant at either time point. The final data included 1342 men and 1582 women.
H2000 was approved by the Ethical Committee for Research in Epidemiology and Public Health whereas H2011 by the Coordinating Ethics Committee at the Hospital District of Helsinki and Uusimaa in Finland. Both studies were conducted according to the guidelines laid down in the Declaration of Helsinki. Written informed consent was obtained from all participants.
Background variables
The survey methodologies were largely the same in the H2000 and H2011 surveys including questionnaires, interviews and a comprehensive health examination(Reference Heistaro15,Reference Lundqvist and Mäki-Opas16) . Information on age and sex was obtained from the Population Register Centre. Interviews and self-administered questionnaires provided information on sociodemographic background and lifestyle. Education was dichotomised into high education (at least Bachelor's level education) v. middle or low education and marital status into being married or cohabiting v. single, divorced or widow/er. The question concerning leisure-time physical activity included four categories: ‘(i) in my leisure time I read, watch TV and do other activities in which I do not move much and which do not strain me physically; (ii) in my leisure time I walk, cycle and move in other ways at least 4 h per week; (iii) in my leisure time, I exercise at least 3 h per week and (iv) in my leisure time, I practice regularly several times per week for competition’ and for the analysis it was dichotomised into physically active at leisure time (categories 2–4) v. inactive. Smoking status was dichotomised into current smoking v. never or former smoking and alcohol consumption to low to moderate alcohol consumption (1–199 g/week in men and 1–99 g/week in women) v. non-consumption or high consumption.
Anthropometric measurements
Height was measured using a stadiometer. Weight was primarily measured as a part of bioimpedance body composition analysis (InBody 3.0 in H2000 and Seca 514 in H2011) in light clothing without shoes. If bioimpedance analysis was not possible, weight was alternatively measured with floor scale. BMI was calculated as weight (kg) divided by height squared (m2). Waist circumference was measured on the bare skin in standing position from the mid-point between the lowest rib bones and the high point of the iliac crest.
Measurement of serum 25-hydroxyvitamin D
Fasting (≥4 h) blood samples were drawn in the health examination between September 2000 and March 2001 and stored at –70 °C. S-25(OH)D concentration was analysed by radioimmunoassay (Diasorin) between January 2001 and November 2002. The interassay CV for S-25(OH)D concentration measurements was 7·80 % at the mean level of 47·3 nmol/l. S-25(OH)D was categorised as deficient (<30 nmol/l), insufficient (30−49 nmol/l) and sufficient (≥50 nmol/l) according to Institute of medicine definitions(17). The season of blood sampling was dichotomised into autumn months (September, October) and winter months (November to March).
Statistical methods
All analyses were carried out using SAS 9.3(18) and SUDAAN 11.0.1(19) taking into account the sampling design. The inverse probability weights were used in all analysis (excluding analysis of baseline characteristics) to correct the effects of non-participation(Reference Härkänen, Karvanen and Tolonen20,Reference Robins, Rotnitzky and Zhao21) .
Logistic regression was used to estimate the weighted ORs and 95 % CI for ≥5 and ≥10 % weight gain and ≥5 and ≥10 % increase in waist circumference according to categories of S-25(OH)D concentration at baseline. The cut-offs were selected based on the recommendation that 5–10 % weight loss offers health benefits(22). The weighted mean changes in weight or in waist circumference during the follow-up and their 95 % CI were based on predictive margins(Reference Graubard and Korn23) analysed with linear regression. Test for trend was done across categories of S-25(OH)D at baseline using the Wald test. Potential effect modification by sex, blood sampling season (November to March v. other) and either BMI at baseline (weight gain; normal weight defined as BMI <25 kg/m2v. other(22)) or waist circumference at baseline (<102 cm in men or <88 cm in women v. other(22)) were evaluated by including the interaction term between S-25(OH)D concentration and potential effect modifier in age- and sex-adjusted model one at a time. The association between S-25(OH)D at baseline and weight gain was not modified by sex, blood sampling season or BMI at baseline (all P values for interaction >0·30). Further, the association between S-25(OH)D at baseline and increase in waist circumference was not modified by either blood sampling season or waist circumference at baseline (both P values for interaction >0·30), but it was modified by sex (P for interaction <0·01). Therefore, all the analyses were stratified by sex.
In model 1, the analyses were adjusted for age at baseline (categorical: 30–39, 40–49, 50–59, 60–64 years). In model 2, the analyses were further adjusted for either weight at baseline or waist circumference at baseline. Other potential confounding factors, originally chosen based on literature, which were associated (P < 0·20) with S-25(OH)D at baseline and ≥10 % weight gain and ≥10 % increase in waist circumference during the follow-up were included in model 3. Thus, model 3 included age at baseline, marital status, education, leisure-time physical activity, smoking status and alcohol consumption.
The season of blood sampling (September to October v. November to March) did not meet the criteria of effect modifying or confounding factor as defined above. However, because the season of blood sampling is known to be very strongly associated with vitamin D status, the main analyses (≥10 % weight gain and ≥10 % increase in waist circumference) were repeated by including the season of blood sampling to the models 1 and 3.
Results
At baseline, the mean age of the participants was 46 years and 54 % were women. Almost 80 % of the participants were married or cohabiting. About one-third of men and over 40 % of women had high education. Further, over 70 % of the participants were physically active at leisure time and 70 % of men and 76 % of women were non-smokers.
The mean S-25(OH)D concentrations at baseline in men and women were 45 and 46 nmol/l, respectively. Older age was associated with higher vitamin D status in both men and women (Table 1). Further, those who had a higher education were more likely to have sufficient vitamin D status than participants with lower education. Participants with sufficient vitamin D status also had a healthier lifestyle compared with those with low vitamin D status, that is, they were more likely to be non-smokers, physically active at leisure time and moderate alcohol consumers. In addition, waist circumference at baseline was lower among those participants with sufficient vitamin D status compared with those with insufficient or deficient vitamin D status. In women, similar association was found regarding weight at baseline.
Table 1 Baseline characteristics of participants (means or prevalences with 95 % CIs) according to categories of serum 25-hydroxyvitamin D (S-25(OH)D) concentration adjusted for age

The values are age-adjusted (30–39, 40–49, 50–59, 60+ years) means or prevalences and their 95 % CIs.
* Men: deficient, n 196; insufficient, n 652; sufficient, n 494; women deficient, n 221; insufficient, n 815; sufficient, n 546.
† Not adjusted for age.
‡ Moderate alcohol consumption: in men 1–199 g/week, in women 1–99 g/week.
In men, there was a borderline statistically significant inverse association between vitamin D status at baseline and ≥10 % weight gain during the follow-up when adjusted for age only (OR for the categories of sufficient v. deficient vitamin D status 0·60; 95 % CI 0·37, 0·97; P for trend 0·07) (Table 2). Adjustment for weight at baseline (Table 2, model 2) did not change the results. After adjustment for sociodemographic and lifestyle factors, the observed association was attenuated (OR for the categories of sufficient v. deficient vitamin D status 0·70; 95 % CI 0·42, 1·18; P for trend 0·23). When focusing on ≥5 % weight gain, the results were parallel, but weaker. Low vitamin D status at baseline predicted ≥10 % increase in waist circumference in model 1 (OR for the categories of sufficient v. deficient vitamin D status 0·41; 95 % CI 0·25, 0·67; P for trend <0·01) and this association remained significant after adjustment for sociodemographic and lifestyle factors (OR for the categories of sufficient v. deficient vitamin D status 0·45; 95 % CI 0·26, 0·77; P for trend <0·01). Adjustment for waist circumference at baseline (Table 2, model 2) did not change the results. Similar, but slightly weaker, results were observed when the cut-off point was set at ≥5 % increase in waist circumference.
Table 2 Weighted ORs and their 95 % CIs for weight gain and increase in waist circumference according to categories of serum 25-hydroxyvitamin D (S-25(OH)D) at baseline stratified by sex
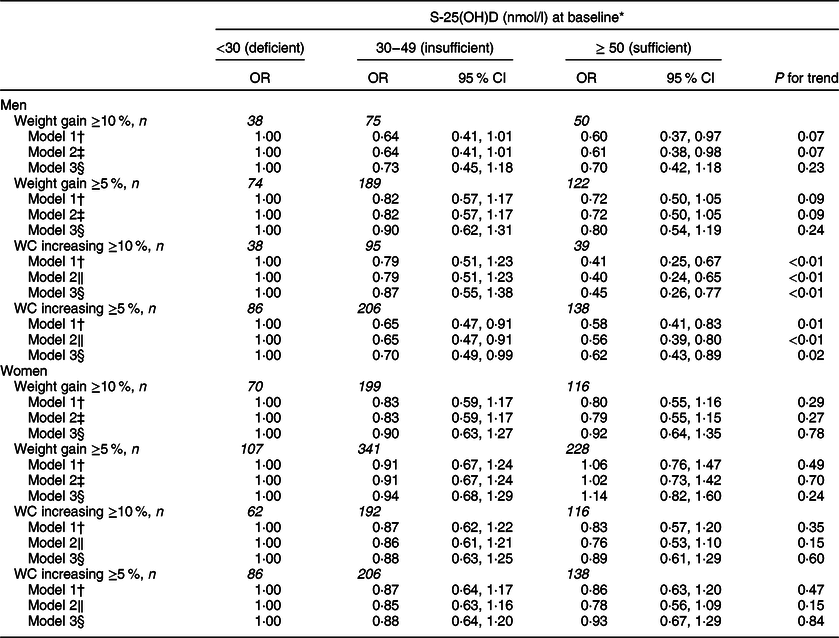
P value for interaction between sex and S-25(OH)D at baseline <0·001 for ≥10 % increase in waist circumference.
WC, waist circumference.
* Men: deficient, n 196; insufficient, n 652; sufficient, n 494; women deficient, n 221; insufficient, n 815; sufficient, n 546.
† Adjusted for age (30–39, 40–49, 50–59, 60–69, 70–79) at baseline.
‡ Adjusted for age (30–39, 40–49, 50–59, 60–69, 70–79) at baseline and weight at baseline (continuous).
§ Adjusted for age (30–39, 40–49, 50–59, 60–69, 70–79) at baseline, marital status (being married v. other), education (high education v. other), leisure-time physical activity (yes, no), smoking (yes, no), moderate (in men 1–199 g/week, in women 1–99 g/week) alcohol consumption (yes, no) at baseline.
‖ Adjusted for age (30–39, 40–49, 50–59, 60–69, 70–79) at baseline and waist circumference at baseline (continuous).
In women, vitamin D status at baseline predicted neither weight gain (OR for the categories of sufficient v. deficient vitamin D status 0·80 95 % CI 0·55, 1·16; P for trend 0·29) nor increase in waist circumference (OR for the categories of sufficient v. deficient vitamin D status 0·83 95 % CI 0·57, 1·20; P for trend 0·35) (Table 2). Adjusting for relevant confounders changed the estimates only minimally.
Repeating the main analysis concerning ≥10 % weight gain and ≥10 % increase in waist circumference during the follow-up by including the season of blood sampling in the models did not notably change the results neither in men nor in women (Supplementary Table 1).
The results were parallel when analysing the data with linear regression models and using the continuous change in weight or waist circumference as an outcome variable (Supplementary Table 2). In men, there was an inverse association between vitamin D status at baseline and increase in waist circumference during the follow-up also after controlling for the potential confounders (P for trend 0·01). When focusing on weight gain in men, the association was slightly weaker but remained statistically significant (P for trend 0·01). In women, there were no significant associations between vitamin D status at baseline and weight gain or increase in waist circumference during the follow-up.
Discussion
Major findings
The present prospective population-based study showed that insufficient vitamin D status at baseline predicted the increase in waist circumference in men during the 11-year follow-up. This association remained significant also after adjustment for sociodemographic and lifestyle factors. Further, in men, there was a borderline significant association between low vitamin D status at baseline and weight gain during the follow-up when adjusted for age only. This association was further attenuated after adjustment for potential confounders. In women, vitamin D status at baseline did not predict weight gain or increase in waist circumference during the follow-up.
Regarding weight gain, our results are in line with a previous prospective study carried out among older women in the USA which concluded that vitamin D status at the baseline was not associated with the change in weight during 5-year follow-up(Reference LeBlanc, Rizzo and Pedula14). Further, Vogt et al.(Reference Vogt, Zierer and Laxy24) have found that in a German cohort of older adults, S-25(OH)D at baseline was not associated with overall weight change during 3-year follow-up either men or women. However, they found that vitamin D status was inversely associated with ≥3 % body fat gain, measured by bioelectrical impedance analysis, during the follow-up in women, but not in men(Reference Vogt, Zierer and Laxy24).
Abdominal obesity is associated with many harmful health effects(Reference Huxley, Mendis and Zheleznyakov25). We found that in men, low vitamin D status at baseline was a significant predictor of increase in waist circumference, an indicator of abdominal obesity. There are some suggestions of biological mechanisms which may support this finding. First, the presence of vitamin D receptors (VDR) in adipose tissue and its ability to synthesise 1,25-dihydroxyvitamin D, the active form of vitamin D, suggest that vitamin D may have some role in the regulation of adipose tissue(Reference Earthman, Beckman and Masodkar4). Second, one possible mechanism is that vitamin D may have anti-obesity effects by affecting the gene expression related to adipocyte differentiation, lipolysis and lipogenesis(Reference Earthman, Beckman and Masodkar4). On the other hand, some researchers have suggested that other factors, such as elevated parathormone (PTH) concentration, which are linked with both low vitamin D status and increased risk of obesity, may explain the association(Reference Earthman, Beckman and Masodkar4). We have no explanation for our finding that the results were significant only for men, but not for women. In contrast to our results, Mai et al.(Reference Mai, Chen and Camargo9) have found a similar inverse association, defined by both BMI and waist circumference, in both sexes. Further, Lehtinen-Jacks et al.(Reference Lehtinen-Jacks, Leu Agelii and Hunsberger26) have found among middle-aged Swedish women that observed inverse association between vitamin D status and waist-to-hip ratio at baseline persisted but did not increase during the 32-year follow-up.
Thus, the evidence on the association between vitamin D status and obesity is still controversial. However, there are also some challenges when comparing the results from studies based on differentially selected subpopulations according to sex (e.g. ref. Reference LeBlanc, Rizzo and Pedula14), age (e.g. ref. Reference LeBlanc, Rizzo and Pedula14) or ethnic subgroup (e.g. ref. Reference Young, Engelman and Langefeld13). Also the measures of obesity vary widely between the studies and both continuous outcomes (e.g. ref. Reference Young, Engelman and Langefeld13) and incidence of obesity with different cut-off points have been used (e.g. ref. Reference Mai, Chen and Camargo9). One challenge in our study was to find the ideal cut-off points for our outcome variables. We decided to use ≥5 and ≥10 % cut-offs based on the recommendation that 5–10 % weight loss offers health benefits(22). However, we found similar results when analysing the data with linear regression model using continuous outcome variables. Furthermore, although we found in men the inverse association between vitamin D status and increase in waist circumference also after adjustment for sociodemographic and lifestyle factors, there is still a possibility of residual confounding. In previous studies, vitamin D status has shown to be associated with wide range of sociodemographic, lifestyle and metabolic health-related factors(Reference Jääskeläinen, Knekt and Marniemi27) suggesting the possibility that vitamin D is a biomarker of healthy lifestyle rather than independent risk factor for obesity.
Methodological issues
The strengths of the present study include a representative population-based sample which has been examined at two time points with the same reliable methods(Reference Heistaro15,Reference Lundqvist and Mäki-Opas16) . Weight and waist circumference were measured by trained nurses with standardised methods, and vitamin D status was determined based on S-25(OH)D concentrations reflecting both dietary intake and exposure to ultraviolet radiation. We also had a possibility to take into account a variety of potential confounding and effect modifying factors.
As to limitations, the participation rate in 2011 was lower compared with 2000, especially among men, in younger age groups and among those with low education(Reference Härkänen, Karvanen and Tolonen20). However, we used the inverse probability weights that take into account the increased non-participation in our analyses to handle the missing data(Reference Härkänen, Karvanen and Tolonen20). In addition, it is well known that vitamin D status varies by season. In our study, the blood samples were collected from September 2000 to March 2001, and the mean S-25(OH)D concentrations were highest in September and lowest in February and March. However, the month of blood sampling did not meet the criteria of a confounding factor, because it was only associated with vitamin D status at baseline (exposure), but not with weight gain or increase in waist circumference (outcomes). Further, the month of blood sampling did not modify the association between vitamin D status at baseline and weight gain or increase in waist circumference (P for interactions >0·30). Thus, repeating the main analyses by including the season of blood sampling in the models 1 and 3 did not change the results, and we assume that seasonal variation may have only minor effects to the results. Further, it is also well-known that there is variation in results analysed with different assays when measuring vitamin D status(Reference Sempos, Vesper and Phinney28). The immunoassay methods for example typically overestimate the results 10–20 %(Reference Holick29). However, the original Health 2000 S-25(OH)D results determined by radioimmunoassay have been recently standardised according to Vitamin D Standardization Program (VDSP, protocol described in Cashman et al.(Reference Cashman, Dowling and Skrabakova30)). Only minor differences have been observed between the original(Reference Jääskeläinen, Knekt and Marniemi27) and standardised results(Reference Jääskeläinen, Itkonen and Lundqvist31). Furthermore, one potential limitation of our study is that we did not stratify the analyses according to vitamin D supplement use. This was due to the low prevalence (11 %) of vitamin D supplement users in Finland in 2000–2001 when H2000 was carried out(Reference Jääskeläinen, Itkonen and Lundqvist31). Finally, a systematic vitamin D fortification of fluid milk products and fat spreads was started in Finland in 2003 and was doubled in 2010. As a result, the vitamin D status of the Finnish adult population has improved after the H2000 blood samples were collected(Reference Jääskeläinen, Itkonen and Lundqvist31). However, the vitamin D status of the Finnish adult population had been low decades(Reference Kilkkinen, Knekt and Aro32) before the systematic fortification policy started. Further, the recommendation for the fortification levels was doubled in 2010 which was just before our follow-up time ended, and therefore the increased fortification is not likely to explain our results.
In conclusion, our findings suggest that vitamin D insufficiency may be a risk factor of abdominal obesity in men but not among women. In men, insufficient vitamin D status may also increase the risk of weight gain. Further studies are required to confirm the associations and examine potential mechanisms behind them. There is also a possibility that vitamin D is a biomarker of healthy lifestyle rather than a risk factor for obesity.
Acknowledgements
Financial support: The study was financially supported by Doctoral Programme in Population Health, University of Helsinki, Finland, Finnish Cultural Foundation and Juho Vainio Foundation. Conflict of interest: The authors declare no conflict of interest. Authorship: The author's contributions were as follows: T.J., S.M., A.L. study concept and design; S.M., A.L. supervision of the study; T.J., S.M., S.K., A.L. implementation of data; T.J. draft of the manuscript and statistical analysis; T.J., S.M., T.H., K.S., S.K., A.L. interpretation of data and critical revision of the manuscript. Ethics of human subject participation: The Health 2000 Survey was approved by the Ethical Committee for Research in Epidemiology and Public Health whereas the Health 2011 by the Coordinating Ethics Committee at the Hospital District of Helsinki and Uusimaa in Finland. Both studies were conducted according to the guidelines laid down in the Declaration of Helsinki. Written informed consent was obtained from all participants.
Supplementary material
For supplementary material accompanying this paper visit http://doi.org/10.1017/S1368980019004403.


