


Parent stress (e.g. food insecurity, parenting stress, distress, maternal stressors and financial strain) has been linked to higher child obesity risk (e.g. ( Reference McPhie, Skouteris and McCabe 1 – Reference Tate, Wood and Liao 7 )). Possibly, stress changes parents’ behaviour in ways that negatively impact children’s weight-related behaviour, such as lowering consumption of fruits and vegetables or increasing sedentary behaviour( Reference Lundahl, Nelson and Van Dyk 8 , Reference Park and Walton-Moss 9 ). According to an adapted Family Stress Model perspective, poverty (a significant stressor) could lead to parental depression, disrupting the interparent relationship, altering parenting behaviours such as beneficial feeding practices, and ultimately heightening child obesity risk( Reference Conger, Rueter and Conger 10 , Reference McCurdy, Gorman and Metallinos-Katsaras 11 ). Poverty and other stressors would likely lead to perceived stress as well, having similar downstream effects on the interparent relationship, a parent’s ability to maintain and enforce healthy parenting practices, and an increase in unhealthy child dietary intake and obesity risk. Thus, conceptually, the effects of ‘objectively’ stressful parent circumstances (i.e. stressors) on child obesity risk would be expected to mirror those of subjective perceived parent stress, which has been defined as the psychological experience of evaluating oneself as unable to meet the demands of an event or circumstance( Reference Cohen, Kessler and Underwood Gordon 12 ). However, environmental ‘objective’ stressors, perceived stress and biological stress responses may occur at different points along a stress process( Reference Cohen, Kessler and Underwood Gordon 12 ) and could have different impacts on child obesity risk( Reference Conger, Rueter and Conger 10 , Reference McCurdy, Gorman and Metallinos-Katsaras 11 ).
Little previous research has assessed unique effects of parent perceived stress separately from stressors and these studies have been limited by cross-sectional study designs. One study found that parents’ perceived stress was associated with 7 % higher odds of obesity in children aged 3–17 years, but the relationship became non-significant after adjusting for physical and environmental stressors (i.e. physical health, financial strain, family structure), psychological well-being (i.e. mental health) and other covariates( Reference Parks, Kumanyika and Moore 13 ). Another found that higher parenting stress (a specific type of perceived stress associated with the responsibilities of parenting) was not associated with child risk of obesity( Reference Walton, Simpson and Darlington 14 ). Yet it remains unknown whether an investigation over a longer time period would find similar results – parent stress could disrupt parenting practices in ways that accumulate over time, eventually impacting child obesity risk.
Parent perceived stress has been related to weight-related parenting practices and weight-related parenting practices have been linked to child obesity risk. Both parent perceived stress and parenting stress, specifically, have been associated with child-feeding styles (e.g. uninvolved, authoritarian, restrictive), less limiting of children’s television time and lower likelihood of children meeting physical activity guidelines, indicating that perceived stress may affect certain weight-related parenting practices( Reference Walton, Simpson and Darlington 14 – Reference Mitchell, Brennan and Hayes 16 ). The parenting practices of having rules about child diet, having restrictive rules (e.g. snacking or kitchen access) and family meal practices (e.g. less frequent family dinner) have been connected to both more frequent child consumption of fatty foods and higher BMI percentile or Z-score, but also to lower likelihood of consuming sugary foods( Reference Eisenberg, Ayala and Crespo 17 – Reference Verzeletti, Maes and Santinello 21 ). High consumption of added sugars, particularly from sugar-sweetened beverages, has been associated with child weight gain, obesity risk and risk for metabolic syndrome( Reference Rodriguez, Madsen and Cotterman 22 – Reference Keller and Della Torre 24 ). But whether parent rules could curb sugar intake – and possibly obesity risk – is unknown. Among adolescents and toddlers, restriction rules have been associated with lower consumption of soda and sweet foods like cookies( Reference Verzeletti, Maes and Santinello 21 , Reference Gubbels, Kremers and Stafleu 25 ). But one study found that while kindergarteners whose parents had restrictive rules did consume fewer sugary beverages, children did not consume fewer total added sugars; and they preferred sweeter-tasting beverages, possibly setting the stage for higher future consumption of sugary foods( Reference Liem, Mars and De Graaf 20 ). Thus, longitudinal studies are critical to understanding the interplay between parenting practices, child consumption of added sugars (particularly sugar-sweetened beverages) and child obesity risk. If parent perceived stress disrupts weight-related parenting practices, particularly those related to child sugar consumption, children’s risk for obesity could increase.
Despite evidence for the intermediary role of parenting practices, only one known study to date has tested a statistical mediation model of parent stress leading to changes in parenting practices and subsequent child obesity. That study found that lack of family rules, time demands and difficulty enforcing rules – all of which they considered to be objective stressors – decreased positive family meal practices, leading to higher child BMI Z-score; but perceived parent stress did not have this indirect effect( Reference Lytle, Hearst and Fulkerson 26 ). Yet that cross-sectional study did not test effects over time and examined only one parenting practice: arrangement of family meals. Further, they conceptualized lack of parent rules as a stressor, but there may be more upstream contributing factors, such as parent perceived stress, that compromise a parent’s ability to maintain and enforce rules, instead of lack of rules being stressors themselves. Finally, effects of parental stress on children’s waist circumference may differ from those on BMI. Waist circumference is an indicator of abdominal obesity( Reference Li, Ford and Mokdad 27 , Reference Spolidoro, Pitrez and Vargas 28 ) and consumption of added sugars, specifically from sugar-sweetened beverages, has been associated with abdominal adiposity among children( Reference Shearrer, Daniels and Toledo-Corral 29 , Reference Bigornia, LaValley and Noel 30 ). Taken together, these findings suggest that parent stress could contribute to child diet or obesity risk indirectly by changing relevant parenting practices, such as rules or family meal practices, but longitudinal mediated effects remain largely unstudied and mediated effects on child diet are unknown.
To address these gaps, the current study used longitudinal panel data from parent – child dyads to test a mediational model of the effects of parent perceived stress on parenting practices (i.e. parent rules and positive family meal practices) one year later and child waist circumference and added dietary sugar that year. We hypothesized that parent stress would be negatively correlated with parenting practices and positively correlated with child added sugar intake and child waist circumference (Hypothesis 1); and that higher perceived parent stress would predict: greater increases in child waist circumference and consumption of added sugars over one year (Hypothesis 2); lower parent rules about child diet and positive family practices, which in turn would predict higher child waist circumference via the mediational pathway (Hypothesis 3); and lower parent rules about child diet and positive family practices, which in turn would predict higher child consumption of added sugars via the mediational pathway (Hypothesis 4).
Methods
Participants
Participants were from a larger 5-year, matched-control trial called Healthy PLACES, investigating effects of the built environment on child obesity risk in a smart growth community( Reference Pentz, Dunton and Huh 31 , Reference Pentz, Dunton and Wolch 32 ). Participants lived in the smart growth community (treatment group) or one of the matched control communities (control group). Participant families included one parent and one child aged 8–14 years. Eligibility criteria were: (i) having one child enrolled in grades 4–8; (ii) living in Chino, California, USA or surrounding communities with their child; (iii) an ability to read English; and (iv) having an annual household income <$US 210 000. Parents gave written informed consent and children gave minor assent. The Institutional Review Board at the University of Southern California approved the study. Participants were 610 parent – child dyads, 599 of whom provided information on relevant study measures and comprised the analytic sample.
Procedures
Recruitment procedures have been reported in detail elsewhere( Reference Pentz, Dunton and Huh 31 – Reference Dunton, Liao and Kawabata 35 ). Data were collected either at a local community site or participants’ homes. Participants completed all measures on a paper survey at two time points. Measures were not adapted for the present study to allow comparability of findings across studies. Baseline data were collected between March 2009 and December 2010 (time 1; T1), during which no data collection occurred from late July through August or during January due to extreme heat and rainy weather conditions, respectively, limiting outside activity in Southern California during those months. The second wave of data collection occurred between 6 and 12 months after baseline (time 2; T2).
Measures
Demographics
Parents and children provided the following information: parent gender, child age, child ethnicity and free/reduced-price school lunch status. These demographic characteristics were included as covariates in the model for the following reasons. Evidence indicates that children’s risk for obesity tends to mirror that of their same-sex parent (e.g. sons mirror fathers), suggesting the link has an environmental basis rather than genetic( Reference Perez-Pastor, Metcalf and Hosking 36 ). Child age was calculated based on the child’s birth day, month and year. Older children may be less susceptible to the effects of parent stress as peers or media begin to play a more influential role in dietary choices( Reference Cullen, Baranowski and Rittenberry 37 ). Ethnicity was collapsed into Hispanic v. non-Hispanic due to a sizeable proportion of Hispanic participants in the research population. Free/reduced-price school lunch status was used as a proxy measure of socio-economic status, as income or education could affect parent stress or parenting behaviours, although findings are mixed( 38 – Reference Santiago, Zazpe and Cuervo 40 ).
Child measures
Block Kids’ Dietary Screener
The NutritionQuest Block Kids’ Dietary Screener for children aged 2–17 years was used to assess child dietary intake ‘over the last week’( Reference Hunsberger, O’Malley and Block 41 ). The Screener has been validated against a 24 h recall method for use in adolescents for whole grains and meat/fish/poultry consumption. It is a brief measure that is useful for field-based data collection when clinical methods, such as weighed plate waste, are not available( Reference Comstock, Pierre and Mackiernan 42 ). All added sugars were consistent with those in the US Department of Agriculture’s My Pyramid Equivalents Database( Reference Bowman, Friday and Moshfegh 43 ), which includes sugars from condiments like ketchup. Standard adjustments to dietary variables were made; thus, total added sugar was adjusted to reflect the number of teaspoons of added sugars per 1000 kcal consumed ((total teaspoons of added sugar/total daily kcal)×1000; 1 kcal=4·184 kJ). Screening and cleaning procedures are described in the data analysis section.
Child waist circumference
Child waist circumference was measured in duplicate using a flexible tape measure. An average of the two measures was calculated. Waist circumference has been highly correlated with BMI as an indicator of obesity but may be a better indicator of child abdominal obesity and adult metabolic syndrome( Reference Li, Ford and Mokdad 27 , Reference Spolidoro, Pitrez and Vargas 28 ) and has been associated with consumption of added sugars such as fructose( Reference Shearrer, Daniels and Toledo-Corral 29 , Reference Bigornia, LaValley and Noel 30 ).
Parent measures
Parent perceived stress
The four-item version of the Cohen Perceived Stress scale was used to assess parent stress in the past 30 d( Reference Cohen, Kamarck and Mermelstein 44 ) (for items, see Table 1). Two items were reverse-coded and a sum of the four items was calculated to create an overall stress score, consistent with the validation study( Reference Cohen, Kamarck and Mermelstein 44 ). The scale has been widely used and validated( Reference Cohen, Kamarck and Mermelstein 44 – Reference Nast, Bolten and Meinlschmidt 46 ). The four-item scale has been found to have somewhat lower internal validity than the full fourteen-item scale, but it has demonstrated acceptable reliability and is recommended for use when there is a need to minimize participant burden, as there was in the current study( Reference Cohen, Kamarck and Mermelstein 44 , Reference Nast, Bolten and Meinlschmidt 46 ). Internal reliability was shown to be acceptable in this sample at baseline and follow-up (T1, α=0·73; T2, α=0·74)( Reference Cohen, Kamarck and Mermelstein 44 ).
Table 1 Items for parent measures used in the present study
Response options for perceived stress: 1=‘never’, 2=‘almost never’, 3=‘sometimes’, 4=‘fairly often’, 5=‘very often’. Response options for parent rules about child eating: 1=‘strongly disagree’, 2=‘disagree’, 3=‘neutral/mixed’, 4=‘agree’, 5=‘strongly agree’. Response options for positive family meal practices: 0=‘never’, 1=‘rarely’, 2=‘sometimes’, 3=‘frequently’, 4=‘always’. Response options for anhedonia: 1=‘rarely or none of the time’ (0–1 d), 2=‘some or a little of the time’ (2–3 d), 3=‘occasionally or a moderate amount of the time’ (4–5 d), 4=‘most or all of the time’ (6–7 d).
Parent rules about child eating
Three items from the Lack of Family Rules scale assessed whether parents had rules about child eating and communicated these rules and their consequences to children( Reference Lytle, Hearst and Fulkerson 26 ) (for items, see Table 1). These items have also been used successfully in prior research( Reference Hearst, Sevcik and Fulkerson 47 ). Higher scores indicate more agreement with having, communicating and explaining rules; and the scale showed high internal reliability in the present sample (T1, α=0·84; T2, α=0·85).
Positive family meal practices
Five items from the Midwestern Prevention Project were averaged to create an overall score for frequency of positive family meal practices in the past 30 d( Reference Gattshall, Shoup and Marshall 48 , Reference Pentz, Mihalic and Grotpeter 49 ) (for items, see Table 1). Higher scores indicated more frequent use of positive family meal practices. Internal reliability was somewhat low (T1, α=0·64; T2, α=0·61).
Anhedonia
Anhedonia was included as a covariate in the statistical model. Anhedonia is a reduced or low ability to experience positive affect and is a subcomponent of depression( Reference Leventhal 50 ). Maternal depression may increase a child’s risk for obesity and could confound the relationship with stress( Reference Ramasubramanian, Lane and Rahman 51 , Reference Topham, Page and Hubbs-Tait 52 ). Parent emotion and negative affectivity may affect the parent – child interaction during feeding of fruits and vegetables( Reference Hughes, Power and Fisher 53 ), and adult anhedonia has been associated with quitting a weight-loss intervention programme, less weight lost, binge eating, uncontrolled eating and emotional eating( Reference Keranen, Rasinaho and Hakko 54 , Reference Komulainen, Keranen and Rasinaho 55 ). Anhedonia has been shown to be inversely associated with walking and moderate and vigorous physical activity( Reference Leventhal 50 ). Anhedonia was measured using the four-item positive affect subscale of the Center for Epidemiologic Studies Depression scale( Reference Radloff 56 ) (for items, see Table 1). Responses were reverse-coded and averaged for an overall score.
Data analysis
Composite scores, descriptive statistics and Pearson product – moment correlations were calculated and examined for outliers, skewness and kurtosis. Cross-sectional correlations were calculated between all variables at T1; and correlations were calculated between the predictor (i.e. parent stress) at T1, the hypothesized parenting practice mediators (i.e. rules and family meals) at T2 and the outcomes (i.e. child waist circumference, child added sugar intake) at T2. Mean differences in study variables between T1 and T2 were tested using paired t tests. Dietary data were screened and cleaned as follows. Outliers of below 2092 kJ/d (500 kcal/d) and above 33 471 kJ/d (8000 kcal/d) were flagged as possible errors( Reference Willett 57 ). Raw distributions were examined for any entries greater than or less than 3 sd from the mean. Means, sd, skew and kurtosis for dietary variables were examined, and BMI was used to cross-validate in cases where children indicated consuming more than 12 552 kJ/d (3000 kcal/d). Energy distributions were examined by age, ethnicity, BMI and socio-economic status.
For testing of the four study hypotheses, a path model was specified using Mplus( Reference Muthén and Muthén 58 ) with a Maximum Likelihood estimation with robust standard errors (i.e. ‘MLR’), which is robust to violations of multivariate normality( Reference Kline 59 , Reference Muthén and Muthén 60 ). Criteria used to assess model fit were: goodness-of-fit χ 2 P>0·05; comparative fit index (CFI)≥0·95; root-mean-square error of approximation (RMSEA)≤0·05 with the upper limit on the 90 % CI of ≤0·10; and standardized root-mean-square residual (SRMR) ≤0·08 (and individual correlation residuals ≤|0·10|)( Reference Kline 59 ). Standardized estimates are reported in Fig. 1. The mediational model included two time points adjusted for demographic characteristics and the baseline level of each mediator( Reference Cole and Maxwell 61 ). Four indirect (i.e. mediated) effects of parent stress were modelled: (i) the indirect effect of parent stress leading to parent rules leading to child waist circumference; (ii) parent stress leading to family meal practices, leading to child waist circumference; (iii) parent stress leading to parent rules, leading to child consumption of added sugars; and (iv) parent stress leading to family meal practices, leading to child intake of added sugars. Each indirect effect was the product of the effect of parent stress on one mediator (e.g. parent rules; a path) and the effect of that mediator on one outcome (e.g. child waist circumference; b path)( Reference Preacher and Hayes 62 ). Demographics, parent anhedonia and study group (i.e. treatment v. control community) were screened and included as covariates in the final model because they demonstrated an association (P<0·10) with the outcome.
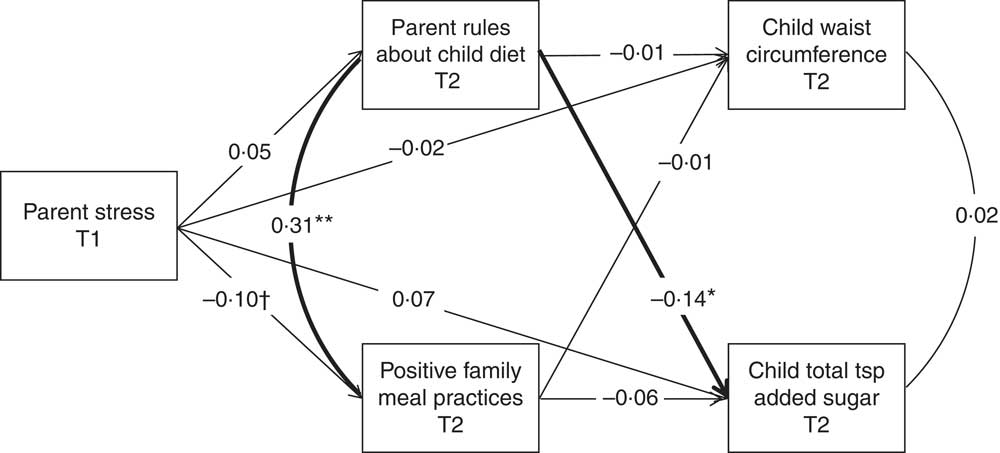
Fig. 1 Path model with parent stress at baseline (T1) predicting parenting practices and child waist circumference and added sugar intake one year later (T2) in a sample of Southern California adolescents. Model adjusts for child sex, age, ethnicity, free/reduced-price school lunch, group (treatment v. control), parent gender, parent anhedonia, and baseline levels of outcome and mediator variables. †P=0·06, *P<0·05, **P<0·01. χ 2(12)=19·00, P=0·09; comparative fit index=0·99; root-mean-square error of approximation=0·04 (95 % CI 0·00, 0·07); standardized root-mean-square residual=0·02; n 385
Results
Sample characteristics
Participant characteristics are shown in Table 2, including unadjusted means, sd, skewness, kurtosis, minimum and maximum. Parents in the study sample were mostly female (81 %), 39·2 (sd 6·00) years old, 70 % graduated from college and 51 % were Hispanic. The sample of children was 53 % male; 11·3 (sd 1·53) years old; 42 % Hispanic, 26 % Caucasian, 10 % Asian, 6 % African-American and 17 % Other; 31 % received free school lunches.
Table 2 Descriptive statistics for study variables
T1, time 1 (baseline); T2, time 2 (one year later).
Parent perceived stress, range: 4 (low) to 20 (high). Parent rules about child diet, range: 1 (strongly disagree) to 5 (strongly agree). Frequency of positive family meal practices, range: 0 (never) to 4 (always). Parent anhedonia, range: 1 (rarely or none of the time) to 4 (most or all of the time).
Child adiposity and diet
Child waist circumference at T1 was 74·86 (sd 12·55) cm (range 51·10–140·60 cm) and at T2 was 77·78 (sd 12·91) cm (range 52·50–146·55 cm); these differed significantly, as is expected for normal growth (Δ=T2−T1=2·97 (sd 7·49) cm; t=8·47, P<0·0001). The sample had a higher rate of obesity at T2 (9·2 %) compared with T1 (6·2 %; McNemar’s S(1)=7·54, P<0·01), defining obesity as age- and gender-adjusted waist circumferences above the 95th percentile( Reference Fryar, Carroll and Ogden 63 ). All variables had relatively normal distributions except for child consumption of added sugars at T2, which had skewness >2 and kurtosis >7; values this high have been found to be problematic in simulation models( Reference Curran, West and Finch 64 ), although others recommend higher cut-offs, such as skewness >3 and kurtosis >8 or 10( Reference Kline 59 ) (Table 2). Children consumed a little over 6 teaspoons of added sugar on average per 4184 kJ (1000 kcal) per d at T1 (sd 3·67 tsp; Table 2). The change in child consumption of added sugars from T1 to T2 was not significant (∆=T2−T1=−0·07 (sd 4·47) tsp; t=−0·31, P>0·05).
Parent stress and parenting practices
At T1, the average parent stress score was between the ‘almost never’ and ‘sometimes’ within the last month (mean 9·20 (sd 2·81); range 4–18; α=0·73); having positive family meal practices was between ‘sometimes’ and ‘frequently’ (mean 2·34 (sd 0·67); range 0–4); and the average parent agreement about having rules about children’s diet was between ‘neutral/mixed’ and ‘agree’ (mean 3·63 (sd 0·84); range 1–5; see Table 2). Parent stress (∆=T2−T1=0·17 (sd 2·59), t=1·37), parent rules (∆=T2−T1=−0·07 (sd 0·81), t=−1·75) and positive family meal practices (∆=T2−T1=0·02 (sd 1·65), t=0·72) did not change significantly between time points (P>0·05).
Correlations among parent stress, parenting practices, child consumption of added sugars and child waist circumference
Table 3 shows bivariate cross-sectional correlations among study variables at T1, and correlations between parent stress at T1 and parent rules, family meal practices, child added sugar intake and child waist circumference at T2. In line with Hypothesis 1, parents with higher stress at T1 had fewer rules about child eating (r=−0·11, P<0·01), fewer positive family meal practices (r=−0·09, P<0·05) and children with larger waist circumferences at T1 (r=0·09, P<0·05) but not T2 (r=0·02, NS; see Table 3). At T1, higher parent rules about diet were correlated with greater positive family meal practices (r=0·31, P<0·001) and fewer teaspoons of added sugars at T1 (r=−0·16, P<0·01). However, child teaspoons of added sugars at T1 were not significantly correlated with child waist circumference at T1 (r=−0·05) or T2 (r=−0·01).
Table 3 Bivariate correlations among study variables

T1, time 1 (baseline); T2, time 2 (one year later).
Child gender: 1=boy, 2=girl. Parent gender: 1=female, 2=male.
*Correlation is significant at the 0·05 level (two-tailed).
**Correlation is significant at the 0·01 level (two-tailed).
Model results for direct and indirect effects of perceived stress on parenting practices and change in child waist circumference and added sugar intake
The path model is shown in Fig. 1. The model fit the data well except for the χ 2 statistic, which was expected to be large due to the high number of observations: χ 2(12)=19·00, P=0·09; CFI=0·99; RMSEA=0·04 (95 % CI 0·00, 0·07); SRMR=0·02; n 385.
Contrary to Hypothesis 2, parent stress at T1 did not significantly predict child waist circumference (β=−0·02, NS) or child consumption of added sugars (β=0·07, NS) at T2. Contrary to Hypothesis 3, the indirect effect of parent stress on child waist circumference at T2 was not significant through parent rules (indirect effect=−0·001 (se 0·005), P=0·81) or positive family meal practices (indirect effect=0·005 (se 0·012), P=0·68). Contrary to Hypothesis 4, the indirect effect of parent stress on child added sugar intake at T2 was not significant through parent rules (indirect effect=−0·009 (se 0·014), P=0·51) or through positive family meal practices (indirect effect=0·008 (se 0·008), P=0·33). However, parent rules at T2 were significantly associated with lower child consumption of added sugars at T2 (β=−0·14, P=0·02) and positive family meal practices at T2 (r=0·31, P<0·0001). A post hoc median split (median=3·67) of parents into high v. low rules revealed that children of ‘high rules’ parents consumed 5·43 teaspoons of added sugar per 4184 kJ (1000 kcal) per d on average compared with ‘low rules’ parents (6·59 tsp/4184 kJ (1000 kcal) per d), which differed significantly (Satterthwaite t test for unequal variances t(395·12)=3·26, P<0·01).
Discussion
Higher parent stress was cross-sectionally correlated with fewer parent rules, fewer positive family meal practices and higher child waist circumference. However, in contrast to hypotheses, the longitudinal model results indicated that higher parent stress did not indirectly affect child waist circumference or added sugar intake through parent rules or family meal practices. Yet, parent rules about child diet were associated with lower child consumption of added sugars. While these findings support a connection between parents’ perceived stress and weight-related parenting practices, prospective effects on child obesity risk were not observed. Future research with larger samples is needed to test multiple weight-related parenting practices as well as potential feedback loops, such as child obesity leading to parent stress or to changes in parenting practices.
The present study addressed two gaps in the literature. First, the effect of subjective, perceived stress on parenting practices and child obesity risk was examined in contrast to previous work which has focused mainly on external, ‘objective’ stressors( Reference Walton, Simpson and Darlington 14 , Reference Bauer, Hearst and Escoto 65 ). Previous research has shown that circumstances such as poverty or experiencing challenging situations like divorce may reflect difficult family settings that undergird health disparities in obesity. Thus, it was important to investigate whether perceived stress, which would be assumed to co-vary with stressors, showed the same relationship. Previous work indicated an association between parent stress and physical activity parenting( Reference Walton, Simpson and Darlington 14 ), supporting the current finding with diet-related parenting practices. Yet previous studies have not found a significant link between perceived stress and child BMI( Reference Parks, Kumanyika and Moore 13 , Reference Walton, Simpson and Darlington 14 ). Instead of BMI, the current study examined effects on child waist circumference, finding a significant correlation that became non-significant after accounting for other strong influences such as free school lunch status and ethnicity. The fact that the null findings regarding child obesity risk are consistent with two other studies suggests that objective stressors and perceived stress operate differently on child obesity risk. Stress that parents experienced in the last month (as measured by the Cohen Perceived Stress scale( Reference Cohen, Kamarck and Mermelstein 44 )) may dissipate too quickly to contribute to children’s obesity risk over one year, but whether parent perceived stress that accumulates chronically over that year could affect weight-related practices during the year, ultimately heightening child obesity risk, remains unknown. Overall, findings indicate that parent perceived stress tends to be related to having heavier children but, alone, does not increase child obesity risk in the way that enduring objective stressors does.
Second, the study sought to elucidate the processes by which perceived parent stress could affect child added sugar intake, specifically through fewer parent rules or fewer positive family meal practices. In this sample, parent perceived stress was correlated with fewer parent rules and positive family meal practices, but the effects were small and became non-significant after adjusting for other influences such as child age, gender and parent anhedonia. The timing of measures may be an explanation for the lack of significant findings. The measure of perceived stress was retrospective over the past month, but the measures of parenting practices were static indicators of whether parents had any rules or tended to have regular meals. If the effects of perceived stress operate on a much more proximal scale – if a particularly stressful day increases a mother’s likelihood of purchasing high-sugar convenience foods that day – the current study would not necessarily capture that link. Thus, studies are needed to assess within-daily effects of perceived and objective stressors on child weight-related behaviours and accumulated obesity risk over time. In sum, parent perceived stress may have a small effect on weight-related parenting practices but findings were inconclusive, and future research with larger sample sizes and more proximate measures is needed.
Child waist circumference in this sample at baseline was slightly higher than national 2007–2010 estimates for 11-year-old males (71·9 cm) and females (73·2 cm)( Reference Fryar, Carroll and Ogden 63 ), which may align with the fact that the sample was deliberately drawn to oversample Hispanic families, which have higher rates of child obesity( Reference Ogden, Carroll and Kit 66 ). Children consumed about 6 teaspoons of added sugar per 4184 kJ (1000 kcal) per d; this is lower than one estimate of nationwide intake, 9·63 teaspoons per 4184 kJ (1000 kcal) per d,Footnote * but the Block Kids’ Dietary Screener may underestimate added sugar( Reference Hunsberger, O’Malley and Block 41 , Reference Ervin, Kit and Carroll 67 ). Additionally, the American Heart Association recommends less than or equal to ≈6 teaspoons of added sugar daily, which is 3·2 teaspoons per 4184 kJ (1000 kcal) at a daily energy intake of 7950 kJ (1900 kcal; the middle of the range recommended for children aged 9–13 years)( 68 , Reference Vos, Kaar and Welsh 69 ). While previous studies indicate an association between higher parent rules and lower child sugar consumption( Reference Gubbels, Kremers and Stafleu 18 , Reference Liem, Mars and De Graaf 20 , Reference Verzeletti, Maes and Santinello 21 ), cross-sectional studies cannot untangle whether parents create rules because their children consume too many added sugars or whether parent rules cause children to consume less sugar. The current longitudinal findings shed some light on this question, suggesting that parent rules could lead to lower sugar consumption, if not lower abdominal obesity, over time. Because measures of parent rules and sugar consumption were measured at two time points, baseline levels could be controlled for in the analysis, which is an advantage over cross-sectional designs. However, this interpretation rests on the assumption that the magnitude of the effect of parent rules on child consumption of added sugars between T1 and T2 in the present study would be the same as the magnitude between T2 and a (hypothetical) T3( Reference Cole and Maxwell 61 ). Thus, a future study with three time points would strengthen this interpretation.
Finally, the present study contributes to the discussion on the effects of parent dietary rules on child diet and weight where prior research reveals counterintuitive, conflicting results. While rules have been associated with lower consumption of added sugar and sugary beverages, dietary restrictions are also associated with child weight gain and overweight( Reference Hauser, Economos and Nelson 19 , Reference Clark, Goyder and Bissell 70 ). This is counterintuitive because lower sugar intake would be expected to lead to lower obesity risk, not higher. Restrictive rules could curb present consumption of sweets but increase taste preference for sweetness( Reference Liem, Mars and De Graaf 20 ) or hinder children’s ability to develop self-regulatory control over eating behaviour, at least in girls( Reference Birch and Fisher 71 ). One study has found that parent rules lower the risk of overweight( Reference Lytle, Hearst and Fulkerson 26 ). One reason for the discrepancies is different measures of parent rules. The current study assessed rules that were clearly explained to children along with the consequences of not following those rules, but specific motivations or intentions behind those rules were not measured. In contrast, the bulk of experimental and longitudinal evidence implicating maternal restriction of palatable foods in child weight gain tends to measure specific cognitions relating to a perceived need to control the child’s impulses and access to food (e.g. ( Reference Clark, Goyder and Bissell 70 , Reference Birch, Fisher and Grimm-Thomas 72 )). Results from the current study support previous findings that rules unrelated to these specific types of cognitions may lead to lower sugar consumption but not necessarily affect obesity risk.
Limitations
The current study assessed the weight-related parenting practices of rules about eating and family meal practices, but other practices not measured here may be correlated with parent stress or have stronger effects on child obesity risk. For example, understanding specific rules about how or what the child eats may help uncover which rules actually lead to changes in child obesity risk, suggesting a moderating, rather than mediating, effect of parenting practices. The positive family meal practices indicator had low internal reliability in this sample, suggesting that an alternative measure may better capture these practices in similar samples. Physical activity parenting was not measured in the current study but could be affected by parent stress, accumulating into changes in waist circumference over time. Other facets of weight-related parenting, such as restrictive feeding practices, may also interact with parent perceived stress to influence child weight. A second limitation is the time frame: two waves of data measured over one year. In this type of model, the significance test for the mediational effect of M on Y (the c path) can only indicate partial mediation, not full mediation. However, our study did not find evidence of mediation (i.e. the indirect effects were non-significant), so there was no question of whether M fully, or only partially, explained the relationship between X and Y( Reference Cole and Maxwell 61 ). Additionally, effects of parent stress on parenting practices and child health behaviour could occur within very short time frames – perhaps even within the day – while changes in waist circumference develop over a much longer time. Yet, the time frame of the present study would mask those effects. Third, while the present study contributes to our understanding of perceived stress, objective stressors were not studied. Hence, direct comparisons between effects of perceived v. objective stressors – or how they interact – could not be investigated. Further research is needed that contextualizes perceived stress within the context of objective stressors and examines potential effects on parenting practices, child dietary intake and obesity risk. Fourth, the study population was not nationally representative, and findings may have been influenced by more highly educated parents or features of the Southern California environment. Finally, methodological limitations such as a lack of power may have contributed to the non-significant overall model, suggesting that studies with larger samples or repeated measures on within-daily effects may be needed to understand these relationships.
Conclusion
The times in life when parents perceive themselves to have inadequate control over their lives and to feel worried – when they experience perceived stress – may not relate to the parenting practices they engage in later or their children’s subsequent obesity risk. Parent perceived stress does not seem to impact child obesity risk the way parents’ external stressors, such as poverty, do. These findings suggest that child obesity prevention efforts are likely to have a greater impact if they alleviate challenging circumstances in which families find themselves rather than decreasing the experience of perceived stress per se. Further, these findings support efforts to educate and support parents in clearly communicating rules for their children’s diets as a possible means of decreasing consumption of added sugars to levels more aligned with recommendations. Future longitudinal research is needed to examine effects of specific rules and other parenting practices on child dietary intake, and other potential mediating influences, to explain the link between external stressors that parents experience and child obesity risk.
Acknowledgements
Financial support: This work was supported by a National Institutes of Health Cancer Control and Epidemiology Research Training Grant (Principal Investigator M.A.P., grant number 5 T32 CA 009492); and the American Cancer Society (Principal Investigator G.F.D., grant number #118283-MRSGT-10-012-01-CPPB). The funders had no role in the design, analysis or writing of this article. Conflict of interest: None to report. Authorship: Authors’ contributions were as follows. E.T.S.: conceptualization of the research question, data analysis, writing of the manuscript. G.F.D.: study design, conceptualization of the research question, data analytic planning, editing of the manuscript. C.-P.C.: data analytic planning and supervision, editing of the manuscript. A.M.L.: conceptualization of the research question and analysis plan, editing of the manuscript. R.B.: conceptualization of the research question and analysis plan, editing of the manuscript. M.A.P.: study design, supervision of carrying out the study, conceptualization of the research question, editing of the manuscript. Ethics of human subject participation: This study was conducted according to the guidelines laid down in the Declaration of Helsinki and all procedures involving human subjects were approved by the University of Southern California Institutional Review Board. Written informed consent or child assent was obtained from all subjects.


