


CVD, including stroke, is the leading cause of mortality among adults. According to the WHO, 6·7 million deaths were due to stroke in 2015, and the European Heart Network estimated that stroke causes close to one million deaths in Europe each year(1–Reference Wilkins and Wilson3). The incidence of stroke is increasing globally, and as more people survive a stroke to live with life-long consequences(Reference Feigin, Krishnamurthi and Parmar4), the burden of disease is expected to increase in the years to come(Reference Feigin, Krishnamurthi and Parmar4,Reference Langhorne, Bernhardt and Kwakkel5) . Prevention is, therefore, imperative to reduce the risk of stroke and thereby the burden that stroke imposes on healthcare systems and on the individual.
One of the prominent modifiable risk factors for stroke is diet, which is also important in developing other conditions known as risk factors for stroke, such as hypertension, hypercholesterolaemia and diabetes mellitus(1,Reference Mackay and Mensah6–8) . So far, no clear association has been found between any single food or nutrient and risk of stroke(Reference Sherzai, Heim and Boothby9). A review by Sherzai showed that the associations between single foods and risk of stroke differed depending on the study population. This could be due to the complexity of dietary preferences and complicated interactions between foods that are not accounted for by examining single foods, including cultural differences in overall dietary habits and food preparation(Reference Sherzai, Heim and Boothby9–Reference Moeller, Reedy and Millen15). To address this, dietary patterns can be derived using exploratory methods. These methods are data-driven and are used to identify patterns based on information on real dietary habits(Reference Krebs-Smith, Subar and Reedy14,Reference Moeller, Reedy and Millen15) . Frequently used exploratory methods include cluster and factor analysis. Cluster analyses derive groups of people with similar dietary habits and categorise individuals into mutually exclusive clusters(Reference Hu10,Reference Krebs-Smith, Subar and Reedy14,Reference Moeller, Reedy and Millen15) . Principal component analysis (PCA) is a factor analysis often used to create meaningful factors, or patterns, based on correlations between individual food groups. PCA uses all available food groups to describe the factors, resulting in patterns that are complex to interpret(Reference Hu10). The Treelet Transform (TT) is a recently developed exploratory method that combines the strengths of PCA and cluster analysis. Similar to PCA, TT uses the correlation matrix to derive factors based on most correlated foods; however, the factors produced by TT contain a smaller number of food groups and are thereby simpler to interpret(Reference Gorst-Rasmussen, Dahm and Dethlefsen13,16) . To date, very little is known about how TT-derived patterns relate to the risk of disease.
In a meta-analysis of studies that used cluster analysis, factor analysis or PCA to generate dietary patterns and to assess their associations with CVD(Reference Rodriguez-Monforte, Flores-Mateo and Sanchez17), ‘Prudent/Healthy’ patterns were associated with an inverse risk of coronary heart disease, but not statistically significantly with the risk of stroke. The ‘Western/unhealthy’ patterns were not consistently associated across global regions, such as North America/Europe and Asia. Hence, there could be different prevalent dietary patterns associated with the risk of CVD, and dietary patterns that share similarities across global regions are not consistently associated with disease development. This may be due to differing methodologies between studies, or true cultural differences in food habits. A dimension reduction method to derive dietary patterns that requires fewer investigator-driven decisions may aid in disentangling this.
Thus, the aims of this study were to use TT to identify dietary patterns that explained variations in dietary habits in this Danish population, and to examine the associations between these dietary patterns and the risk of stroke. Based on previous studies, we expected to identify two to three dietary patterns(Reference Rodriguez-Monforte, Flores-Mateo and Sanchez17–Reference Chan, Leung and Woo20), and that high adherence to any pattern, including foods recommended by the American Stroke Association, would be associated with a lower incidence of stroke(8).
Materials and methods
Study design and population
We used the Danish Diet, Cancer and Health cohort study. Men and women aged 50–64 years born in Denmark, living in the greater areas of Aarhus and Copenhagen and without any previous cancer diagnosis registered in the Danish Cancer Registry, were invited to participate in the study between December 1993 and May 1997. Participants were excluded if information on diet, covariates or enrolment date was missing, if the participant had previously had cancer unregistered at the time of invitation, or a stroke prior to enrolment.
At enrolment into Diet, Cancer and Health, participants filled in an FFQ and visited one of the study clinics. In the study clinic, a questionnaire on lifestyle factors and health was filled in and participants underwent a physical examination where anthropometrical measurements, such as weight, height and blood pressure, were taken and biological samples were collected(Reference Tjonneland, Olsen and Boll21).
Diet assessment
Prior to the study clinic visit, participants completed a self-administered, 192-item semi-quantitative FFQ, specifically developed for the Diet, Cancer and Health cohort. The FFQ contained questions relating to different beverages, foods and dishes, and participants reported how often within the past year they had consumed each food item within twelve categories, ranging from ‘never’ to ‘eight times a day’(Reference Tjonneland, Olsen and Boll21). The average daily intake of specific foods and nutrients was calculated for each participant using the software programme FoodCalc, using specifically developed standardised recipes and portion sizes(Reference Tjonneland, Olsen and Boll21,Reference Tjonneland, Overvad and Haraldsdottir22) . The development and validation of the FFQ has been described elsewhere(Reference Tjonneland, Overvad and Haraldsdottir22,Reference Overvad, Tjonneland and Haraldsdottir23) .
Each food item was grouped into larger food groups based on the general guidelines from the European Prospective Investigation into Cancer and Nutrition, of which the Diet, Cancer and Health study is a part(Reference Riboli, Hunt and Slimani24). Further groupings were made based on cultural considerations so that similar foods were aggregated into a total of thirty-one food groups.
Outcome: stroke
Possible stroke cases, ischaemic or haemorrhagic, which had occurred before 30 November 2009 were identified by linkage to the Danish National Patient Register based on the International Classification of Disease codes (ICD-8: 430, 431, 433, 434, 436.01 or 436.90; ICD-10: I60, I61, I63 or I64). Diagnoses were then verified by a physician with neurological experience, who reviewed all medical and discharge records(Reference Laursen, Dahm and Johnsen25).
Covariates
Potential confounders were selected a priori as established risk factors for stroke.
Information on sex, education, smoking, alcohol intake, physical activity and hypertension, hypercholesterolaemia and diabetes was obtained at baseline from the self-administered lifestyle questionnaire. In the questionnaire, participants stated their educational level after elementary school (none, short, medium and long), current smoking habits (never, former or current), how often they consumed alcohol, including beer, wine, spirits and fortified wine (never, <one occasion per month, one–three occasions per month, one occasion per week, two–four occasions per week, five–six occasions per week, daily) and their habitual leisure-time physical activities (hours per week engaged in walking, biking, housework, home maintenance, gardening and sports). Participants stated if they had hypertension, hypercholesterolaemia and diabetes mellitus, and if they were taking medications for these conditions, and the hypertension, hypercholesterolaemia and diabetes mellitus variables were constructed combining the responses to these questions.
Height and weight were measured by a lab technician during physical examination. Height was measured, to the nearest 0·5 cm, with the participant standing without shoes. Weight was measured, to the nearest 0·1 kg, using a digital scale, with the participant wearing light clothing or underwear. BMI was calculated as weight/height2 (kg/m2).
Statistical analysis
Dietary intake of each food group was adjusted for total energy intake by the residual method to prevent participants with a high energy intake from dominating the dietary patterns(Reference Willett26).
The Treelet Transform
Dietary patterns were exploratively generated using TT as described by Gorst-Rasmussen(Reference Gorst-Rasmussen, Dahm and Dethlefsen13,16) . TT is a dimension reduction method, based on the statistical principles of cluster analysis and PCA. Few investigator-led decisions are required to derive meaningful factors in a given dataset. The TT algorithm introduces sparsity in factor loadings, making many factor loadings exactly zero. This results in fewer variables (food groups) being included in each factor, compared to a PCA, and thereby simplifies the investigators’ interpretation of which variables are important contributors to the pattern. The TT algorithm locates the food groups with highest correlations and performs a local PCA. The two food groups are merged at the bottom of the cluster tree and replaced by a sum factor. Then a local PCA is performed on the sum factor and the next most correlated food group. The sum factor and the next most correlated food group are then replaced by a sum factor at the next level of the tree. This is repeated for all food groups, so that a local PCA is made for all the remaining correlations between food groups until all food groups are represented in the cluster tree. A sum factor is estimated at each level of the cluster tree representing a connection between included food groups. Selecting a cut level for the TT cluster tree amounts to choosing the level of detail desired in the dimension reduction of data. More variation can be explained at the cost of factor sparsity with a higher cut level. Here, a ten-fold cross-validation was used to define the optimal cut level for the cluster tree, that is, the point at which increasing the cut level does not substantially increase the variation of retained patterns.
The number of meaningful dietary patterns was decided at this cut level based on the increase in explained variation that another pattern could contribute with, compared to a single food group. To only identify meaningful patterns, the eigenvalue cut-off for the patterns was set to >1·25(Reference Slattery, Boucher and Caan27).
Within the generated patterns, a factor loading for each underlying food group was estimated based on the sum factor for the pattern itself.
The participants’ adherence to each dietary pattern (TT scores) was estimated as the average of their energy-adjusted intake of food groups contributing to the factor weighted by food group factor loadings. Positive scores indicated a larger-than-average intake of contributing food groups and vice versa. Participants were categorised into quintiles (Q) based on their adherence to each pattern. Independence between patterns was verified using Spearman's correlation.
Cox proportional hazard model
Cox proportional hazard models were used to estimate hazard ratios (HR) with 95 % CI for the association between adherence to dietary patterns and stroke. Age was used as the underlying timescale. Time at risk was defined as time from enrolment until an event – stroke, death by other cause, emigration or 30 November 2009, whichever came first. All analyses were stratified by quintiles of date of enrolment, since conditional independence between participants’ risk of stroke and date of enrolment was not confirmed. Model 1 was adjusted for age and total energy intake, and model 2 was further adjusted for potential confounders: educational level (none, short, middle long, and long), smoking (never, former and current), physical activity (>/<30 min/d), BMI (underweight – <18·5 kg/m2; normal weight – 18·5–24·9 kg/m2; overweight – 25–29·9 kg/m2) and obesity (≥30 kg/m2), together with self-reported hypertension, hypercholesterolaemia and diabetes mellitus (yes, no or unknown). Model 2 was additionally adjusted for alcohol intake (<one occasion per month, one–four occasions per month, two–four occasions per week, >four occasions per week), for dietary patterns not including alcohol.
HR were estimated for total stroke in men and women separately, to evaluate whether associations between dietary patterns and risk of stroke differed by sex. As this was an a priori decision, a test for effect modification on multiplicative scale was not performed. The proportional hazards assumption was assessed using log-log plots and global tests of proportional rates for dietary patterns during follow-up. A sensitivity analysis was performed after adjusting for smoking in five categories (never, former, current <15 g tobacco per day, 15–25 g/d, >25 g/d) instead of three, alcohol consumption as g/d, and physical activity expressed as hours per week instead of categorical variables.
A complete case analysis was conducted. All statistical analyses were conducted in Stata/IC 15.1. Two-sided P values ≤0·05 were considered statistically significant.
Results
A total of 160 725 Danish men and women were invited to participate in the Diet, Cancer and Health study, of which 57 053 (35·5 %) chose to participate. 55 061 were included in the present study. In total, 1992 participants were excluded (Fig. 1). During a median follow-up time of 13·5 years, 1357 verified incident stroke cases occurred among men and 901 cases among women. Compared to the cohort, stroke cases were more often male, had no education after elementary school, were overweight or obese, were smokers, drank alcohol daily, were less physically active and reported hypertension, hypercholesterolaemia and diabetes mellitus (Table 1).
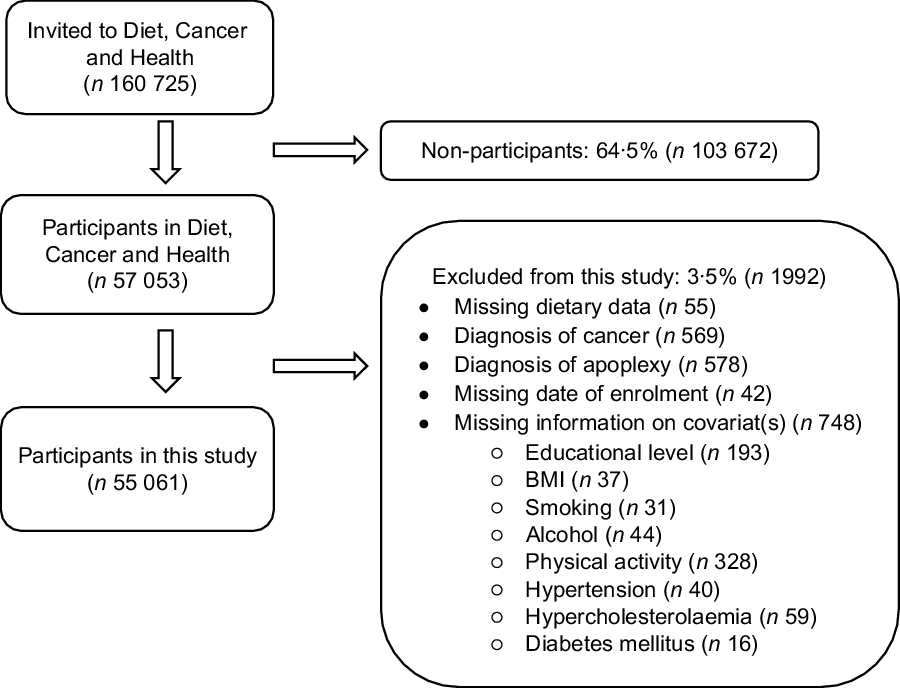
Fig. 1 Flowchart of Diet, Cancer and Health cohort and exclusion of participants from this study
Table 1 Baseline characteristics of study cohort and participants who developed stroke during follow-up

When conducting the TT analysis, the cross-validation showed an optimal cut level at fourteen for two to four patterns, at which level three patterns had eigenvalues >1·25. The correlation matrix for the thirty-one food groups with these three dietary patterns is illustrated in the cluster tree in Fig. 2. The cumulative variance in diet described by the three patterns was 15·4 %. The eigenvalue and variance of each pattern is shown in Table 2. The first pattern derived from TT, named Prudent, was characterised by a high intake of, for example, fish, fruit and vegetables. The second pattern was named Western and had a high intake of animal products, and the third pattern was named Wine & Snacks with a high intake of alcohol and salty snacks. Food groups represented in the dietary patterns as well as factor loadings for each food group are listed in Table 2.

Fig. 2 Cluster tree of food groups produced by Treelet Transform with three factors at cut level 14: T1 (Prudent), T2 (Western) and T3 (Wine & Snacks)
Table 2 Factor loadings for food groups within the derived dietary patterns from Treelet Transform analyses

The distribution of potential confounders across quintiles of the three dietary patterns is shown in Table 3. Participants with high adherence to the Prudent pattern were more often women, had longer education, were less likely to be smokers, drank alcohol more frequently, were more physically active and had hypertension, hypercholesterolaemia and diabetes mellitus compared to participants with low adherence. Within the Western pattern, participants with high adherence were more likely to be male, had shorter education, less healthy habits and hypercholesterolaemia and diabetes mellitus compared to participants with low adherence. Participants with high adherence to Wine & Snacks were more often male, had longer education, few were obese, more were previous smokers, more drank alcohol frequently and few had diabetes mellitus compared to participants with low adherence.
Table 3 Baseline characteristics of participants according to selected quintiles of derived dietary patterns

The associations between adherence to the Prudent, Western and Wine & Snacks patterns and stroke are shown in Table 4 (men) and Table 5 (women). The proportional hazards assumption could not be accepted, as the association with baseline dietary patterns changed over the complete follow-up time. To obtain proportional hazards, the follow-up time was, therefore, truncated at 10 years, during which 913 cases occurred among men and 600 cases among women.
Table 4 HR (95 % CI) for associations between adherence to dietary patterns and risk of total stroke in men, truncated at 10 years of follow-up

HR, hazard ratios.
* Model 1 is adjusted for age and total energy intake.
† Model 2 is further adjusted for education, smoking, alcohol (Prudent), physical activity, BMI, hypertension, hypercholesterolaemia and diabetes mellitus.
Table 5 HR (95 % CI) for associations between adherence to dietary patterns and risk of total stroke in women, truncated at 10 years of follow-up

HR, hazard ratios.
* Model 1 is adjusted for age and total energy intake.
† Model 2 is further adjusted for education, smoking, alcohol (Prudent), physical activity, BMI, hypertension, hypercholesterolaemia and diabetes mellitus.
In men, adherence to the Prudent pattern was associated with a lower risk of stroke after adjusting for confounders (Q5 v. Q1 HR 0·74, 95 % CI 0·60, 0·91). Point estimates in women were similar to those for men, but not statistically significant. High adherence to the Western pattern was associated with a greater risk of stroke in both men and women after adjusting for confounders (men: Q5 v. Q1 – HR 1·61, 95 % CI 1·23, 2·10; women: Q5 v. Q1 – HR 2·01, 95 % CI 1·48, 2·72).
Adherence to the Wine & Snacks pattern was weakly inversely associated with stroke in men (Q5 v. Q1 – HR 0·81, 95 % CI 0·67, 0·99), but not in women.
Sensitivity analyses with more fine-grained control for confounding showed no changes in associations (data not shown).
Discussion
In this large cohort study, three dietary patterns were derived based on information about 55 061 participants’ dietary intake. Adherence to a Prudent dietary pattern was associated with a lower risk of stroke among men, but not significantly so among women. High adherence to a Western pattern was associated with a greater risk for both men and women. Adherence to a Wine & Snacks pattern was associated with a slightly lower risk of stroke among men, but no association was found in women.
Our study has strengths and weaknesses. Risk of bias related to the selection of participants was unlikely in our study, thanks to the very limited loss to follow-up (0·6 % due to emigration).
Information about dietary intake was obtained through a semi-quantitative FFQ, which is a common choice of dietary instrument in large cohort studies(Reference Willett26). The FFQ used in this study has been validated in previous studies(Reference Tjonneland, Overvad and Haraldsdottir22,Reference Overvad, Tjonneland and Haraldsdottir23,Reference Tjonneland, Haraldsdottir and Overvad28,Reference Haraldsdottir, Tjonneland and Overvad29) . Some misclassification related to exposure is inevitable as dietary information was self-reported; however, recall-bias was likely to have been non-differential with respect to the outcome, resulting in an underestimation of associations. Based on previous studies, measurement error due to systematic underreporting as a function of total energy intake, underreporting of alcohol, and sex-dependent overreporting of healthy foods was expected(Reference Willett26,Reference Juul30) . To reduce the influence of measurement errors related to systematic underreporting of all food groups, participants’ intake of each food group was adjusted for total energy intake, making their intake relative rather than absolute. Nevertheless, over- or underreporting of specific food groups could have affected the generation of our dietary patterns, both in terms of which food groups were represented in the patterns and in the calculation of factor loadings for each food group. Thus, non-differential misclassification of adherence to the dietary patterns among participants with a high alcohol intake and sex-specific overreporting of healthy foods could have occurred. Overall, the dietary patterns may have included other foods if true intake had been available, but neither of these potential measurement errors or misclassifications are expected to be related to participants’ risk of stroke, as they occurred prior to incident disease. Therefore, these errors are most likely non-differential and would tend to underestimate the true associations.
Misclassification of outcomes in this study could only be non-differential with respect to the exposure, as the classification and verification of cases were obtained independently from knowledge about dietary intake. Verification through medical journals furthermore excluded false-positive cases(Reference Lühdorf, Overvad and Schmidt31). Thus, bias related to misclassification of outcome was minimised.
Adjusting for potential confounders, identified a priori, showed that these confounded the associations between dietary patterns and risk of stroke, but a further fine-grained adjustment did not alter the results. Nevertheless, residual confounding in this observational study cannot be ruled out.
The aim of this study was to describe dietary patterns explaining variations in actual dietary habits. For this purpose, an exploratory method such as TT is well suited. A strength of exploratory methods is their ability to account for the correlated combinations of foods, which are part of the cumulative effect of diet. Dietary patterns generated using PCA included all food groups, making the patterns complex and difficult to interpret. Using TT, we generated patterns that were easier to interpret due to their simplicity, compared to patterns generated with PCA. The dietary patterns generated in this study explained 15·4 % of variance in diets. This may seem low compared to the dietary patterns generated with PCA, which in other studies explained between 16 and 27 % of variance with two to three patterns; yet, Gorst-Rasmussen et al. found that TT described almost as much variation as PCA for the same number of patterns(Reference Gorst-Rasmussen, Dahm and Dethlefsen13). However, as the aim of this study was to explain the variance in diet, and not to generate patterns most correlated with disease, an outcome-independent method, rather than an outcome-dependent method, was chosen. Therefore, these patterns cannot be interpreted as patterns most associated with the risk of stroke(Reference Hu10,Reference Krebs-Smith, Subar and Reedy14) .
Using exploratory methods necessitates subjective choices made by the investigator(Reference Hu10,Reference Gorst-Rasmussen, Dahm and Dethlefsen13–Reference Moeller, Reedy and Millen15) . In this study, standardisation and cultural adaption of food groups, adjustment for total energy, the expected number of patterns generated, at what level the cluster tree was to be cut, and the naming of patterns were given a careful consideration. No separate patterns were derived for subgroups, as the study population was considered homogenous in relation to diets, and other studies have not found sex differences in dietary patterns(Reference Schulze, Hoffmann and Kroke11). The reproducibility and validity of exploratory-derived dietary patterns are often discussed, as knowledge on this subject is still insufficient(Reference Hu10,Reference Newby and Tucker12,Reference Moeller, Reedy and Millen15) . A disadvantage of these methods is that identical patterns can never be derived across different study populations, making the comparison of results difficult(Reference Krebs-Smith, Subar and Reedy14,Reference Moeller, Reedy and Millen15) . However, the patterns determined here had high loadings of food groups similar to those found in other studies(Reference Sherzai, Heim and Boothby9,Reference Newby and Tucker12,Reference Rodriguez-Monforte, Flores-Mateo and Sanchez17) . This indicates some reproducibility of exploratory-generated dietary patterns across study populations.
The proportional hazards assumption was not met in this study, perhaps because other age-related causes of stroke increased in importance over time(Reference Boehme, Esenwa and Elkind7), leading to changes in baseline hazards, or because participants’ dietary habits changed during follow-up. Thus, participants’ adherence to dietary patterns at enrolment probably does not reflect their true exposure across the entire follow-up period, and an HR for the entire follow-up time would have been deceptive. However, our literature review did not observe a cut in follow-up time in any other studies of long follow-up using baseline dietary measurements. This phenomenon may, therefore, depend on the specific dietary exposure under study. Truncating follow-up at 10 years ensured that model assumptions were met but decreased the number of incident cases for analyses to 1513 over 10 years.
In this study, we found inverse associations between adherence to a Prudent pattern and risk of stroke, which has also been found by others using exploratory-derived patterns. For example, Fung et al. and Stricker et al. found similar patterns consisting of high intakes of fruit, vegetables, whole grains, fish and poultry that were associated with a lower risk of stroke (HR 0·78, 95 % CI 0·61, 1·01; and 0·69, 95 % CI 0·53, 0·88, respectively)(Reference Stricker, Onland-Moret and Boer19,Reference Fung, Stampfer and Manson35) .
Comparing the dietary patterns derived by other studies, the recurrent food groups in a Western pattern are red and processed meat(Reference Rodriguez-Monforte, Flores-Mateo and Sanchez17,Reference Fung, Stampfer and Manson35,Reference Larsson36) , but apart from meats, the important food groups within Western-type patterns differed between studies. Unsurprisingly, the associations between Western/unhealthy patterns and stroke also vary. In a meta-analysis by Rodriguez-Monteforte, no associations between adherence to a Western/unhealthy pattern and stroke were found(Reference Rodriguez-Monforte, Flores-Mateo and Sanchez17). This could be explained by the differing food groups within these patterns, which might have influenced the overall associations with stroke.
Contrary to the results of this study, a high adherence to the Wine & Snacks pattern might be expected to be associated with a greater risk of stroke due to the high intake of alcohol in the upper quintiles of the pattern. Our results could be due to the non-uniform reference group (Q1), as this quintile included both participants who never consume alcohol – possibly for health-related reasons, and thus might have a high underlying risk of stroke(Reference Wood, Kaptoge and Butterworth37) – and those with frequent alcohol intake. A quarter of participants in Q1 consumed alcohol more than two times a week (Table 3). Thus, adherence to the Wine & Snacks pattern is not a representation of total alcohol intake, but rather of specific alcoholic beverages, and the associations between the patterns and risk of stroke can, therefore, not be interpreted as representing a greater consumption of alcohol as a whole.
Our results are likely to be transferrable to other populations of the same age and within similar social and cultural settings as the study participants. While the participants in the Diet, Cancer and Health cohort were better off in relation to socioeconomic factors compared to non-participants, there were no major differences between the participants and Danish population in relation to dietary habits at entry into the study(Reference Tjonneland, Olsen and Boll21). In addition, the dietary patterns derived by TT were somewhat reproducible(Reference Gorst-Rasmussen, Dahm and Dethlefsen13), although it is unlikely that studies in other populations will derive entirely identical patterns due to differences in food availability and cultural preferences.
Conclusion
We used TT to generate dietary patterns, of which three explained 15·4 % of variation in energy-adjusted dietary intake. Adherence to a Prudent pattern was inversely associated with stroke, whereas adherence to a Western pattern was associated with a higher risk of stroke. We found no association between a Wine & Snacks pattern and stroke in women, but a weak inverse association in men.
The findings of this study support the general recommendation for a healthy diet to prevent stroke as described by the ASA. In future studies, it would be relevant to investigate the role of older age and changing dietary habits.
Also, it would be relevant to compare dietary patterns generated with an outcome-dependent method with current dietary recommendation to clarify the dietary components that explain the most variation in health outcomes.
Acknowledgements
Acknowledgements: We acknowledge the participants’ contribution to the Diet, Cancer and Health cohort. Financial support: The Danish Cancer Society funded the primary data collection for the Diet, Cancer and Health cohort, but had no influence on the aim, design and method of this study. The authors received no specific funding for this study. Conflict of interest: The authors have no conflicts of interest to declare. Authorship: S.F., H.T. and C.C.D. conceived the study question. S.F. and H.T. conducted the analyses and wrote the first draft. C.C.D. and K.O. contributed substantially to writing and editing. Ethics of human subject participation: This study was conducted according to the guidelines laid down in the Declaration of Helsinki, and all procedures involving study participants were approved by the relevant regional ethics committees and the Danish Data Protection Agency. Written informed consent was obtained from all subjects/patients.


