


People’s dietary patterns have implications for nutritional health(Reference Rao, Afshin and Singh1–Reference Cassady, Jetter and Culp5), global environmental change and food security(Reference Ericksen6,Reference Barosh, Friel and Engelhardt7) . Shifting population dietary patterns towards more nutritious and plant-based diets, which require less land, energy and water compared with diets high in animal-sourced foods(Reference Pimentel and Pimentel8,Reference Aleksandrowicz, Green and Joy9) , could improve population health and reduce negative environmental impacts(Reference Patel, Chandra and Alexander10,Reference Lynch, Johnston and Wharton11) . Consumers are increasingly understanding the benefits of adopting sustainable diets and perceive a positive relationship between healthy and lower environmental impact diets(Reference Lazzarini, Zimmermann and Visschers12,Reference Peschel, Kazemi and Liebichová13) . Expecting major changes in a diet may not be realistic. However, practical and modest changes, such as substituting animal-based protein dishes with plant-based protein meals, or reducing excessive beef consumption, which has a negative impact on the natural environment and possibly health(Reference Godfray, Aveyard and Garnett14), could be achievable(Reference Desjardins, MacRae and Schumilas15). However, shifting population dietary patterns requires a comprehensive understanding of food choices and consumer demand, including food purchasing decisions made in the retail food environment(Reference Glanz, Sallis and Saelens16). Community food environments act as the mediator between food systems and individuals’ diets, by constraining or promoting access to healthy options(Reference Glanz, Sallis and Saelens16,Reference Van Der Horst, Oenema and Ferreira17) . Thus, changing these contexts could have a larger and more sustained impact on population-level dietary behaviours than educational attempts(Reference Frieden18).
Retail food environments comprise retail food outlets, such as supercentres, supermarkets and convenience stores, in a given geographic area(Reference Dean, Sharkey and St. John19). Interventions in the retail food environment in Canada are relatively new(Reference Minaker, Shuh and Olstad20–Reference Lo, Minaker and Chan22) and have focused exclusively on improving nutritional and health outcomes(Reference Minaker, Shuh and Olstad20) rather than potential environmental sustainability outcomes. Recently, nutrition scholars and policy makers have begun to address these environmental considerations in dietary guidance(Reference Lynch, Johnston and Wharton11,Reference Chen, Chaudhary and Mathys23) . Countries like Sweden and Brazil have integrated sustainability considerations into their food guides by providing helpful recommendations, such as consuming plant-based foods, reducing waste and consumption of fish from sustainable stocks(24–26). Canada’s new Food Guide also reflects this trend(27). Dietitians are also beginning to incorporate sustainability considerations into practice(Reference Carlsson, Mehta and Pettinger28). Extant retail food environment studies have used a variety of assessment tools. Tools typically focus on availability, price, quality and marketing of nutritious v. non-nutritious foods(Reference Lytle and Sokol29). While the heavy focus on nutritional aspects of food stores is justified from a public health nutrition standpoint, the relationship between food and public health impacts is much broader than a simple focus on diet-related chronic disease prevention(Reference Majowicz, Meyer and Kirkpatrick30).
The majority (70 %) of the published research on Canadian retail food environments has taken place in urban, rather than in rural areas, and most focused on a single city(Reference Minaker, Shuh and Olstad20). Cities and regions have different geographic and socio-economic characteristics, and the effect of these variations on the retail food environment has rarely been considered(Reference Minaker, Shuh and Olstad20). Research on how features of the retail food environment differ between rural and urban areas and across regions is thus warranted.
Given that retail food environments constrain and influence food purchasing and consumption patterns within populations, and given that emerging research and policy are seeking to explore and encourage sustainable dietary practices, the aim of the current study was to develop and test an assessment tool that can be used to assess the price and availability of low-carbon (i.e., relative to current dietary patterns) footprint and nutritionally balanced dietary patterns within geographically diverse retail food environments in the province of Ontario, Canada. There have been recent attempts at developing an inventory assessment tool for healthy and sustainable food (HSFA)(Reference Lupolt, Buczynski and Zota31). However, the tool developed in the current study includes a more extensive list of items (eighteen food categories and seventy-seven items) taken from an actual self-reported survey, which can be used to form a variety of dietary patterns.
Methods
Study setting
In 2017, Ontario’s population was just over 14·19 million which is almost 38 % of Canada’s population(32), with 86 % of the population living in urban and 14 % in rural areas(33). The geographic scale of the study was the province of Ontario, Canada, which is divided into two regions, southern Ontario and northern Ontario. It should be noted that northern Ontario, for the current study, included only up to the Greater Sudbury area (Fig. 1). The focus in the current study was rural v. urban diversity, and north and south diversity within non-remote areas. Remote areas do not have year-round road access and rely on other modes of transportation (such as airplane) for food transportation(34). Therefore, they have not been included since they have quite a different food environment and face food access challenges and barriers that have been well-documented and are outside the scope of the current study(Reference Burnett, Stothart and Veeraraghavan35).

Fig. 1 Geographic coverage of study in southern Ontario (light shading) and northern Ontario (dark shading)
Sampling of stores and regions
This research was designed to assess the price and availability of selected food items in retail food store environments. In the case of retail food stores, chain stores comprise approximately 60 % of the market share in Canada(Reference Condon36), and in a survey of a sample of Canadian shoppers, 90 % of them indicated shopping at least once per week at a supermarket(Reference Minaker, Olstad and Thompson37). Therefore, only regular and discount chain stores were included in the current study. The distinction between regular and discount stores was based on how the stores identify themselves as well as guidelines from the Nutritious Food Basket(Reference Hubay, King and Vanderkooy38). Since discount stores have a lower level of staff service and less product variety, prices are expected to be lower(Reference Hubay, King and Vanderkooy38). Given that food price is an important component of the consumer nutrition environment, and that the purpose of the current study is to test a tool in different types of supermarkets, both regular and discount chain supermarkets were included in the current study.
In order to cover areas with different food environment characteristics, rural and urban areas were identified in each region (north and south). Municipalities were thus stratified based on their region (north or south as defined by Ministry of Northern Development Mines and Forestry(39)) and population density (low/rural: < 400 people/km2 and high/urban: more than 400 people/km2)(40). Eight municipalities were selected randomly from the stratified sample (stratified by rural/urban and north/south). Within the selected municipalities and through a web search, stores were identified using the list of chain stores in Canada (both regular and discount) derived from the Nutritious Food Basket document. The Nutritious Food Basket document includes guidelines and information regarding monitoring the cost of healthy eating and is used by various stakeholders, such as regions or different levels of government(41–43). Originally, twenty-five stores were randomly selected from the list of all available stores in the selected municipalities. Since there were fewer supermarkets in rural areas in northern Ontario, more rural municipalities were selected to ensure a similar number of stores for both the rural and urban areas (Fig. 2).

Fig. 2 Selected cities in Ontario based on the four areas of study. Numbers in brackets indicate the number of stores assessed in each municipality
Systematic direct observation (ground-truthing)(Reference Hosler and Dharssi44) was used before starting the assessment. Two stores from the same chain declined permission due to corporate regulations. Hence, those stores were eliminated from the list. Given that municipalities in rural areas limited number of chain stores (e.g., Blind River only had one chain store) and had a final list that included twenty-three stores.
Development of the survey instrument
This assessment tool – the Sustainable Nutrition Environment Measures Survey (S-NEMS) – was adapted from the ToNEMS-S, a Canadian adaptation(Reference Lo, Minaker and Mah21) of the validated Nutrition Environment Measures Survey for Stores (NEMS-S), which is an observational measure of a retail environment to assess the quality, price and availability of healthy options within ten food categories(Reference Glanz, Sallis and Saelens45). The ToNEMS-S was adapted to reflect the food items identified by Veeramani and colleagues to reflect nutritionally adequate and environmentally sustainable dietary patterns from the Ontario sample of the 2004 Canadian Community Health Survey(Reference Veeramani46–Reference Veeramani, Dias and Kirkpatrick48). Veeramani and colleagues used actual food intake data for individuals from the Canadian Community Health Survey, gathered in 2004 through a rigorous 24-h recall approach, and grouped individuals’ food intake to form seven dietary patterns (e.g., vegetarian, omnivore), considering the most commonly consumed foods to represent average Ontario residents’ consumption. The carbon footprint was assessed using life cycle assessment, a holistic tool that evaluates resource use and environmental impacts of a product throughout its life cycle(Reference Finnveden, Hauschild and Ekvall49). Veeramani and colleagues made minor modifications (i.e., substituted high-carbon proteins, such as beef, with commonly consumed lower-carbon proteins, such as chicken) to the identified dietary patterns to create new dietary patterns that were likely to be acceptable (i.e., relied on commonly consumed foods) and adhered Canada’s Food Guide(27), but had a lower carbon footprint. The individual food items and amounts identified in the seven new dietary patterns were used to develop S-NEMS (which is an adaptation of the ToNEMS-S) so that availability and price of foods in each dietary pattern could be captured. Other tools, such as NEMS-S, have shown that there is a difference between the quality of fresh fruits and vegetables across different types of stores(Reference Glanz, Sallis and Saelens45). However, within the consumer nutrition environment, particularly for low-income consumers, cost and availability are shown to have a more significant impact on dietary choices(Reference Cassady, Jetter and Culp5,Reference Glanz, Sallis and Saelens16,Reference Jetter and Cassady50) . In addition, previous research conducted in Canada has shown a fresh fruit and vegetable quality indicator to have poor reliability(Reference Camden, Levy and Bassil51). Therefore, assessing the quality of produce was excluded from S-NEMS.
The final S-NEMS survey tool included eighteen food categories, such as fruits and vegetables (including fresh, frozen and canned items), meat (including beef, chicken, pork) and beverages (including juice, tea, coffee and cola) (see online Supplementary Material). Of note, similar to the NEMS-S, the ToNEMS-S and many other consumer nutrition environment assessment tools, less-nutritious foods (such as carbonated drinks and potato chips) are also captured in this assessment tool to gain a comprehensive picture of the consumer food environment.
A detailed protocol was developed to instruct the raters to maximise the inter-rater reliability of the tool and to minimise personal judgement and discrepancies. This protocol included survey instructions, general guidelines and a detailed description on how to record the price of each item, and how to choose appropriate substitutions (see online Supplementary Files, general guidelines of the protocol) when listed foods were unavailable.
To record prices, an adaptation of the ToNEMS-S(Reference Lo, Minaker and Mah21) tool and Nutritious Food Basket(Reference Hubay, King and Vanderkooy38) was employed. Briefly, the regular price (i.e., not the sale price) of specific brands was recorded to have a more time-stable, accurate comparison between regions for the same product. Prices were recorded as indicated on the price tags: per piece, per kg, per lb and per l or ml for liquids. Price per unit weight (kg) or volume (l) was calculated from the original weight or volume and based on average weights of whole fruits and vegetables taken from USDA data(52).
Piloting the tool
Before the actual data collection, three pilot visits were made to select discount and regular supermarkets (not included in the list of twenty-three stores). The senior author (LM), who completed the original NEMS Train the Trainer workshop in 2008, trained two graduate student researchers to use the tool. The pilot store visits were followed by researcher debriefs around use of the tool. The research team came to consensus regarding the order of items listed in the tool and made changes in brands or types based on commonly available brands. The necessary modifications were added to protocol handbooks, which were taken to every store thereafter. For each item, the undiscounted price and size of the indicated brand (or alternate according to the protocol) were recorded.
Data collection
A total of twenty-three supermarkets in eight municipalities were visited by two raters during the month of August and September 2017 (Fig. 2).
Letters explaining the study purpose were provided to the store managers. Managers from two stores (within the list of twenty-three stores) did not allow researchers access to collect data. In these cases, another location of the same chain store in the same municipality was visited.
Two raters independently walked through the selected supermarkets and collected the data using the S-NEMS. The raters collected data on paper-based forms, and data were subsequently entered into Excel™ files by the lead author (SM) within a week of data collection. In addition to the data, field notes were recorded for any uncertainty faced during the process.
Data analysis
The intra-class correlation coefficient (ICC) was used to assess inter-rater reliability for prices(Reference Lo, Minaker and Chan22). It assesses the extent to which two or more raters have recorded the exact same data(Reference Landers53). Based on a 95 % CI, an ICC value < 0·5 represents poor, 0·5–0·75 moderate, 0·75–0·90 good and over 0·9 almost excellent agreement(Reference Koo and Li54).
Cohen’s κ coefficient was used to determine the degree of agreement by the raters on the availability of food items. A κ coefficient value of 0·6–0·8 shows ‘substantial agreement’, and > 0·8 indicates ‘almost perfect to perfect’ agreement. In the current study, the κ coefficient shows whether a food item marked as unavailable by one of the raters was actually unavailable or if one of the raters failed to find it. A higher κ indicates that both raters agreed on whether or not the items were available. Finally, descriptive statistics were used to present frequencies and means of relevant variables, including food availability and food prices.
Results
Distribution of stores
The distribution of stores (n 23) based on region (north/south), population density (urban/rural) and store type (regular/discount) is shown Table 1. Overall, 35 % (n 8) of sample stores were in northern Ontario, while 65 % (n 15) were in southern Ontario (Table 1). The overall distribution of stores sampled in urban and rural areas was similar, with 52 % urban stores and 48 % rural stores. However, most of the supermarkets available in low population density areas (rural), specifically in the north, were discount stores.
Table 1 Distribution of surveyed stores

Survey tool reliability
For the S-NEMS tool, the overall inter-rater reliability score for prices (collected by the raters), as measured with the ICC, was 0·819 (Table 2). This shows a high degree of agreement in recording data between the two raters. The ICC for every food category was above 0·9, except for the ‘Drinks-juice’ category, which was 0·779.
Table 2 Reliability coefficients for survey tool
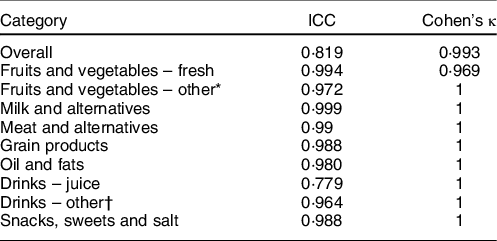
ICC, intra-class correlation coefficient.
* Fruits or vegetables that are canned, 100 % juice, frozen.
† Coffee, tea and carbonated drinks.
In terms of the availability of items, the overall Cohen’s κ was 0·993, showing almost perfect agreement between raters (Table 2). For almost all categories, there was ‘perfect’ agreement (i.e., κ = 1), except for the ‘Fruits and vegetables-fresh’ category, which had ‘almost perfect’ agreement (κ = 0·969). This means that both raters agreed on whether or not the items were available. Note that if both raters agreed that the item was not available, this could indicate that it was either not available or that neither rater found it.
Food availability
Most of the items needed to meet nutritionally balanced and low-carbon dietary patterns based on Ontario resident food preferences were available in many of the supermarkets. Out of the seventy-seven food items included in the tool, sixty items (78 %) were available in every store. Table 3 shows the availability of foods by regular v. discount, urban v. rural and north v. south of the foods that were not available in every store. Of the seventeen items that were not available in every store, six items (roasted peanuts, zucchini, cauliflower, split pea, raw pear and raw pineapple) were available in 96 % of the visited stores (twenty-two out of twenty-three stores). A total of four items including dry roasted cashew nuts, salt, lentils and green peas were available at 91 % of the stores. Pepperoni was available at 86 % of the stores. Three items including oil roasted almonds, soy patty and tofu were available at 78 % of the stores. The three top items that were not regularly available at the visited stores were papayas (available at 65 %), almond butter (available at 43 %) and fruit butters (apple butter) (only available at 30 %). Almond butter and apple butter were included in the tool since they were among the top items in terms of consumption by the vegans and vegetarians(Reference Veeramani46).
Table 3 Availability of the scarce food items

Fruits and vegetables were more available in regular, rural and northern stores. In the meat and alternatives category, there was higher availability in discount stores and those in the south. In particular, specialty foods (almond butter, tofu and soy patties) showed higher availability in discount, south and rural stores.
Price comparison
Prices between regular and discount stores, urban and rural areas, and northern and southern Ontario were compared based on mean price and price range and are given in Canadian dollars. Prices are either based on 1 kg or 1 l of food product. Percentage differences represent the difference in food and beverage prices for different store categories, relative to regular, rural and northern stores, based on the assumption that these would be more expensive (see Table 4).
Table 4 Percentage difference in mean and mean price in regular v. discount stores, urban v. rural areas and northern v. southern Ontario

* Cereal, rice, oats and quick oats.
Percentage differences in mean price ranged from 0 to 26·2 % (highest for pasta) for regular v. discount stores, 0 to 21 % (highest for pasta) for urban v. rural and 0 % to 16 % (highest for milk) for northern v. southern Ontario. Mean prices were higher in regular compared with discount stores for all items except milk, chicken and eggs. Nevertheless, there were no consistent price differences between urban and rural stores nor between north and south stores. A more extensive comparison of prices, including minimum and maximum prices for each food group, can be found in the online Supplementary Data.
Discussion
This is the first study to describe the development and testing of a supermarkets environment measure that incorporates nutrition and environmental sustainability considerations. The study area was large (~100 000 km2), covering eight rural and urban municipalities, and included both discount and regular supermarkets. The tool demonstrated very high inter-rater reliability. Key findings, limitations and directions for future research are discussed below.
The mean ICC (for prices) of this tool was 0·819, showing good agreement between the raters for the prices recorded for the food items in the tool. The overall Cohen’s κ of the tool was 0·993, which is substantially higher than the mean value of 0·83 found in other studies(Reference Lytle and Sokol29). While studies are increasingly reporting the reliability of their tools, < 17 % of studies have reported this measure(Reference Lytle and Sokol29). The high values for both ICC and Cohen’s κ show the high reliability of the tool and protocol for identifying food products and brands and prices across many food environments. These measures have also been used in a previous similar study where the developed tool demonstrated high reliability(Reference Lo, Minaker and Mah21). Given the novel application of S-NEMS measuring elements of both nutrition and environmental sustainability, a high ICC (for price) and Cohen’s κ (for availability) are very important. Therefore, with adequate training, researchers can confidently use this tool to assess nutrition and sustainability aspects of supermarkets in their communities.
Second, the tool showed that almost every food item within various dietary patterns of Ontarians was available in all twenty-three stores. Specifically, in the case of fruits and vegetables, results from the current study are in line with a previous study showing that rural residents in Canada did not mention lack of fresh fruits and vegetables(Reference McPhail, Chapman and Beagan55). Food items with lowest availability were part of the vegan and vegetarian dietary patterns identified by Veeramani et al. (48) and had lower availability in northern Ontario compared with southern Ontario. Possible reasons why some items were not available in visited supermarkets could be lack of demand(Reference Flanagan56), seasonality (for ‘exotic’ fruits like papaya) and the fact that some items (like fruit butter) may more likely be purchased from specialty stores rather than supermarkets. That said, it appears that within the assessed geographic region, adhering to nutritionally adequate and environmentally sustainable diets would not be constrained by geographic inaccessibility of specific foods. Instead, constraints on healthy eating could be due to the cost of healthy foods(Reference Glanz, Bader and Iyer57,Reference Pechey and Monsivais58) or even go beyond the physical environment and be influenced by other determinants such as personal taste, nutritional knowledge and the social environment such as culture(Reference Raine59).
Third, the biggest price differences were found between regular and discount stores. Shopping at discount stores has been associated with poorer quality diets, higher BMI of the customers as well as lower healthfulness of food choices(Reference Pechey and Monsivais58,Reference Vogel, Ntani and Inskip60) . However, given that healthy items are available at both discount and regular stores, consumers could purchase healthy food in discount stores at a lower price(Reference Jilcott Pitts, Wu and McGuirt61). In contrast, price differences between southern and northern Ontario depend on the food item, but there was no clear trend. This would likely have been different if remote northern communities in Ontario had been included where food prices have been documented as being far higher than those of southern Canadian communities(Reference Skinner, Burnett and Williams62). Regardless of type or location of store, the largest price differences typically occurred with protein sources in the ‘Meat and alternatives’ category and with milk in the ‘Milk and alternatives’ category.
Plant-based proteins (i.e., tofu, lentils, beans, etc.) were the least expensive sources of protein and were generally available in all stores. These findings are consistent with others, where by weight, plant-based sources of protein were more affordable than animal-based sources of protein for all types of dietary patterns(Reference Baroni, Cenci and Tettamanti63,Reference Van Dooren, Marinussen and Blonk64) . They are also considered healthier and more sustainable(Reference Baroni, Cenci and Tettamanti63,Reference Van Dooren, Marinussen and Blonk64) , having carbon intensities up to fifty times smaller than beef(Reference Veeramani, Dias and Kirkpatrick47). Among animal proteins, chicken and eggs were relatively inexpensive and generally have the lowest carbon intensity.
In terms of study strengths, retail food environments were assessed over 100 000 km2 and covered multiple urban and rural municipalities. The urban and rural comparison enhances our understanding of food prices in rural areas. Rural food environments are currently understudied, but are important given that one out of five Canadians live in rural areas(Reference Minaker, Shuh and Olstad20). It also emphasises the importance of assessing the availability and cost of more sustainable foods in retail environment studies, given that the food system is a significant contributor to global environmental change(Reference Ericksen6). Another study strength was that the foods assessed were based on actual dietary consumption data from Ontario. That said, some foods that occurred commonly in an (albeit large) sample of Ontarians based on 1 d of food recall (see Veeramani(46) do not necessarily make it a preferred food for this type of diet, rather it may reflect consumption based on availability.
A limitation of this tool is that it used food items derived from the 2004 Canadian Community Health Survey, and demand for foods might have changed. Therefore, the tool can be improved and updated by using more recent data from Canadian Community Health Survey 2015. There is also the matter of seasonality which was not accounted for in the current study. Tool testing could be repeated in different seasons to account for this factor. Furthermore, regarding store types, 70 % of sample stores surveyed were discount stores which could be considered a limitation to the current study.
Another limitation of the current study is that it did not cover remote northern areas, so future research could examine whether nutritionally balanced and lower-carbon diets are attainable in these contexts. With appropriate transportation and storage, dried and frozen food items are shelf-stable, and these opportunities could be explored to promote nutritionally balanced and lower-carbon diets in remote areas. Even though availability of such items guarantees neither access nor dietary change, it could potentially be the first step(Reference Wendimu, Desmarais and Martens65).
As a final limitation, the tool did not assess the quality of items. Informal conversations with the store managers suggest there is a significant difference in the quality of many fresh fruits and vegetables between discount and regular stores. In addition, in a similar geographic area there are more stores available in southern Ontario compared with northern Ontario. Therefore, even if items are available, travelling long distances to purchase them limits access, which is a critical determinant of adopting a low-carbon diet. Hence, adding measures to assess access to stores and the quality of available items (particularly for fresh fruits and vegetables), as was done in the original NEMS-S, could enhance the tool.
Implications for research and practice
The developed tool takes a step towards addressing the inter-relationships between food consumption, the natural environment and global environmental change by assessing the costs and availability in supermarkets of commonly consumed foods in Ontario, Canada that form a part of nutritionally balanced and relatively low-carbon dietary patterns. This is among the first attempts to assess both the human and planetary health implications of the consumer food environment.
The study contributes to literature by developing and testing a food environment assessment tool with high inter-rater reliability that assesses consumer cues related to both nutritional and environmental outcomes. Public health researchers are increasingly considering the myriad and complex ways in which food affects population health(Reference Majowicz, Meyer and Kirkpatrick30), and national dietary guidance has recently begun to consider environmental sustainability in addition to nutritional outcomes in many countries (e.g.,, Health Canada’s recent Canada’s Food Guide to Healthy Eating(27) or Brazil’s Dietary Guidelines(25)). As noted above, to the best of our knowledge, this tool is the first one that enables assessment of both nutritional and environmental cues in settings where a large proportion of the food supply is procured (supermarkets). As such, it can be used as part of a broader sustainable food systems toolkit to examine the retail environment, and better understand potential downstream health and environmental impacts of the food system. The tool could be adapted to be used in different geographic locations such as another country by including highly consumed food items of that location. It could also be improved to address seasonality and to consider current demand. Furthermore, the tool could be used for research on the affordability of lower carbon diets and the effects of access and availability on the overall sustainability of a diet. In public health practice, dietitians can use this tool to assess the availability and cost of environmentally sustainable diets and build support among stakeholders in diverse fields (e.g., nutrition, environmental sustainability) for policies that would improve both population-level diet quality and environmental sustainability.
Acknowledgements
Acknowledgements: The authors thank Iman Hassani for assisting with data collection. Financial support: The University of Waterloo for Harding/Claxton Humanities and Social Sciences Seed Grant. Conflict of interest: None. Authorship: S.M. was responsible for study design, carrying out the research, data analysis and writing the manuscript. G.D. was responsible for study design, guidance regarding the data analysis and editing the manuscript. L.M. was responsible for study design, training and guidance regarding the data analysis and editing the manuscript. Ethics of human subject participation: Verbal consent was witnessed from the managers of the visited stores.
Supplementary material
For supplementary material accompanying this paper visit https://doi.org/10.1017/S1368980021000446


