


In recent decades, childhood overweight/obesity has been increasing and considered as a public health problem worldwide(Reference Ogden, Carroll and Flegal1–Reference Lobstein, Baur and Uauy4). Its occurrence in the developing countries including Pakistan continues to rise at a fast pace. The results from the published studies show that the prevalence of overweight and obesity in the Pakistani children ranges from 3 % to 20 %(Reference Jafar, Qadri and Islam5–Reference Ahmed, Laghari and Naseer8).
Epidemiological researchers usually use BMI as an internationally recognised and established measure for identification of overweight and obesity in children and adults(2). However, it does not assess the fat distribution in the central or upper portion of body of an individual(Reference Walton, Lees and Crook9). It is also becoming clearer that the risk of multiple cardiovascular and metabolic disturbances has been found to be correlated with body fat distribution rather than just overweight and obesity(Reference Kissebah, Vydelingum and Murray10,Reference Peiris, Struve and Mueller11) . This limitation of BMI can be partly overcome by the measurement of other anthropometric parameters i.e. waist circumference, skinfold thickness and neck circumference (NC). These parameters have been used as alternative indicators for the assessment of regional adiposity in children and related complications. However, the measurement of waist circumference is affected by respiratory movements and postprandial abdominal distension. Sometimes, skinfold thickness measurement is difficult or even impossible due to non-availability of accurate subscapular. In comparison, the NC measurement is a simple, easy to perform and time-saving measure, which may also be useful in special populations such as morbidity obese people, patients in bed rest and pregnant women etc. Measurement of the NC is a relatively new method that is currently used for various clinical predictions by different researchers e.g. larger size of NC has been shown to be associated with paediatric obesity(Reference Kelishadi, Djalalinia and Motlagh12–Reference Katz, Vaccani and Clarke15), metabolic risk factors(Reference Kurtoglu, Hatipoglu and Mazicioglu16), cardiovascular diseases(Reference Ben-Noun and Laor17) and obstructive sleep apnoea(Reference Ahbab, Ataoglu and Tuna18). For the prediction of these outcomes, sex and age-specific reference values of the NC might be applicable(Reference Katz, Vaccani and Clarke15,Reference Katz, Murto and Baarowman19) . A recent study by Katz et al. (Reference Katz, Vaccani and Clarke15) with the Canadian children also suggested the 50th percentile values of NC as a cut-off points for screening children with overweight and obesity (BMI > 85th percentile).
In the literature, few studies(Reference Mazicioglu, Kurtoglu and Ozturk14,Reference Katz, Vaccani and Clarke15,Reference Hosseini, Motlagh and Yousefifard20) with children and adolescents are available, and those that are available have developed their own growth reference charts of the NC. However, due to genetic and environmental differences between global populations, these references might not be applicable to the developing countries(Reference Hosseini, Motlagh and Yousefifard20) including Pakistan. The reference charts about NC for the Pakistani children and adolescents from 2 to 18 years age are generally scarce and need to be published. Given this negotiable need, we present the smoothed NC percentile values and associated growth charts for the Pakistani children and adolescents using the lambda–mu–sigma (LMS) and quantile regression (QR) statistical methods. We also compare our median percentile values with the references of other foreign studies.
Methods
Participant and design
To construct the sex and age-specific NC growth reference charts, we used the publicly available growth data for children and adolescents 2–18 years of age from the Mendeley web link https://data.mendeley.com/datasets/sxgymx5xjm/1 (Reference Asif, Aslam and Qasim21). This dataset was based on a cross-sectional multi-ethnic anthropometric survey that was carried out during 4 months from March through June 2016. Details concerning the study design and participant selection in this survey can be found in earlier published studies(Reference Asif, Aslam and Qasim21–Reference Asif, Aslam and Altaf24). Briefly, the multi-ethnic anthropometric survey included 10 782 children and adolescents aged 2–19 years and the dataset of pre-school children (i.e. 2–4 years of age) were collected from different public places (i.e. parks, shopping malls, markets, etc.) using convenient sampling. The data for 5–19 years aged participants were taken from 68 public and private schools. The complete list of schools of respective city was stratified according to the school grade (primary, secondary and higher secondary), and random sampling was used for school selection. The participants were sampled from each class based on simple random sampling. The survey included healthy children i.e. children who were not affected by any chronic diseases (e.g. diabetes, metabolic syndromes, hyperlipidemia or thyroid diseases etc.) in the life. The participants who refused to give measurements and those who were having goitre, or any physical disability were not enrolled in the survey(Reference Asif, Aslam and Wyszynska22). The authors assert that the complete study protocol was according to the ethical standards declared by Helsinki(25).
In this survey, different anthropometric measurements of each participant were taken and details of the measurement procedure have been described in previous studies(Reference Asif, Aslam and Qasim21,Reference Asif, Aslam and Wyszynska22) . However, this study is focussed on NC. The NC (cm) of each participant was measured using non-stretchable plastic tape, in standing position; at a point just below the thyroid cartilage and perpendicular to the long axis of the neck(Reference Asif, Aslam and Wyszynska22).
Statistical analysis
The complete analyses were performed using the software, Statistical Package for Social Sciences (SPSS) version 21.0 and the language R version 3.2.0. Sex and age-specific descriptive analysis (i.e. mean, median, sd and interquartile range) of the NC and two-sample independent t-test was performed. The NC growth reference values were computed using the LMS and QR methods.
Firstly, sex and age-specific smoothed L (Box-Cox power), M (median) and S (co-efficient of variation) values(Reference Cole26,Reference Cole27) were obtained through R language and required centile value (C) was calculated by using the equation C = M [(1 + LSZ)1/L )], where Z is the Z-score of the normalised distribution. For example, an 18 years old boy with smoothed L = 2·41, M = 32·18 and S = 0·050 along with sd-score (Z = 1·645), the value of the 95th percentile was obtained as C95 = 32·18 {[1+ (2·41) × (0·050) × (1·64)]1/(2·541)} = 34·68. Similarly, we obtained the value of 95th percentile for girls by using three smoothed parameters L = –1·17, M = 29·64 and S = 0·061 along with Z = 1·645 as: C95 = 29·64 {[1+ (–1·17) × (0·061) × (1·64)]1/(–1·17)} =33·00. Secondly, the R quantreg package was used for obtaining smoothed NC percentiles for a QR approach(Reference Chen28,Reference Aslam and Altaf29) . Further details about QR and the LMS method can be found in earlier studies by different researchers(Reference Cole26–Reference Aslam and Altaf29).
For checking the superiority between these methods, median (50th) centiles of both sets were compared with empirical centiles. The LMS and QR median (50th) centiles were also compared with the centiles of other countries. The statistical significance α = 5 % was set for the whole analyses.
Results
A total of 10 668 children and adolescents including (n 5539; 51·9 %) boys and (n 5129; 48·1 %) girls aged 2–18 years were enrolled in this study. The boys had higher mean NC than the girls had between the ages of 2 and 7 years. From age 8 to 13, mean NC in the girls was higher than the boys and this trend reversed after age 13. Overall, the mean NC in the boys was significantly higher than that in the girls (boys v. girls: 27·00 ± 3·05 cm v. 25·97 ± 2·92 cm; P < 0·001). The NC median values in both sexes had an increasing trend with respect to age (Table 1).
Table 1 Ontogenetic variability of the neck circumference (cm) in Pakistani children and adolescents
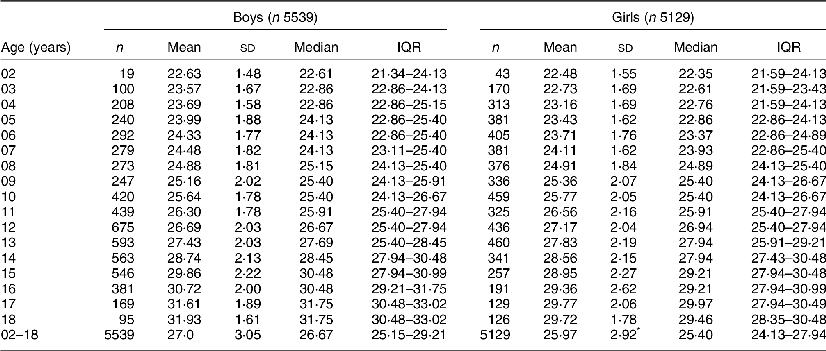
IQR, interquartile range.
* Significant P < 0·001.
Sex and age-specific smoothed percentile values of NC using the LMS and QR methods are shown in Tables 2 and 3, and smoothed NC growth curves for the 5th, 10th, 25th, 50th, 75th, 90th and 95th percentiles are shown in Fig. 1 (A + B) and Fig. 1 (C + D), respectively. For both sexes, all the percentile values (5th to 95th) developed by both the LMS and QR techniques increased across age. From 8 to 13 years of age, lower (5th), median, and upper (95th) percentile values showed that girls had larger NC than boys. A comparison of our median (50th) percentile curves derived by Cole’s LMS, and the QR method with empirical percentiles is presented in Fig. 2 (A + B) and a comparison between LMS smooth and empirical percentile curves was also produced for earlier reference data by Mazicioglu et al. (Reference Mazicioglu, Kurtoglu and Ozturk14) in Fig. 2 (C + D). Our percentile curves using both methods are in very close agreement with the original/empirical percentiles for both sexes at most of the ages. We also compared our LMS and QR 50th percentiles with earlier international reference data. Our NC data for the Pakistani boys and girls was lower than those of the Turkish, Iranian and Canadian reference values(Reference Mazicioglu, Kurtoglu and Ozturk14,Reference Katz, Vaccani and Clarke15,Reference Hosseini, Motlagh and Yousefifard20) (Fig. 3).
Table 2 Neck circumference (cm) percentiles for Pakistani children and adolescents aged 2–18 years using the LMS method
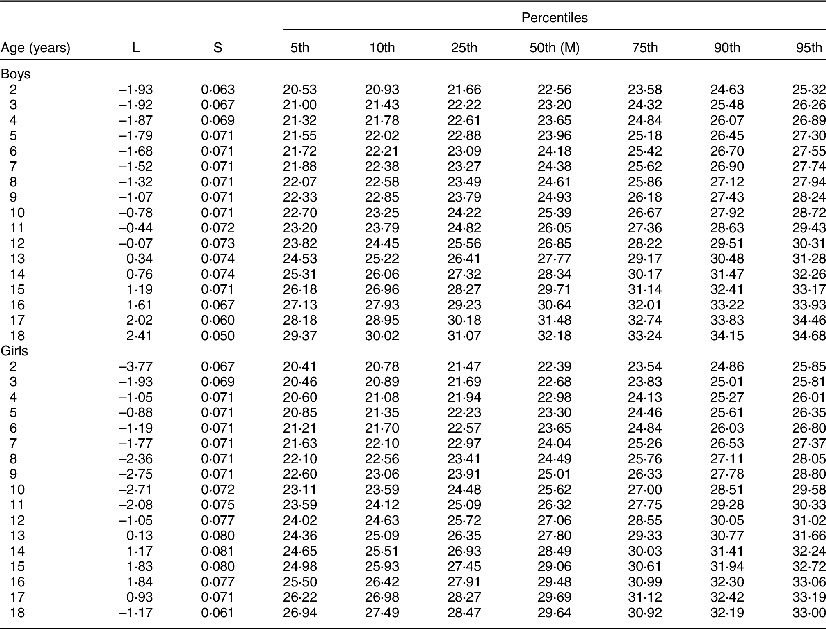
LMS, lambda–mu–sigma.
Table 3 Neck circumference (cm) percentiles for Pakistani children and adolescents aged 2–18 years using the QR method
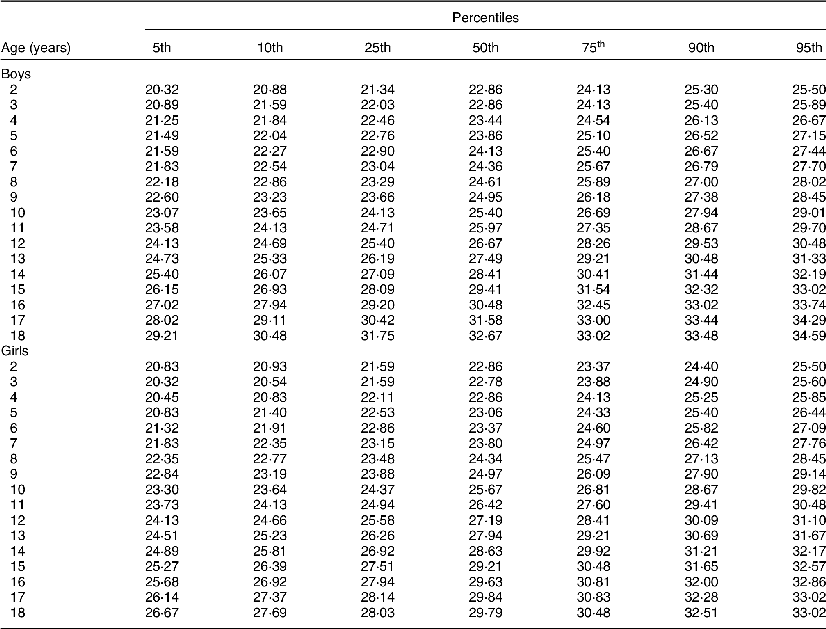
QR, quantile regression.
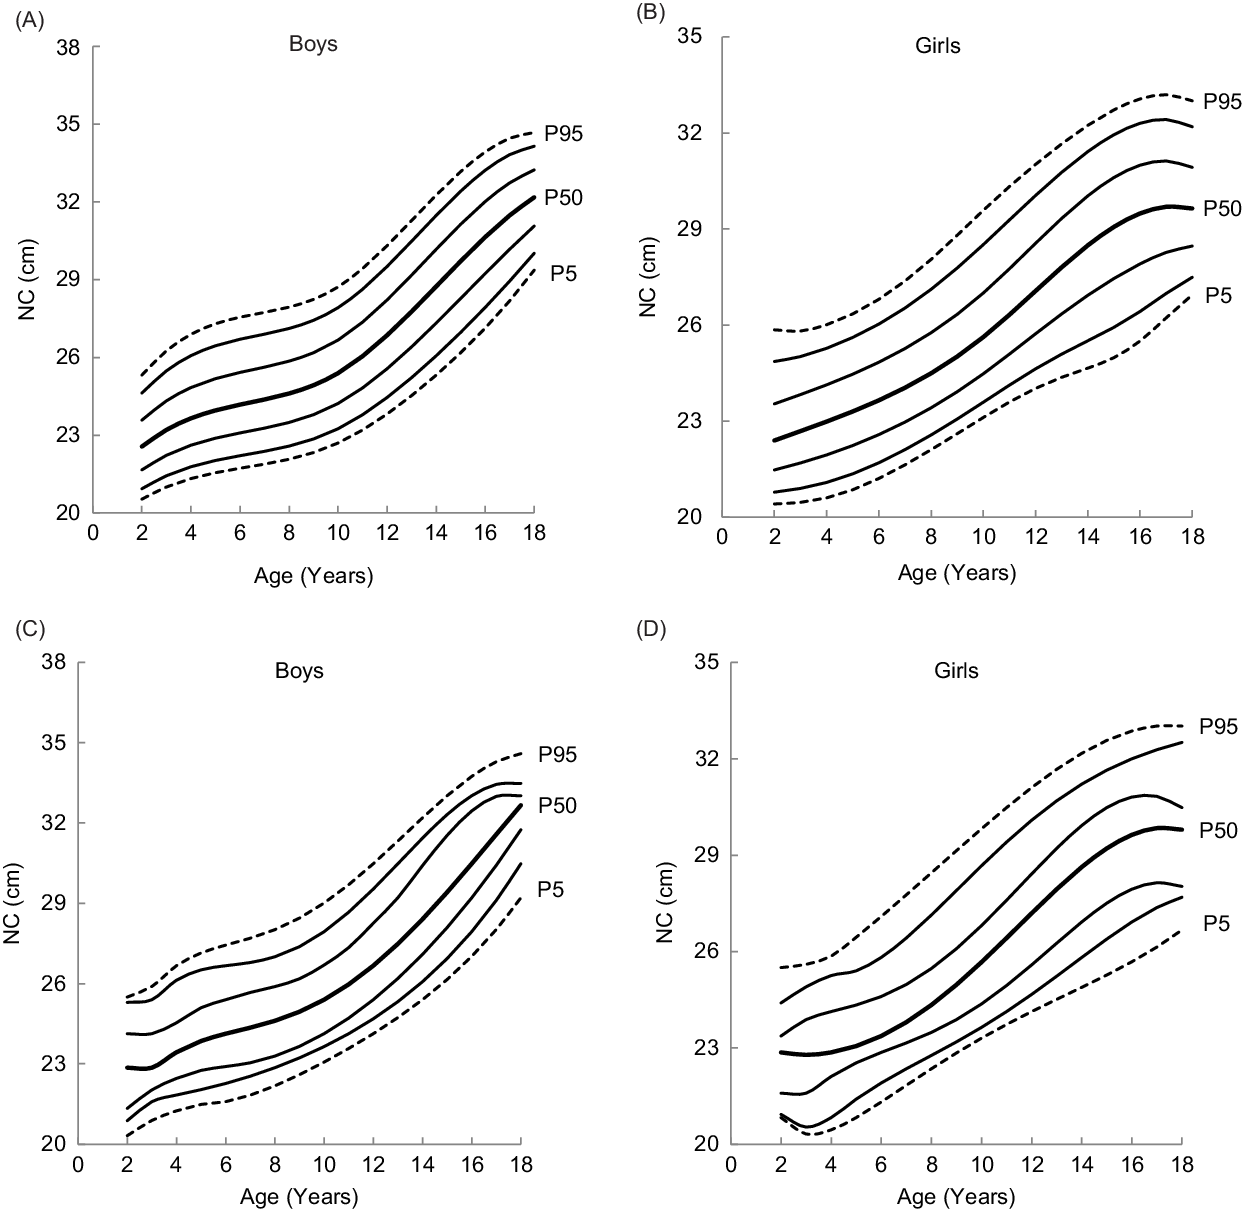
Fig. 1 Smoothed NC growth curves using the LMS (A + B) and QR method (C + D) for Pakistani boys and girls aged 2–18 years
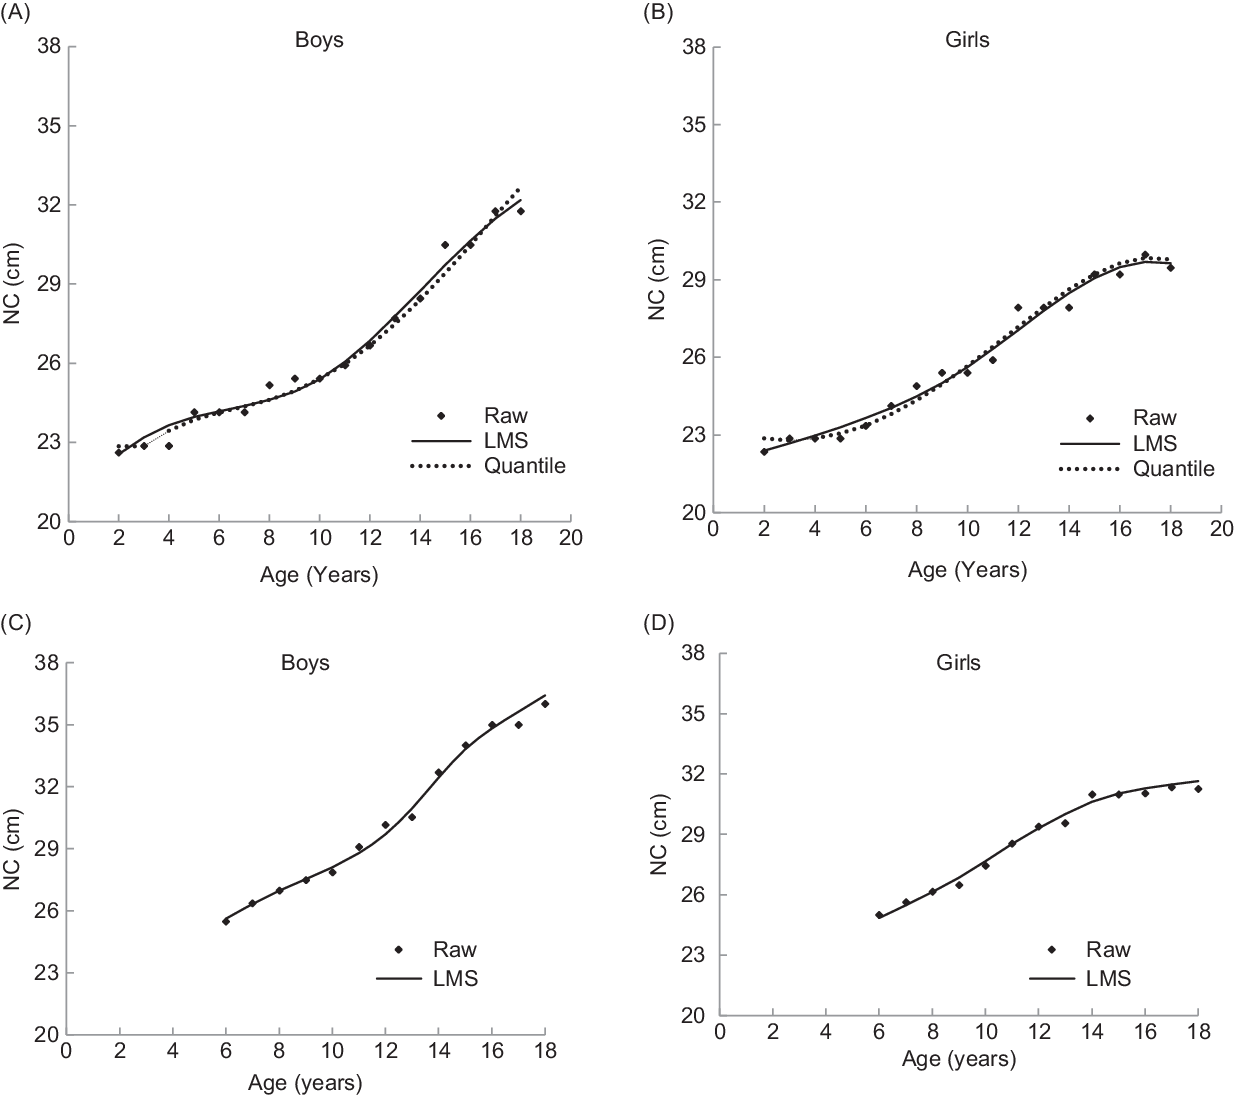
Fig. 2 Comparison of 50th percentile curves of NC (cm) obtained by LMS, QR and original/empirical for the Pakistani boys and girls (A + B) and Turkish study (C + D) (Mazicioglu et al., 2010)
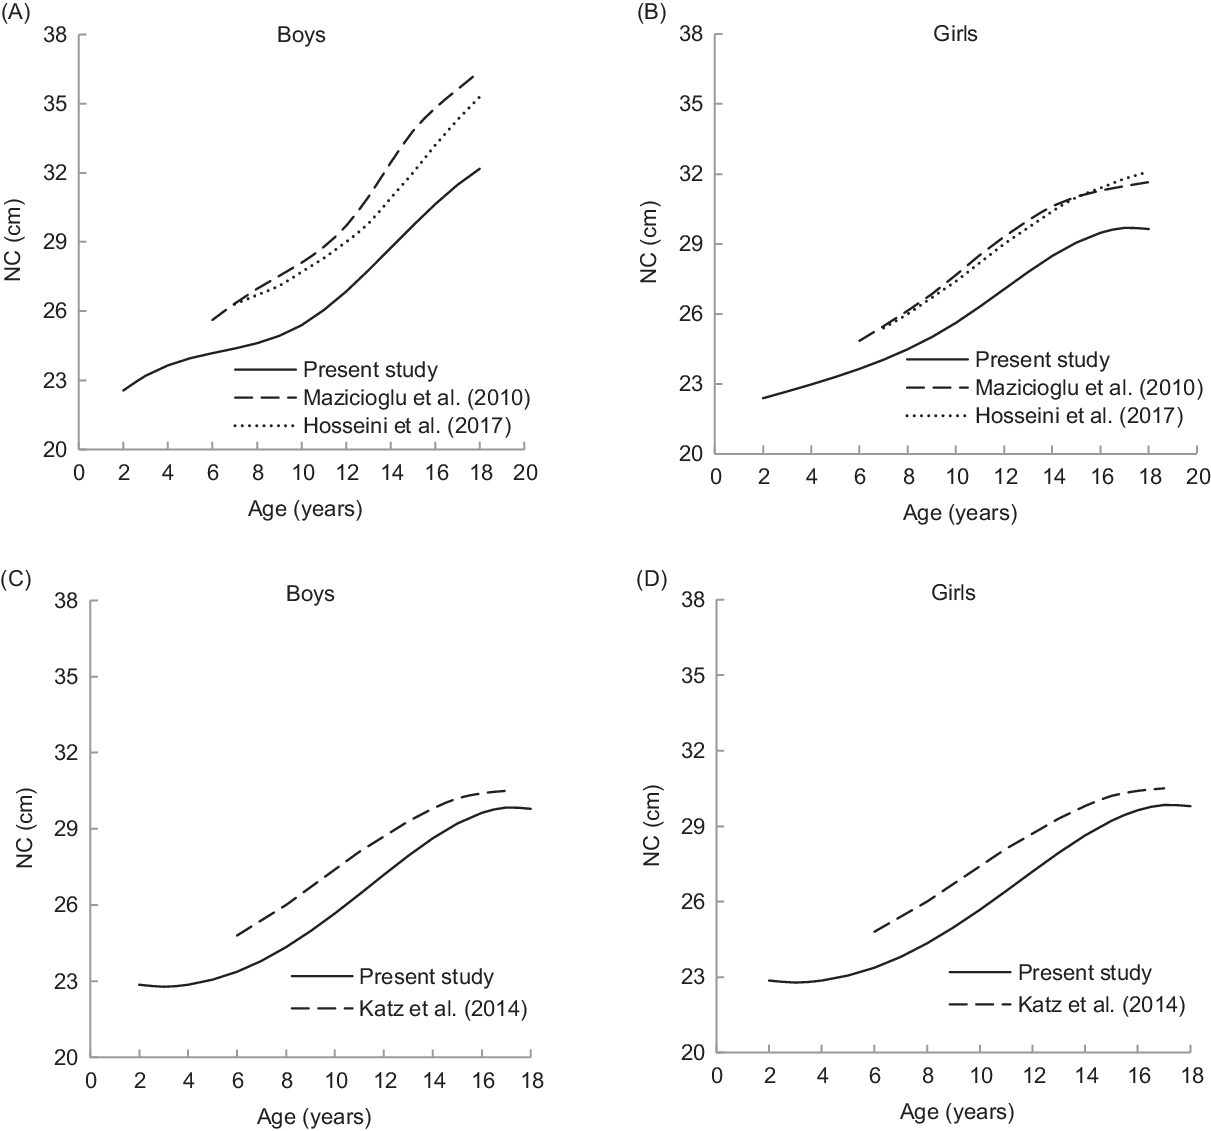
Fig. 3 NC (cm) 50th percentile comparison for the Pakistani boys and girls aged 2–18 years with the Turkish, and Iranian children obtained by LMS method (A + B) and with the Canadian children obtained by QR method
Discussion
Rapid increase of obesity/overweight in children has now become a serious public health threat worldwide(Reference Ogden, Carroll and Flegal1–Reference Jafar, Qadri and Islam5). Epidemiological researchers often use certain morphological characteristics of the human body to assess obesity and their associated metabolic or CVDs risks(Reference Asif, Aslam and Altaf24). The main and foremost criterion for evaluating obesity is BMI, but other measurements such as waist circumference, mid-upper arm circumference and skinfold thickness are also used to determine body fat distribution in children and adolescents(Reference Daniels, Khoury and Morrison30). Currently, the NC, an alternative screening method, is proposed as a potential proxy for determining high BMI(Reference Kelishadi, Djalalinia and Motlagh12,Reference Hatipoglu, Mazicioglu and Kurtoglu13) . A Turkish study by Hatipoglu et al. (Reference Hatipoglu, Mazicioglu and Kurtoglu13) found a positive correlation between NC, waist circumference and BMI. Few studies(Reference Asif, Aslam and Wyszynska22,Reference Asif, Aslam and Altaf24) with the Pakistani children also showed an implication of NC as a marker for obesity. Some more investigations have provided the evidence that larger neck size may predict obesity(Reference Mazicioglu, Kurtoglu and Ozturk14,Reference Katz, Vaccani and Clarke15) and obesity-related conditions in children, including metabolic(Reference Kurtoglu, Hatipoglu and Mazicioglu16) and CVD(Reference Ben-Noun and Laor17), as well as obstructive sleep apnoea(Reference Ahbab, Ataoglu and Tuna18). These findings indicate that the NC may be used both in clinical practice and in epidemiological studies as an easy to use and reliable index. For the prediction of these outcomes and for routine clinical evaluation, it is necessary to create reference data of neck sizes. Up till now, few studies have generated NC reference data for children and adolescents. A study by Mazicioglu et al.(Reference Mazicioglu, Kurtoglu and Ozturk14) established mean, median and percentile values of NC for the Turkish children and adolescents aged 6–18 years and this reference data set could be used as preliminary data for future studies on body fat distribution. In 2014, Katz et al.(Reference Katz, Vaccani and Clarke15) produced the NC reference values for the Canadian children and adolescents aged 6–17 years and they found that a NC above the 50th percentile was a sensitive predictor of overweight or obesity. Recently, Hosseini et al.(Reference Hosseini, Motlagh and Yousefifard20) developed NC percentiles of Iranian children and adolescents aged 7–18 years and they found a considerable difference between the Iranian and Canadian reference intervals. This indicates that the reference data of the developed countries may not be applicable to the developing nations due to the role of genetics, ethnicity, climate and geography that are significant and may cause disparity. In response of this momentous difference, this study was planned to construct the NC centile curves using a representative sample of the Pakistani children and adolescents aged 2–18 years. We hoped that our data could be used both for evaluating obesity and associated complications. These data may also be used for comparison purposes with the international data.
This study is the first to present NC percentile reference values for a wide age range of the Pakistani children from an adequate sample size. The NC centiles (5th–95th) derived by LMS and QR methods exhibited that neck size of both sexes continuously increased after 4 years of age which was in agreement with the earlier studies(Reference Mazicioglu, Kurtoglu and Ozturk14,Reference Katz, Vaccani and Clarke15) . The NC of boys gradually increased between 4 and 10 years, but after 10 years age, the increment in NC became prominent. This may be due to the increase in upper body subcutaneous fat deposition in boys during this age, while in the girls, subcutaneous fat deposition increases in the lower parts of the body. The same findings were also reported for the Turkish children and adolescents(Reference Mazicioglu, Kurtoglu and Ozturk14). A comparison by sex of smoothed median percentiles indicated that in 3–7-year-old children, the NC for boys was higher than those measured for the girls. The girls aged between 8 and 14 years had higher NC values than the boys had after which the trend reversed. The earlier reference data presented for the Turkish(Reference Mazicioglu, Kurtoglu and Ozturk14), Canadian(Reference Katz, Vaccani and Clarke15), Iranian(Reference Hosseini, Motlagh and Yousefifard20) and European population(Reference Nagy, Kovacs and Moreno31) showed that the standard curves of NC constantly increased with age affected by the pubertal period unlike other anthropometric measurements i.e. height, weight and BMI. In contrast, the NC was affected by puberty in our study; the mechanism by which this difference occurs is not clear and further studies are needed.
It is important to discuss the difference between centiles obtained by the QR and LMS statistical methods. We found a small difference in the median (50th) centiles between both methods. A study of the Turkish children by Mazicioglu et al.(Reference Mazicioglu, Kurtoglu and Ozturk14) also found a small difference between median original/empirical and LMS smoothed centiles in fewer age groups (see Fig. 2). However, this difference may be negligible. In addition, our results with small variability from empirical centiles suggest that both methods can be used to establish growth reference charts.
Various reports(Reference Hosseini, Motlagh and Yousefifard20,Reference Asif, Aslam and Altaf23) found that children grow differently over the globe due to genetic and environmental differences. Like other anthropometric parameters of the Pakistani children(Reference Asif, Aslam and Altaf23,Reference Aslam, Asif and Joiya32) , we also observed here a greater difference between the median (50th) NC values attained by the LMS and QR methods for both sexes and the values from the Turkish(Reference Mazicioglu, Kurtoglu and Ozturk14), Canadian(Reference Katz, Vaccani and Clarke15) and Iranian(Reference Hosseini, Motlagh and Yousefifard20) children. However, the increasing trend was parallel to other studies (see Fig. 3). The NC values reported for the Canadian children also differ from the Turkish children(Reference Mazicioglu, Kurtoglu and Ozturk14,Reference Katz, Vaccani and Clarke15) . An Iranian study by Hosseini et al. (Reference Hosseini, Motlagh and Yousefifard20) found that the NC reference data for 7–18-year-old children was substantially different from the composite data of the Canadian children. The disparity in the values of NC is probably due to statistical methodology. The QR model that was applied in the Canadian report was different from that used in the Turkish and Iranian studies. This may also be due to genetic and environmental differences between our studied population and other populations. These results infer that the use of NC growth references of other populations as standards for the Pakistani children would be seriously misleading. Therefore, it is necessary for every population to develop their own NC reference data. The same recommendation was also delivered by the European Commission on nutrition stating that each European nation should self-determine the usefulness of adopting WHO standards(Reference Turck, Michaelsen and Shamir33) for use in their country.
It is essential to suggest the NC percentiles be used as cut-offs to define overweight and obesity among children and adolescents. For example, in 2014, Katz et al. (Reference Katz, Vaccani and Clarke15) proposed NC 50th percentile values as a cut-off points for screening Canadian children with overweight and obesity (BMI > 85th percentile. Our reported NC centiles values were substantially lower than the Canadian reference data sets. Furthermore, our reference data using QR revealed that the 90th NC percentile for boys and 75th percentile for girls in the Pakistani population corresponds to the 50th Canadian percentile charts at most of the ages, indicating that 10 % of boys and 25 % of girls are either overweight or obese in the studied sample. Asif et al.(Reference Asif, Aslam and Wyszynska22) also established the NC cut-offs of overweight and obesity for the Pakistani boys and girls aged 5–14 years, using receiver operating characteristics curve analysis. Their derived cut-offs for overweight including obesity (BMI > 1 SD) of both sexes also corresponds to the 75th percentile values of our reference data set. Based on these results, we suggest that an NC above the 75th percentile is a sensitive predictor of overweight and obesity for the Pakistani children.
Although we collected a large and representative multi-ethnic sample for construction of the NC reference curves, this study still has some potential limitations. Firstly, this NC reference data set may not be applicable for screening children with overweight or obesity, that having cervical spine disorder, neck injury, neck-related malignancy and thyroid diseases which easily affect the size of their neck. Secondly, this study considered an urban and relatively wealthy study population. Future research should include multiple cohorts with participants of different age and socio-economic status to extend our findings. Another limitation is that the dataset used under study, included a small number of children aged 2 years and the NC data of newborn children or children up to 2 years of age was also not included in the study. Therefore, it is recommended that this gap should be filled in future studies because a sufficient increase in neck size is expected during this age. Despite these limitations, the present reference data contribute new information about public health and paediatricians may use this data for routine clinical examinations and other epidemiological purposes.
Using the LMS and QR method, we presented NC-for-age growth reference charts based on a comprehensive sample including children and adolescents aged 2–18 years. The results showed a little disparity between the LMS, QR percentiles and empirical percentiles. These findings suggest that both the LMS and QR can be used to develop growth reference charts. A momentous difference between our centiles and centiles of Canadian, Turkish and Iranian populations show that each country needs to establish its own growth charts since standard charts used from other countries provides misleading information. Our NC growth charts contain information for paediatricians and other epidemiological researchers, and may be applicable for assessment of growth and nutritional disorders of Pakistani children and adolescents. Additional studies from birth to 18 years of age and among adults should be necessarily carried out to establish NC growth reference charts by applying these two statistical methods.
Acknowledgements
Acknowledgements: We gratefully acknowledge to Dr. Nihal Hatipoglu, a Turkish paediatrician who studied it critically for important intellectual content and gave her expert opinion in finalising the manuscript. Financial support: This research received no specific grant from any funding agency, commercial or not-for-profit sectors. Conflict of interest: There are no conflicts of interest. Authorship: M.A.: Conceptualisation data collection, methodology, writing-original draft and formal analysis. M.A.: Supervision, conceptualisation, methodology, statistical analysis and final review. S.K., S.A., H.A. and J.W.: Conceptualisation, data curation, visualisation and roles/writing. S.A. and M.Q.: Writing- review and editing, Software and data analysis. All authors read and approved the manuscript as submitted. Ethics of human subject participation: This study was conducted according to the guidelines laid down in the Declaration of Helsinki and all procedures involving research study participants were approved by the Departmental Ethics Committee of Bahauddin Zakariya University, Multan, Pakistan (IRB# SOC/D/2715/19). Verbal informed consent was obtained from all subjects/patients. Verbal consent was witnessed and formally recorded.


