


Researchers employ nutrition knowledge questionnaires (NKQ) to benchmark levels of awareness of expert recommendations and to assess the effectiveness of nutrition education programmes using a pre-test/post-test method( Reference Sudman and Bradburn 1 , Reference Parmenter and Wardle 2 ). The development and validation of a questionnaire involves multiple complicated and time-consuming steps( Reference Parmenter and Wardle 2 ); this procedure can be prohibitive and the appropriate procedures are often overlooked( Reference Frary 3 ). In fact, a 2002 review of evaluation measures used in nutrition education research (in pre-school children, school-aged children, adults and pregnant women) found that only 55 % of the studies in adults which used a questionnaire reported on the reliability of measures( Reference Frary 3 ). Likewise, a 2015 systematic review of sixty studies that used questionnaires to assess athletes’ and coaches’ nutrition attitudes and nutrition knowledge found that about 70 % of the included studies used tools of unknown validity and reliability, and 67 % used tools that had not undergone pilot testing. The authors of the review noted a number of issues related to statistical analysis, such as failure to report power calculations, confidence intervals and effect sizes( Reference Kouvelioti and Vagenas 4 ). Furthermore, there are issues with the content of the measures employed: a 2016 review of nutrition knowledge in athletes and coaches found that many tools based their questions on outdated recommendations and did not consider health literacy or cultural appropriation( Reference Trakman, Forsyth and Devlin 5 ). The use of poor-quality NKQ limits the conclusions that can be drawn from research on nutrition knowledge. This was noted as early as 1985, in a meta-analysis by Axelson et al.( Reference Axelson, Federline and Brinberg 6 ) which reported on the correlation between nutrition knowledge and dietary intake. Similar conclusions were made in a 2014 review of the relationship between nutrition knowledge and diet quality, which reported a mean ‘questionnaire quality score’ of just 50 %( Reference Spronk, Kullen and Burdon 7 ).
Multiple journal articles and books have been published to provide guidelines for questionnaire development in the areas of behavioural psychology and management information systems( Reference Frary 3 , Reference Kline 8 – Reference Whati, Senekal and Steyn 11 ), but there is a paucity of literature adapting this information to the development of an NKQ. To our knowledge, the only recommendations that exist are in the article by Parmenter and Wardle( Reference Parmenter and Wardle 2 ) in 2000, entitled ‘Evaluation and design of nutrition knowledge measures’. These guidelines were employed to develop the widely used ‘General Nutrition Knowledge Questionnaire’ (GNKQ)( Reference Parmenter and Wardle 12 ) and have been followed by many other researchers developing nutrition knowledge measures( Reference Whati, Senekal and Steyn 11 , Reference De Souza, Kratzenstein and Hain 13 , Reference Alsaffar 14 ). Parmenter and Wardle( Reference Parmenter and Wardle 2 ) outline several techniques, based on Classical Test Theory (CTT), that are crucial for the psychometric validation of measurement tools. However, they do not recommend factor analysis, a technique that allows researchers to define potential ‘factors’ or nutrition sub-sections within their questionnaire( Reference Kim and Mueller 15 ). They also make no mention of other frameworks for validation such as Item Response Theory (IRT) which includes Rasch analysis( Reference Fan 16 , Reference Presser, Couper and Lessler 17 ), an approach that allows researchers to develop shorter scales with multiple response formats. Since 2016 multiple nutrition knowledge questionnaires have been adapted from existing tools or developed and validated( Reference Mötteli, Barbey and Keller 18 – Reference Bottcher, Marincic and Nahay 26 ); however, very few of these have undertaken factor analysis( Reference Guadagnin, Nakano and Dutra 22 , Reference Bradette-Laplante, Carbonneau and Provencher 24 ) or Rasch analysis( Reference Mötteli, Barbey and Keller 18 , Reference Motteli, Barbey and Keller 20 ).
The aim of the present review is to provide evidence-based recommendations for NKQ development and evaluation. The eight-step methodology (outlined in Box 1) integrates recommendations made by Parmenter and Wardle( Reference Parmenter and Wardle 2 ) and Pallant( Reference Pallant 27 ), and includes several crucial procedures from disciplines such as psychology and management information systems( Reference Kline 8 , Reference Briggs and Cheek 28 – Reference DeVellis 30 ) that are frequently overlooked in nutrition. The review may provide guidance for researchers who are interested in developing new nutrition knowledge measures and/or evaluating the quality of existing tools.
Box 1. Outline of methods
Development of the tool:
-
1. Definition of the construct and development of a test plan.
-
2. Generation of the item pool.
-
3. Choice of the scoring system and response format. Preliminary review of the items:
-
4. Assessment of content validity*.
-
5. Assessment of face validity*.
Further statistical analysis of measurement:
-
6. Purification of the scale using item analysis.
-
7. Evaluation of the scale including its (i) factor structure† and (ii) internal reliability†; OR Rasch analysis‡ including assessment of (i) dimensionality§ and (ii) internal reliability.
Final analysis:
-
8. Gathering of data to re-examine the questionnaire’s properties, assess temporal stability║ and confirm construct validity.
Notes
*These steps can be performed in reverse order.
†These steps are within a Classical Test Theory framework: item analysis includes item discrimination and item difficulty.
‡These steps are within an Item Response Theory framework and can also be performed after step 8.
§Dimensionality can be assessed in place of factor analysis.
║Temporal stability can also be performed after step 6.
Definitions and terminology
When reviewing the literature on questionnaire development, it is apparent that there are conflicting definitions for measurement properties related to reliability and validity. Throughout the present review, the definitions adopted are in line with those outlined in the COnsensus-based Standards for the selection of health Measurement INstruments (COSMIN) taxonomy (Table 1). COSMIN was originally developed for the assessment of Health Related Patient Reported Outcomes (HR-PRO); readers are encouraged to refer to these guidelines as an accompanying resource to the present review( Reference Mokkink, Terwee and Patrick 31 ).
Table 1 Definitions of psychometric measurement properties (adapted from the COSMIN taxonomy( Reference Mokkink, Terwee and Patrick 31 ))
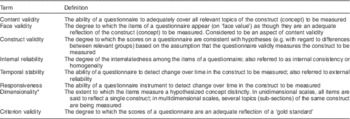
COSMIN, COnsensus-based Standards for the selection of health Measurement Instruments.
* This definition was not derived from COSMIN. In Classical Test Theory, dimensionality is determined by performing factor analysis.
Key methodologies and statistical considerations
Step 1: Definition of the construct and development of a test plan
Researchers should begin questionnaire development by defining the construct that they intend to measure( Reference Parmenter and Wardle 2 ). The definition should explain not only what the construct is, but also what it is not; knowledge should be distinguished from attitudes and behaviours. Developers may choose to adopt a generic definition, such as the one by Miller and Cassady( Reference Miller and Cassady 32 ): ‘Knowledge of concepts and processes related to nutrition and health including knowledge of diet and health, diet and disease, foods representing major sources of nutrients, and dietary guidelines and recommendations’. The exact topic of nutrition knowledge and the relevant nutrition sub-sections should be specified. Brown( Reference Brown 29 ) refers to this as a ‘test plan’ and recommends that the relative importance (weighting) of each item is outlined. The test plan is likely to be quite diverse, depending on the intended purpose of the questionnaire. For example, the GNKQ specified four nutrition sub-sections: dietary recommendations, sources of nutrients, choosing everyday foods and diet–disease relationship( Reference Parmenter and Wardle 12 ). In contrast, the nutrition sub-sections of a questionnaire designed to assess type 1 diabetes nutrition knowledge were: healthful eating, carbohydrate counting, blood glucose response to foods and nutrition label reading( Reference Rovner, Nansel and Mehta 33 ).
Step 2: Generation of the item pool
Once the construct has been defined and the test plan made, a pool of items to represent each nutrition sub-section should be developed( Reference Parmenter and Wardle 2 , Reference DeVellis 30 , Reference MacKenzie, Podsakoff and Podsakoff 34 ). A certain degree of redundancy in questions is recommended, so that questions that do not behave as expected can be removed at later validation stages( Reference DeVellis 30 ). DeVellis( Reference DeVellis 30 ) suggests that the number of items included in the first draft of the questionnaire should be up to three to four times the amount that will appear in the finalized version. Parmenter and Wardle( Reference Parmenter and Wardle 2 ) recommend writing twice as many questions as you want to have in your final tool.
The creation of new questionnaire items should be guided by expert opinion and the current literature including peer-reviewed journal articles and education materials available to the public. Items can also be taken from previous questionnaires, either in their original form or modified to suit the purpose of the research( Reference Parmenter and Wardle 2 ). If items from previous questionnaires are used, permission should be sought and credit given to the original authors( Reference Parmenter and Wardle 2 , Reference Fink 35 ).
The language used should be kept as simple and concise as possible. Double negatives and two-edged questions (‘a diet high in fruits and vegetables AND low in salt can help prevent high blood pressure’( Reference McLeod, Campbell and Hesketh 36 )) should be avoided( Reference Sudman and Bradburn 1 , Reference MacKenzie, Podsakoff and Podsakoff 34 , Reference Fink 35 , Reference Dawis 37 ) because they tend to be ambiguous and confuse respondents. Questions should be written as full sentences, and slang and abbreviations should not be used. Jargon and technical terms can be used with caution, provided the group being assessed is expected to be familiar with these terms( Reference Fink 35 ). In some instances, it is recommended that interviews with the target audience be conducted so that their vernacular can be accurately captured( Reference Dawis 37 ). The names used for foods must be commonly understood and relevant for the target audience. Where previous items are used, it may be necessary to make language adjustments. For example, when modifying the GNKQ (developed for a UK audience) to be used with an Australian sample, Hendrie et al.( Reference Hendrie, Cox and Coveney 38 ) used the term ‘35 % orange juice’ instead of ‘orange squash’. Similarly, when validating the GNKQ in a Turkish sample, Alsaffar( Reference Alsaffar 14 ) replaced ‘baked beans on toast’ with ‘piyaz’, which is a white bean salad commonly eaten in Turkey.
Step 3: Choice of the response format and scoring system
This step should be conducted simultaneously to writing the questionnaire items. There is no ideal response format and scoring system; the relative pros and cons of various options are outlined below and should be considered in relation to the specific purpose of the questionnaire that is being developed.
Response format
The first decision to make is whether open-ended (participants provide responses) or close-ended (pre-selected responses) will be used. The former are more difficult for respondents to answer and for researchers to code, and therefore are regarded as less reliable( Reference Fink 35 , Reference Rattray and Jones 39 ). The main benefit of open-ended questions lies in their ability to capture unexpected answers, for example when quotes or testimonies are required; they rarely provide an advantage where the aim is to measure nutrition knowledge( Reference Fink 35 ). A review of current nutrition measures revealed that with the exception of the diet–disease relationship section of the GNKQ( Reference Parmenter and Wardle 12 ), open-ended questionnaires are not used.
For close-ended questions, possible response formats include true/false, yes/no, Likert scale (e.g. ‘strongly agree’, ‘agree’, ‘disagree’, ‘strongly disagree’) and multiple-choice (usually with four to five options)( Reference Fink 35 ). Agree/disagree-type scales tend to reduce the feeling by participants that they are being tested and judged( Reference Sudman and Bradburn 1 ). Multiple-choice options are useful because the analysis of distractor options can provide valuable information regarding nutrition misinformation( Reference Presser, Couper and Lessler 17 ). It is not uncommon for participants to be able to select several options (e.g. ‘assuming equal weights please choose 10 foods that you think are high in fiber’( Reference Shepherd and Towler 40 )). In general, ‘select all options that are correct’ questions can be difficult to ‘code’ and score, and should be avoided where possible. Several authors who have developed an NKQ have employed a ‘not sure’ or equivalent category( Reference Parmenter and Wardle 12 , Reference Alsaffar 14 , Reference Hendrie, Cox and Coveney 38 , Reference Shepherd and Towler 40 – Reference Fanelli and Abemethy 44 ); however, many have chosen not to provide this option( Reference Collison, Kuczmarski and Vickery 45 – Reference Folasire, Akomolafe and Sanusi 48 ). The benefit of a ‘not sure’ option is that it may prevent respondents from correctly guessing the correct option, the chances of which are 50 % for dichotomous items( Reference Sudman and Bradburn 1 ). On the other hand, this category may provoke laziness, or lead those who have a good idea of responses to avoid answering if confidence is low( Reference Parmenter and Wardle 2 ). A range of question styles and responses is likely to be suitable. Sudman and Bradburn( Reference Sudman and Bradburn 1 ) even recommend that some pictorial questions are included to avoid monotony and reduce respondent fatigue.
Scoring system
The most common scoring system is to simply award a point for each time the correct option is selected( Reference Parmenter and Wardle 12 , Reference Alsaffar 14 , Reference Shepherd and Towler 40 ). Negative scoring can also be used (e.g. Zawila et al.( Reference Zawila, Steib and Hoogenboom 43 ) awarded 1 point for correct, 0 points for ‘not sure’ and deducted 1 point for incorrect options). Likert scales can be challenging to score; Hoogenboom et al.( Reference Hoogenboom, Morris and Morris 49 ) grouped ‘strongly agree’ and ‘agree’, and ‘strongly disagree’ and ‘strongly disagree’, and awarded 1 point where true statements were endorsed or false statements were renounced. Sedek and Yih( Reference Sedek and Yih 50 ) scored each question with 1 to 4 points, with 4 points being given if a true statement was strongly agreed with, 3 points for agree, and so on. Researchers should also consider whether a total summed score is appropriate or not. It has been suggested that total scores are appropriate only where the construct has been proved to be unidimensional( Reference Parmenter and Wardle 2 ). Sub-scores are likely to be important when gaps in knowledge need to be assessed for education purposes. Appropriate methodology for accurately assessing the dimensionality of measures is described in Box 3 and step 7.
The order in which questions are to be asked needs to be carefully considered. Ideally, the answer to one question should not be able to be ascertained from a preceding question( Reference Sudman and Bradburn 1 , Reference Parmenter and Wardle 2 ). A common recommendation is to start with easy, necessary non-threatening questions and to avoid asking demographic questions at the beginning if possible, because these can be seen as probing and therefore off-putting( Reference Rattray and Jones 39 ).
Step 4: Assessment of content validity
Once the items have been developed and the appropriate response formats determined, the questions should be reviewed by a panel of experts( Reference Sudman and Bradburn 1 , Reference Kline 8 , Reference MacKenzie, Podsakoff and Podsakoff 34 ). In the case of an NKQ, these should be dietitians or nutritionists, preferably working in a range of areas such as academia, private practice and industry. It may also be appropriate to include individuals with expertise in survey design. The aim of this step is to ensure that the tool has adequate content validity. That is, that questions being posed are relevant and cover all topics of the ‘construct’ as defined in step 1( Reference Polit, Beck and Owen 51 ).
Several researchers who have developed questionnaires state an expert panel review/review for content validity was performed( Reference Whati, Senekal and Steyn 11 , Reference Parmenter and Wardle 12 , Reference Zinn, Schofield and Wall 42 , Reference Feren, Torheim and Lillegaard 52 , Reference Jones, Lamp and Neelon 53 ), but they do not describe the way in which data were collected or analysed. It appears that qualitative data were collected in an ad hoc manner.
A broader search of the literature reveals that content validity can be quantified using several methods, such as the content validity index (CVI)( Reference Polit, Beck and Owen 51 ). In order to calculate the CVI, a group of three to ten experts is required. Each expert rates individual items for relevance on a 4-point Likert scale (1=‘very irrelevant’, 2=‘irrelevant’, 3=‘relevant’, 4=‘very relevant’). The CVI for each question is calculated by dividing the number of raters who scored the item as 3 or 4 divided by the total number of raters; a score above 0·8 is considered adequate. Ratings for accuracy, clarity and appropriateness can also be obtained and analysed qualitatively( Reference Polit, Beck and Owen 51 , Reference Wynd, Schmidt and Schaefer 54 ).
MacKenzie et al.( Reference MacKenzie, Podsakoff and Podsakoff 34 ) propose an alternative method for assessing content validity. This involves constructing a matrix with definitions of each nutrition sub-section the questionnaire is aiming to test listed along the top and the questionnaire items listed down the side. Each ‘rater’ then indicates on a 4- to 5-point Likert scale how well the item captures each sub-section (Table 2). Repeated one-way ANOVA can be used to assess if an item’s rating on each topic differs significantly; items should score higher on the topic they intend to assess (as per the test plan). This approach is appropriate only when fewer than eight to ten nutrition sub-sections are being assessed, allowing for the inclusion of some distractors (i.e. some nutrition sub-sections that are not being tested should be included in the matrix).
Table 2 A hypothetical example of an item rating task to assess content adequacy of a questionnaire (inspired by MacKenzie et al. ( Reference MacKenzie, Podsakoff and Podsakoff 34 ))
Numbers represent the perceived extent to which each item captures each aspect of the construct domain using a 5-point Likert-type scale ranging from 1 (‘not at all’) to 5 (‘completely’).
Step 5: Pre-testing and assessment of face validity
In addition to having the items reviewed by a panel of experts, a small sample of the target audience (ten to twenty participants) should also complete the questionnaire before recruiting the final sample( Reference MacKenzie, Podsakoff and Podsakoff 34 ). This step: (i) confirms that the instructions given are easy to follow and there are no technical issues with completing the tool (especially important if it is in an online format); (ii) gives an indication of how long the questionnaire will take to complete( Reference DeVellis 30 ); and (iii) allows face validity( Reference Mokkink, Terwee and Patrick 31 ) to be assessed.
As with content validity, the specifics of how pre-testing and face validity assessment have been conducted by researchers are unclear. In general, it is simply stated that feedback on topics such as clarity and understanding of items was obtained( Reference Venter 10 , Reference Raymond-Barker, Petroczi and Quested 55 ).
A reliable technique used for face validity assessment is the think-out-loud model, whereby participants verbalize their thought process as they complete each item( Reference Presser, Couper and Lessler 17 ). This can be done retrospectively; that is, the participant can complete the questionnaire in advance and then meet with the researcher to discuss his/her experience of completing the questionnaire( Reference Drennan 56 ). A less formal approach may be conducting a focus group where questions such as ‘what do you think this section is testing?’, ‘are you unfamiliar with any of the terms used in this question?’, ‘do you find this question confusing or intentionally misleading?’ can be asked, with responses being analysed to make necessary changes to terminology and wording of items.
It is not usually essential to redo face validity testing; however, this may be necessary if the sample being recruited is quite different from the cohort on whom the original test was validated. Many authors who have used pre-existing questionnaires have repeated these steps( Reference Alaunyte, Perry and Aubrey 57 , Reference Spendlove, Heaney and Gifford 58 ).
Step 6: Purification and refinement using item analyses
Once the items have been updated to ensure content and face validity, it is necessary to recruit another sample similar to the target sample to perform item analyses( Reference MacKenzie, Podsakoff and Podsakoff 34 ). Item analyses refers to a range of CTT techniques, including assessment of item characteristics, item difficulty and item discrimination( Reference Parmenter and Wardle 2 , Reference Kline 8 , Reference McCoach, Gable and Madura 9 , Reference DeVellis 30 , Reference Nunnally 59 ). The general features of CTT are covered in Box 2.
Box 2 Classical Test Theory: premise and sample size recommendations
-
● The underlying premise of Classical Test Theory (CTT) is that that a person’s true score on a measure is a function of their observed score and measurement error( Reference Presser, Couper and Lessler 17 ).
-
● Mathematically, CTT is based on correlations between items. Validation using CTT only applies to the group of people who were used to assess the tool; scales validated using these techniques need to be reassessed every time they are used( Reference Streiner 60 ).
-
● DeVellis( Reference DeVellis 30 ) suggests a sample size of 100 is ‘poor’, 200 is ‘fair’ and 300 is ‘good’; Parmenter and Wardle( Reference Parmenter and Wardle 2 ) advise that the number of respondents should be at least one greater than the number of questions. McCoach et al.( Reference McCoach, Gable and Madura 9 ) recommend six to ten times as many respondents as questions. These figures are often not achieved by researchers developing nutrition knowledge measures( Reference Whati, Senekal and Steyn 11 , Reference Alsaffar 14 , Reference Zinn, Schofield and Wall 42 ). MacKenzie et al.( Reference MacKenzie, Podsakoff and Podsakoff 34 ) note that if the correlation between items is a high, smaller sample sizes are likely to be appropriate.
Item characteristics
Gable and Wolf( Reference Gable and Wolf 61 ) suggest that response frequencies, means and standard deviations should be ‘screened’ and that researchers should consider removing items whose responses are very positively or negatively skewed (see below for recommended cut-offs)( Reference Pallant 27 , Reference Collison, Kuczmarski and Vickery 45 ). For multiple-choice questions, the frequency with which incorrect options are chosen should be assessed; Petrillo et al.( Reference Petrillo, Cano and McLeod 62 ) state options chosen by less than 5 % of participants are ‘non-functional distractors’ and should be modified. Parmenter and Wardle( Reference Parmenter and Wardle 2 ) recommend all distractors should be endorsed by an equal number of respondents. Assessment of distractor options does not appear to have been undertaken (or at least not reported) in the nutrition knowledge field( Reference Parmenter and Wardle 2 ).
Item difficulty
Item difficulty (sometimes called item facility( Reference Parmenter and Wardle 2 ) or item severity( Reference Cappelleri, Lundy and Hays 63 )) should be assessed by reviewing how frequently respondents answered individual questions correctly. If less than 20 % or more than 80 % of respondents answered an item correctly, its removal should be considered( Reference Kline 8 , Reference Parmenter and Wardle 12 ). Many researchers who have evaluated nutrition knowledge measures have removed items on this basis( Reference Whati, Senekal and Steyn 11 , Reference Parmenter and Wardle 12 , Reference Worme, Doubt and Singh 41 , Reference Steyn, Labadarios and Nel 64 , Reference Shifflett, Timm and Kahanov 65 ). However, individual questions may have utility beyond their contribution to the total knowledge score. For example, observing that responses to a question are consistently poor provides valuable information about gaps in knowledge. Therefore, researchers must employ pragmatic decision-making processes before deleting or modifying items( Reference DeVellis 30 ).
Item discrimination
If a person does well overall but poorly on a particular item (and vice versa), the item is said to be a poor judge (or discriminator) of knowledge( Reference Parmenter and Wardle 2 ). Item discrimination can be assessed based on the correlation between an item and the total score (minus the item of interest). Minimum correlation coefficients of 0·2–0·3 are recommended( Reference Parmenter and Wardle 2 , Reference Nunnally 59 ). Pearson’s correlation coefficient should be used if questions are multi-choice, and point-biserial correlation, which is a special case of Pearson’s r, should be used if items are dichotomous( Reference Meyer 66 ); in previous literature, either the distinction between these statistics has not been made( Reference Parmenter and Wardle 2 ) or it is unclear what correlation coefficient has been used( Reference Steyn, Labadarios and Nel 64 , Reference Glanz, Kristal and Sorensen 67 , Reference Dwyer, Stolurow and Orr 68 ). A second method for item discrimination, described by Cappelleri et al.( Reference Cappelleri, Lundy and Hays 63 ), is to divide respondents into high scoring and low scoring groups (using cut-offs such as 25th and 75th percentile) and to then evaluate the percentage of individuals in each group who endorsed correct/incorrect statements.
Inter-item correlations
The inter-item correlations among scale items can also be evaluated( Reference Gable and Wolf 61 ). It is said that items with very high correlations (r=0·7) may be measuring the same thing, whereas items with low correlations (r=0·3) may reflect items that are too diverse to be assessing a single construct( Reference Pallant 27 , Reference Briggs and Cheek 28 ). Assessment of inter-item correlations does not appear to have been performed in previous studies that have used psychometrics to validate nutrition knowledge measures. This may be because in an achievement test (as opposed to a personality type test) more items may be required to assess certain constructs such as knowledge of hydration, yet knowledge of these items would be expected to be highly correlated. We recommend that it is still worthwhile assessing inter-item correlations; however, item pairs with high correlations should be assessed qualitatively to decide if they are redundant before removing one of them.
Box 3 Factor structure and dimensionality
For a measurement tool to be described as unidimensional, all of its items must be measuring the same underlying construct( Reference Briggs and Cheek 28 ). In the nutrition knowledge field, the ‘dimensions’ in a scale are usually defined by the questionnaire developer a priori. For example, expert opinion is used to decide that items one to four assess knowledge of government-endorsed ‘dietary recommendations’ and hang together in their own sub-section( Reference Parmenter and Wardle 12 ). However, there is minimal evidence of authors undertaking a formal assessment of factor structure using Classical Test Theory (CTT)( Reference Bradette-Laplante, Carbonneau and Provencher 24 , Reference Dwyer, Stolurow and Orr 68 , Reference Lin and Ya-Wen 69 ). An outline of how to undertake factor analysis using CTT is described in step 7a. An alternative is to use Rasch analysis to confirm unidimensionality( Reference Mötteli, Barbey and Keller 18 , Reference Motteli, Barbey and Keller 20 ). Additional detail on Rasch analysis is outlined in Box 4 and step 7b.
Step 7a: Evaluation of the scale’s factor structure (using exploratory factor analysis) and internal reliability
Exploratory factor analysis (EFA) is a CTT technique that allows for a mathematical ‘exploration’ of the number of variables or ‘factors’ within a scale( Reference Briggs and Cheek 28 , Reference Nunnally 59 ). EFA provides information regarding the underlying dimensionality of the measure( Reference Kim and Mueller 15 , Reference Pallant 27 ). The most commonly used technique to assess factor structure is principal components analysis (PCA)( Reference Pallant 27 , Reference Briggs and Cheek 28 ). In CTT, data must be assessed to ensure several conditions are met before proceeding with PCA. These include an adequate sample size, inter-item correlations of at least 0·3, a significant (P≤0·05) Bartlett’s test of sphericity, and a Kaiser–Meyer–Oklin (KMO) measure of sampling adequacy (MSA) of at least 0·6( Reference Pallant 70 ). A common assumption for using PCA is that variables must be continuous( Reference Woods 71 ). However, if variables are dichotomous (e.g. right/wrong), which is often the case with NKQ, factor analysis can still be conducted, provided tetrachoric rather than Pearson’s r correlations are used( Reference Woods 71 ).
Deciding how many factors your tool has is both an art and a science, and often a single solution does not exist. In CTT, the final decisions should be based on results of a variety of tests including Kaiser’s criterion, Cartel’s scree plot and percentage variance( Reference Pallant 27 , Reference Pallant 70 ). If a measure is found to have more than one factor, the researcher can rotate the factor solution to assist in deciphering which items belong to which factor. Factors that are rotated are often less ambiguous and therefore easier to interpret( Reference Yong and Pearce 72 ).
Lin and Ya-Wen( Reference Lin and Ya-Wen 69 ) performed factor analysis when developing an NKQ for use in elderly Taiwanese and found that the questionnaire had three subscales: nutrition and disease; requirements of food groups; and nutrients in food. Bradette-Laplante et al.( Reference Bradette-Laplante, Carbonneau and Provencher 24 ) conducted EFA on an NKQ developed for a Canadian population and found that the tool had only one factor. Guadagnin et al.( Reference Guadagnin, Nakano and Dutra 22 ) developed a questionnaire to assess the effectiveness of a nutrition education programme in the workplace and found it had four factors.
For more detailed information on performing factor analysis using CTT, the reader is directed to other publications( Reference Briggs and Cheek 28 , Reference Woods 71 – Reference Mislevy 74 ).
Internal reliability in Classical Test Theory
Internal reliability assesses the degree to which items within a questionnaire measure different topics of the same construct. A high measure of internal reliability is said to be reflective of a small degree of random error( Reference Kline 8 ). Internal reliability is considered one of the most important determinants of reliability within the CTT framework( Reference DeVellis 30 ). It is assessed using Kruder–Richardson (KR-20) for dichotomous scales and Cronbach’s alpha (Cα) for items with more than two responses( Reference Streiner 60 ). Both statistics range from 0 to 1, with 1 indicating perfect correlation; a cut-off point of 0·7 is frequently cited as adequate( Reference Parmenter and Wardle 2 , Reference Nunnally 59 ). It is important to consider the limitations of these statistics. These include:
-
∙ Not appropriate for multidimensional questionnaires. Cα and KR-20 presume that all items are an equal measure of the underlying construct. Therefore, they should be used only if a scale is found to be unidimensional, or should be used only on individual sub-sections of an NKQ( Reference Streiner 60 ). In NKQ, it is common for Cα to be reported for individual nutrition sub-sections (that assess a particular topic of knowledge) rather than the scale as a whole. A good option may also be to run Cα or KR-20 according to factor structure, after factor analysis has been performed.
-
∙ Not appropriate for longer questionnaires. Long questionnaires will automatically achieve a higher Cα( Reference Kline 8 ). Therefore, to avoid a falsely ‘respectable’ Cα or KR-20, Streiner( Reference Streiner 60 ) recommends that it should not be used on scales that have more than twenty items.
-
∙ Values are difficult to interpret. While some authors state very high Cα (r=0·9) is favourable( Reference Nunnally 59 ), others argue that these values may point to redundancy in items and that inter-item correlations are, in fact, a better measure of reliability( Reference Briggs and Cheek 28 ).
Step 7b: Rasch analysis to evaluate items including assessment of (i) dimensionality (ii) and internal reliability
The general characteristics of IRT and Rash analysis are covered in Box 4.
Box 4 Item Response Theory: premise and sample sizes
-
● The underlying premise of Item Response Theory (IRT) is that the probability of an individual answering a particular item correctly is dependent on the underlying level of the construct being measured (e.g. his/her level of nutrition knowledge and the difficulty of the item)( Reference Presser, Couper and Lessler 17 ). This is represented graphically, using item characteristic curves (ICC) for dichotomous items or category response curves (CRC) for multiple-choice and Likert-scale items( Reference Cappelleri, Lundy and Hays 63 ).
-
● Rasch analysis is one of the most commonly used IRT models( Reference Presser, Couper and Lessler 17 ). Rasch analysis involves performing multiple different types of ‘diagnostics’ before making a final decision on which items and response formats to modify and whether to delete certain persons from the analysis or not( Reference Cappelleri, Lundy and Hays 63 ).
-
● Scales that are shown to fit the Rasch model are said to be inherently valid( Reference Presser, Couper and Lessler 17 ); this is because IRT does not rely on measures of central tendency which are influenced by the sample characteristics.
-
● Sample sizes for IRT vary widely, but are smaller for Rasch models compared with other IRT techniques. For models with dichotomous items (which nutrition knowledge measures are likely to be), 200 respondents is thought to be adequate( Reference Mötteli, Barbey and Keller 18 , Reference Tennant and Conaghan 75 ).
Rasch analysis aims to produce scales that are unidimensional; multidimensionality can result in misfit to the Rasch model( Reference Tennant and Conaghan 75 ). During Rasch analysis, dimensionality can be assessed by conducting a PCA on ‘residuals’. Residuals are calculated based on the differences between observed and expected data( Reference Presser, Couper and Lessler 17 ). PCA on residuals results in identification of sub-sets of items, which can then be assessed for similarity to/differences from each other using a t test( Reference Tennant and Conaghan 75 ). In Rasch analysis internal reliability can be evaluated using the person separation index (PSI). The PSI is evaluated using the same criteria as Cα, with a value of 0·7 said to be indicative of adequate internal reliability( Reference Tennant and Conaghan 75 ).
Rasch analysis has been used to validate a scale on clinical nutrition literacy( Reference Guttersrud, Dalane and Pettersen 76 ). Likewise, Motteli et al.( Reference Motteli, Barbey and Keller 20 ) used Rasch analysis to develop scales on practical knowledge of balanced meals( Reference Motteli, Barbey and Keller 20 ) and the energy content of meals( Reference Mötteli, Barbey and Keller 18 ). The authors noted that in their studies, the ability of Rasch scaling to separately estimate item difficulty and person ability, and to develop brief tools, offered a major advantage over CTT.
Detailed instructions regarding how to complete PCA on residuals, and Rasch analysis in general, are beyond the scope of the current review. Largely because the program used (RUMM, WINSTEPS, POLM, MULTILOG, PAESCALE, BILOG or NLMIXED) has an effect on the statistics (also referred to as ‘indicators’) produced( Reference Tennant and Conaghan 75 ), it is likely that specialized training will be needed to complete this type of analysis. For additional information on Rasch analysis, the reader is directed to Tennant and Conaghan( Reference Tennant and Conaghan 75 ), Pallant and Tennant( Reference Pallant and Tennant 77 ), Pallant( Reference Pallant 27 ) and Presser et al.( Reference Presser, Couper and Lessler 17 ). A table outlining the definition and interpretation of key statistics produced during Rasch analysis, with examples relevant to the RUMM program, is available in the online supplementary material, Supplemental Table 1.
It is not necessary to conduct factor analysis AND Rasch analysis; scales that are found to have multiple factors are likely to be multidimensional and misfit the Rasch model( Reference Al-shair, Kolsum and Berry 78 ). However, item analysis (step 6, within the CTT framework) and Rasch analysis (step 7b, within the IRT framework) can be conducted on the same scale. Readers may choose to review examples of scales that have been validated using both CTT and IRT, such as Fan( Reference Fan 16 ). If this approach is taken, indicators from each framework will need to be compared and contrasted before making decisions about which items to delete, modify and keep.
Step 8: Gather data to re-examine and assess validity using known-group comparisons/cross-validate the scale
Once steps 1 to 6 have been performed, you may find you have a questionnaire that is considerably different from the one with which you started. Therefore, it is preferable to re-administer the tool to a new sample, so that item analysis and reliability can be re-evaluated( Reference MacKenzie, Podsakoff and Podsakoff 34 ). If it has not yet been performed, factor analysis or Rasch analysis can also be attempted at this time. There are examples in other disciplines of scales that have been used for many years before being analysed to assess if they meet the Rasch model( Reference Pallant and Tennant 77 , Reference Hagquist, Bruce and Gustavsson 79 ). This ‘second pilot’ can be used to assess construct validity and temporal stability, although these could also technically be conducted at the same time (on the same sample) as item analysis.
Construct validity
Construct validity can be assessed by performing known-group comparisons( Reference Mokkink, Terwee and Patrick 31 ); that is, by statistically comparing mean scores of groups that you expect to do well with mean scores from participants whose knowledge should not be as high. This serves to confirm the test is measuring what you think it is( Reference Parmenter and Wardle 2 ). Previous researchers developing nutrition knowledge measures have done this by comparing: home economics and other students, university dietetic and non-dietetic students( Reference Whati, Senekal and Steyn 11 ), university students studying nutrition with individuals without nutrition education( Reference Hendrie, Cox and Coveney 38 ), dietetic students v. nursing interns( Reference Steyn, Labadarios and Nel 64 ), individuals with v. without nutrition qualifications( Reference Dickson-Spillmann, Siegrist and Keller 80 ), and nutrition experts v. computer experts( Reference Parmenter and Wardle 2 ). Previous researchers have found that females’ knowledge is greater than males’ knowledge and that age (middle age > young > elderly) can have an effect on nutrition knowledge( Reference Parmenter and Wardle 12 ). However, some caution needs to be taken if using these relationships to assess construct validity, because there is some conflict regarding whether they always occur( Reference Trakman, Forsyth and Devlin 5 ).
Temporal stability
Temporal stability (also referred to as external reliability in the nutrition knowledge field)( Reference Parmenter and Wardle 2 ) can be assessed using the test–retest method; that is, by administrating the test on two separate occasions and assessing the correlations between individuals’ scores on the two attempts, using Pearson’s r. Correlation should be about 0·7( Reference Parmenter and Wardle 2 ). The time between test attempts should be long enough that exact answers provided are forgotten, but short enough that no new information is learnt; two weeks are commonly used( Reference Parmenter and Wardle 2 , Reference Zinn, Schofield and Wall 42 , Reference Abood, Black and Birnbaum 81 , Reference Shoaf, McClellan and Birskovich 82 ). A limitation of this method is that motivated individuals may look up the answers to questions they answered incorrectly and thereby increase their knowledge between test occasions.
Additional types of validation that may be relevant are outlined in Box 5.
Box 5 Occasionally recommended supplementary validation
Criterion validity
If a gold standard tool for measuring nutrition knowledge exists, a new tool is unlikely to be developed. Therefore, in the field, this type of validity is likely to be required only if a shortened form of an existing validated questionnaire is being developed( Reference Dickson-Spillmann, Siegrist and Keller 80 ).
Responsiveness
Researchers who are intending on using their questionnaire to assess changes in knowledge over time, or before and after an education programme, should also validate their tool for responsiveness. Responsiveness is most commonly measured by developing a hypothesis that outlines expected changes and then administering your tool alongside a gold standard at two time points to test the hypothesis( Reference Mokkink, Terwee and Patrick 31 ). Responsiveness testing is rare in previous nutrition knowledge measures; however, it was conducted in validation of the recently revised GNKQ( Reference Kliemann, Wardle and Johnson 21 ). For more information on responsiveness in health measures, readers are directed to Hays et al.( Reference Hays, Anderson and Revicki 83 ).
Conclusions and implications for practice
In conclusion, the measurement of nutrition knowledge is an important consideration for individuals working in the nutrition field. We have outlined key methodologies and considerations for researchers who are interested in developing or evaluating a nutrition knowledge measure. Many published NKQ fail to adequately describe how content and face validity were assessed, have not undergone assessment of distractor utility, and have not had their dimensionality assessed. Improved methods used in the development of NKQ will enable more confidence in reported measures of nutrition knowledge. The authors recommend that all new measures to assess nutrition knowledge consider the methodologies described in the present review. Likewise, it is recommended that existing scales undergo factor analysis or Rasch analysis to confirm their dimensionality, reliability and validity.
Acknowledgements
Acknowledgements: The authors would like to acknowledge Julie Pallant, whose tutelage at the 2016 ASCPRI (Australian Consortium for Social & Political Research Inc.) course, ‘Scale development, Rasch Analysis and Item Response Theory’, was invaluable in building our understanding of questionnaire development. Financial support: This work was supported by an Australian Government Research Training Program Scholarship. Conflict of interest: None. Authorship: G.L.T. developed the guidelines. All authors contributed to writing and revising the paper for intellectual content. Ethics of human subject participation: Not applicable.
Supplementary Material
To view supplementary material for this article, please visit https://doi.org/10.1017/S1368980017001471


