


Inadequate intake of healthy foods (fruits, vegetables, whole grains and nuts/seeds) and excessive intake of foods high in Na, added sugars and saturated fat are major contributors to excess morbidity and premature mortality worldwide(1,2) . In the USA, approximately half of all cardio-metabolic deaths are attributable to suboptimal intake of fruits, vegetables, nuts, seeds and whole grains and excess consumption of salt, processed meats and sugary beverages(Reference Micha, Penalvo and Cudhea3) and per the dietary guidelines outlined by the American Heart Association to maximise cardiovascular health, 45·6 % of Americans adults are estimated to have a ‘poor diet’, with <10 % consuming adequate amounts of fruits and vegetables(Reference Rehm, Penalvo and Afshin4).
Poor dietary habits and inadequate physical activity are major drivers of elevated BMI, which in turn increases the risk of developing adverse cardio-metabolic outcomes(Reference Willett, Koplan, Nugent, Jamison, Breman and Measham5). Diet and physical activity also represent the most actionable areas at both the individual and population levels to prevent chronic disease(6). While the majority of dietary recommendations are geared towards average effects with measurable benefits to population health, the science of precision nutrition has been uncovering informative subgroup variation.
For example, among those who consume 22 g/d or more of saturated fat, weight gain was more pronounced among those with the –265 C/C genotype of APOA2, an estimated 10–20 % of the population, compared with those without it(Reference Corella, Peloso and Arnett7). However, longer term health consequences, such as varying cardio-metabolic disease risk across combinations of exposures, are not well understood. While precision nutrition has been described as a major priority for epidemiology(Reference Hu and Willett8), the vast majority of studies published to date are underpowered for more granular discovery.
In order to advance our understanding of how nutritional and other factors interact and impact health, data are needed from large populations followed over time. Since 2017, over 500 000 genotyped 23andMe research participants answered a survey about their dietary habits over the past month. Due to the growing size of the customer database, widespread geographical representation and continuous data collection over time, data provided by 23andMe research participants now represent a large enough sample to inform population-based inferences for a variety of health behaviours, including diet.
However, because 23andMe participants are a subsample of 23andMe personal genome service customers, they are not a representative sample of the general population. Therefore, the aim of this manuscript is to describe how the sociodemographic profile and dietary habits of the 23andMe research participants compare with the US population, to characterise its dietary habits using survey weights that account for potential imbalances and to test cross-sectional associations between BMI and consumption of several food items in this uniquely large cohort. Our manuscript illustrates both the potential and the caveats of conducting nutritional epidemiology research in large-scale digital cohorts.
Methods
This study used data from consented 23andMe research participants from the US aged 20 years or older who completed the National Health and Nutrition Examination Survey (NHANES) 2009–2010 dietary screener questionnaire on the 23andMe website or mobile application.
This study was conducted according to the guidelines laid down in the Declaration of Helsinki, and all procedures involving research study participants were approved by the Ethical and Independent Review Services, a private independent institutional review board. All 23andMe customers consent to participate in research online, and consent is captured electronically. Ethical and Independent Review Services approved this form of informed consent and waived the requirement to obtain signed consent under US law 45 CFR 46·117(c).
Customer data are de-identified; 23andMe researchers who conducted the statistical analyses in this manuscript did not have access to personally identifiable information (e.g. name and address) and were trained in the responsible conduct of research. 23andMe has obtained a Certificate of Confidentiality from the National Institutes of Health, further protecting the privacy of research participants. Additional consent form information is available at www.23andme.com/about/consent.
Data collection
Once a 23andMe personal genome service customer receives their sample collection kit, they are asked to register it online prior to return. During this process, all customers are invited to participate in research, which occurs predominantly through web-based research surveys, some of which are developed in-house by 23andMe and others are implemented using previously validated instruments. Beginning in March 2017, dietary intake frequencies were collected using a validated web-based version of the self-administered 25-item NHANES dietary screener questionnaire (DSQ) (2009/2010)(9). Accompanying surveys provided self-reported data on covariates such as age, sex, race/ethnicity, education and BMI. The questions on race/ethnicity and education utilised the same response options as the US Census. Participant recruitment to the surveys took place through two approaches, actively through email and passively through the website and mobile application. Passive recruitment on the website occurs via the ‘research stream’, which is a feature on the 23andMe website and within the 23andMe app (available on both iOS and Android devices) which continuously surfaces surveys to eligible respondents on a variety of topics.
As such, the DSQ was fielded to those who had likely already completed higher priority surveys such as the Health survey (which collects data on basic demographics, health and disease status), or disease-specific surveys based on conditions they may have reported. Because of this passive recruitment targeting scheme, we do not know the total population of people who were offered the survey, and therefore cannot directly estimate a survey response rate.
Dietary assessment and intake estimation
The DSQ measures intake of fruits and vegetables (cups/d), dairy (cups/d), Ca (mg), added sugars (g), whole grains (ounce equivalents) and fibre (g)(10). Total fruit includes both whole fruit and fruit juice, vegetable intake is estimated from consumption frequency of salad, potatoes, beans, tomato sauce, salsa, pizza toppings and other vegetables. Dairy intake is estimated from milk, cheese, ice cream and pizza. Whole grains are derived from cereals, whole-grain bread, popcorn and whole-grain rice. Added sugars are derived from soda, fruit drinks, cookies/cakes/pie, doughnuts, ice cream, added sugar/honey in coffee or tea, candy and cereal. Added sugars from sugar-sweetened beverages are derived from soda, fruit drinks and sugar/honey added to coffee or tea(10).
The DSQ and scoring algorithms to derive broader food groups were validated against dietary intake using the 24-h recall method in a representative population of non-institutionalised US-based NHANES study participants aged 2–69 years(Reference Thompson, Midthune and Kahle11). In that context, the DSQ was reported to produce stable estimates of intake for this set of dietary factors and correlate well with 24-h recall estimates in three external study populations(Reference Thompson, Midthune and Kahle11). In the DSQ, individual food items are ascertained as frequency over the past month. Based on the data processing and scoring procedures recommended for use with the DSQ, we converted monthly estimates to daily estimates and then multiplied the latter by item-specific portion and serving size estimates provided according to age and sex(12). Components of cereals such as sugar, fibre and whole-grain content were derived from the classifications on a per cereal basis provided by NHANES.
To evaluate the percent of the population meeting dietary recommendations, we estimated the proportion of participants within strata of age and sex who met the United States Department of Agriculture’s Dietary Guidelines for Americans 2015–2020 recommended intake of fruits and vegetables(13).
Time trends and maps
Mean daily intake and 95 % CI were plotted by week of survey completion to explore seasonal variation in dietary intake. Although the data collected refer to the past month, we did not apply a lag period or adjust the date in any way. Broader temporal changes in reported dietary habits over time are visualised with loess curves.
Participants self-reported their current zip code, which we subsequently mapped to states, to characterise the geographic distribution of average intake of food groups, select food items and average BMI across the US Regional average intake was estimated for the South (Delaware, District of Columbia, Florida, Georgia, Maryland, North Carolina, South Carolina, Virginia, West Virginia, Alabama, Kentucky, Mississippi, Tennessee, Arkansas, Louisiana, Oklahoma and Texas), West (Arizona, Colorado, Idaho, New Mexico, Montana, Utah, Nevada, Wyoming, Alaska, California, Hawaii, Washington and Oregon), Northeast (Connecticut, Maine, Massachusetts, New Hampshire, Rhode Island, Vermont, New Jersey, New York and Pennsylvania) and the Midwest (Indiana, Illinois, Michigan, Ohio, Wisconsin, Iowa, Kansas, Minnesota, Missouri, Nebraska, North Dakota and South Dakota).
For this analysis, the foods selected for seasonality were those with the most pronounced seasonal trends: chocolate, fruit, ice cream and salad. Those selected for mapping showed the most pronounced geographic patterns: fruit, vegetables, whole grains, red meat, processed meat, dairy and pizza.
Development of survey weights
To address differences between our respondent population and the national population (Table 1), we developed survey weights and applied them to our sample. We used iterative proportional fitting to calculate weights based on age (20–64, 65+), sex (M, F), race (white, non-white), education (less than college, completed college) and BMI (obese, not obese). We weighted our sample proportion to match the demographic distribution as reported by the US Census (age, sex, race, education)(14) and the Centers for Disease Control and Prevention(15). We excluded respondents (n 156, 053) from the raking procedure (implemented via the survey package (version 3.29.5)(Reference Lumley16) in R) and subsequent analyses if they did not provide this demographic information. To address the increase in se that may be introduced with large sample weights, we chose binary classifications instead of utilising all strata (e.g. for BMI) and trimmed all initial weights to be <5 times the mean survey weight(Reference Battaglia, Izrael and Hoaglin17).
Table 1 Respondent characteristics with complete data on age, sex, education, race/ethnicity and BMI compared with the national population drawn from the US Census

Dietary intake associations with BMI
To measure the cross-sectional correlation between dietary intake and BMI, we explored the association between each food item continuously using the daily frequency or estimated quantity for derived measures, but ultimately classified intake by tertiles for ease of interpretation and standardisation of quantity (high- v. low-intake frequency). We limited our sample to participants who self-reported height and weight values yielding estimated BMI scores between 14 and 70. We evaluated BMI both with and without log transformation.
During model development, race/ethnicity, education, age, sex, age × sex and age squared were evaluated as potential confounders. The final linear models tested the associations between food intake frequency (highest v. lowest consumption tertiles for all food items measured in the DSQ) and log-transformed BMI, adjusting for race/ethnicity, education, age (centred at 50 years), sex and centred age squared to maximise the variance explained by the model and the uniformity of the plotted residuals. We estimated regression coefficient estimates and 95 % CI for each food item to evaluate the relationship between frequency of intake and BMI.
We used R (R Foundation for Statistical Computing, version 3.2.5) for all statistical analyses and data visualisation.
Results
Respondent characteristics
A total of 526 774 US-based respondents with non-missing data for sex, age, education, race/ethnicity and BMI completed the DSQ between March 2017 and August 2019. Compared with the US population, sample respondents were more likely to be female (65 % v. 50 %), more likely to be white (86 % v. 77 %), less likely to be Hispanic (6 % v. 18 %), nearly twice as likely to have completed college (59 % v. 30 %) and less likely to be obese (31 % v. 36 %). Application of sampling weights yielded a more representative sample based on age, sex, education and BMI.
Temporal characteristics of dietary intake
Due to the high rate of gift giving of the 23andMe genetic testing kit during the holidays, survey completion between late December and early January is on average 4–5 fold greater than the average of other weeks throughout the year. Due to this high degree of response in these months, the precision of the estimates by season is highest over the Northern Hemisphere winter period as compared with other seasons (Fig. 1).
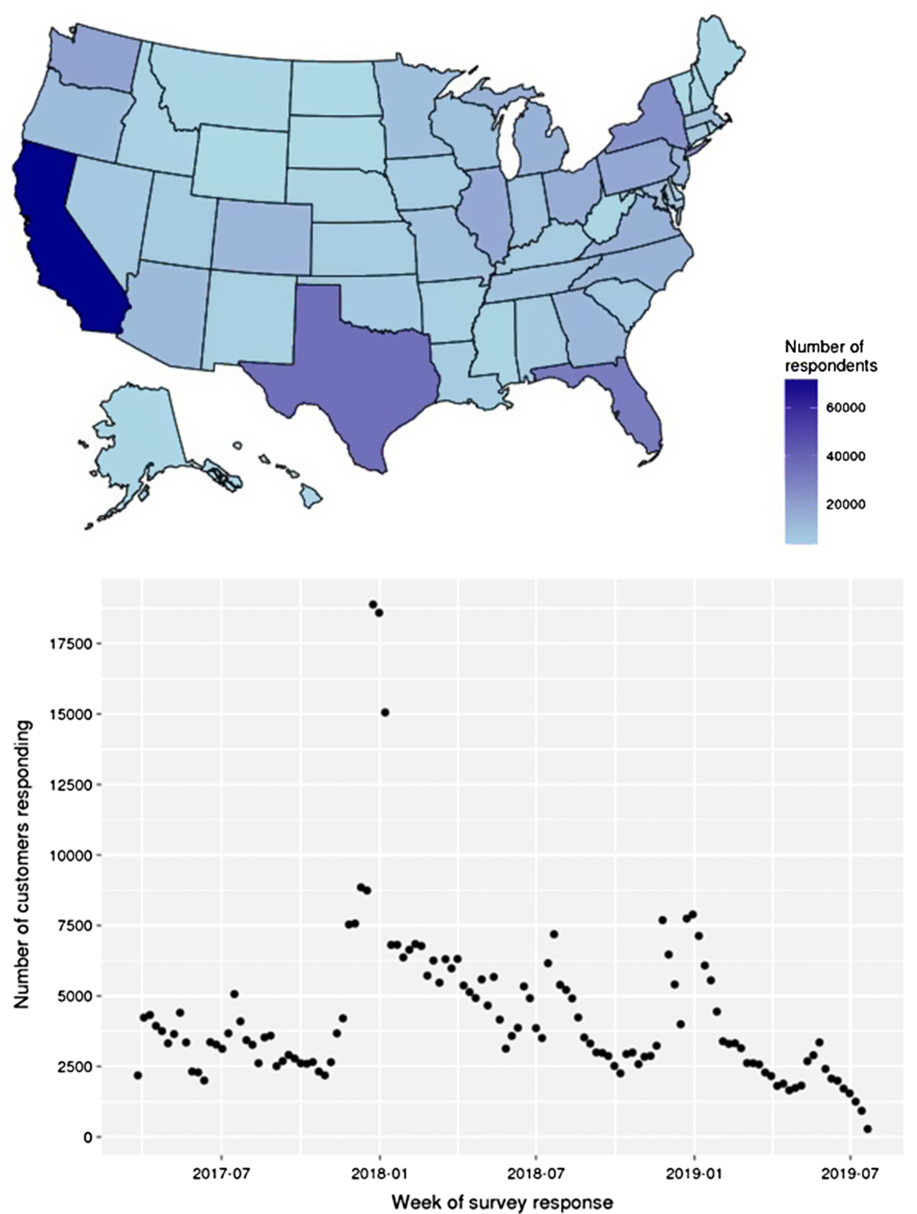
Fig. 1 Survey completions by state (A) and week (B) during interval of data collection
Because survey data have been collected continuously over 2 years, seasonal trends in dietary frequencies are observable. Fig. 2 shows the unadjusted mean daily intake patterns for fruit, vegetables, salad, chocolate and ice cream. Chocolate and ice cream show clear seasonal patterns, with peak chocolate consumption (0·42 times/d) in December–January compared with the lowest consumption in mid-June of 0·31 times/d. Peak ice cream consumption is observed in June–August, with an average frequency of 0·17 times/d compared with 0·01 times/d in February.

Fig. 2 Seasonality patterns of chocolate, fruit, ice cream and salad average daily intake by week of survey completion, 2017–2019. Food item: ![]() , chocholate;
, chocholate; ![]() , fruit;
, fruit; ![]() , ice cream;
, ice cream; ![]() , salad
, salad
Milk consumption, which includes both soyabean and dairy, declined by approximately 28 % between 2017 and 2019 following a pattern evident since the 1970s(Reference Battaglia, Izrael and Hoaglin17) and observed in the NHANES study between 1992 and 2001(Reference Rehm, Peñalvo and Afshin19). However, only a very minimal decline in total dairy consumption is observed over time, likely owing to observed increases in cheese and pizza consumption (see online supplementary material, Supplemental Fig. S1).
For fruits and vegetables, we observed higher reported consumption in Northern Hemisphere summer than winter (Fig. 2), but also noted a general decline over the reporting period (Fig. 3). We have explored various possible explanations for this observation, such as changing customer demographics (e.g. age, sex or type of genotyping kit purchased or the influx of winter customers), but saw no clear explanatory patterns. Further, because national published estimates are not yet available for this time period, we have no comparison on which to support or refute the observation that fruit and vegetable consumption is declining in the general population.

Fig. 3 Mean and 95 % CI with loess curves of the of intake frequency reported by week of data collection for vegetables, fruit, dairy and added sugars, over the 2-year data collection period (2017–2019)
Spatial characteristics of dietary intake
The respondent population show high geographical coverage across the USA (Fig. 1), with a minimum of 1000 respondents in every state. Higher proportions of respondents were from high population density states (California, Texas and Florida). By exploring the fraction of respondents as a percent of the total adult population, we observed relative overrepresentation in California, Florida and Pennsylvania and underrepresentation in Nebraska, South Dakota and Vermont.
Minor regional differences are noted when comparing data in aggregate (Table 4), but intake frequencies plotted at the state level show distinct dietary patterns by region. In the Southeastern states, fruit, vegetable and whole-grain intake is markedly lower than in coastal areas, and intake of processed meat, regular soda and added sugars is comparatively higher. Higher average intake of milk, pizza and red meat is observed in the northern Midwestern states, and while lower vegetable intake is observed, fruit and whole-grain intake is similar to coastal areas (Fig. 3). Dietary frequencies that correspond to higher BMI in Fig. 4 are also demonstrated to spatially correspond with patterns of higher BMI at the state level (e.g. higher frequency of processed meat and lower consumption of fruits, vegetables and whole grains in the southern US where BMI is the highest).
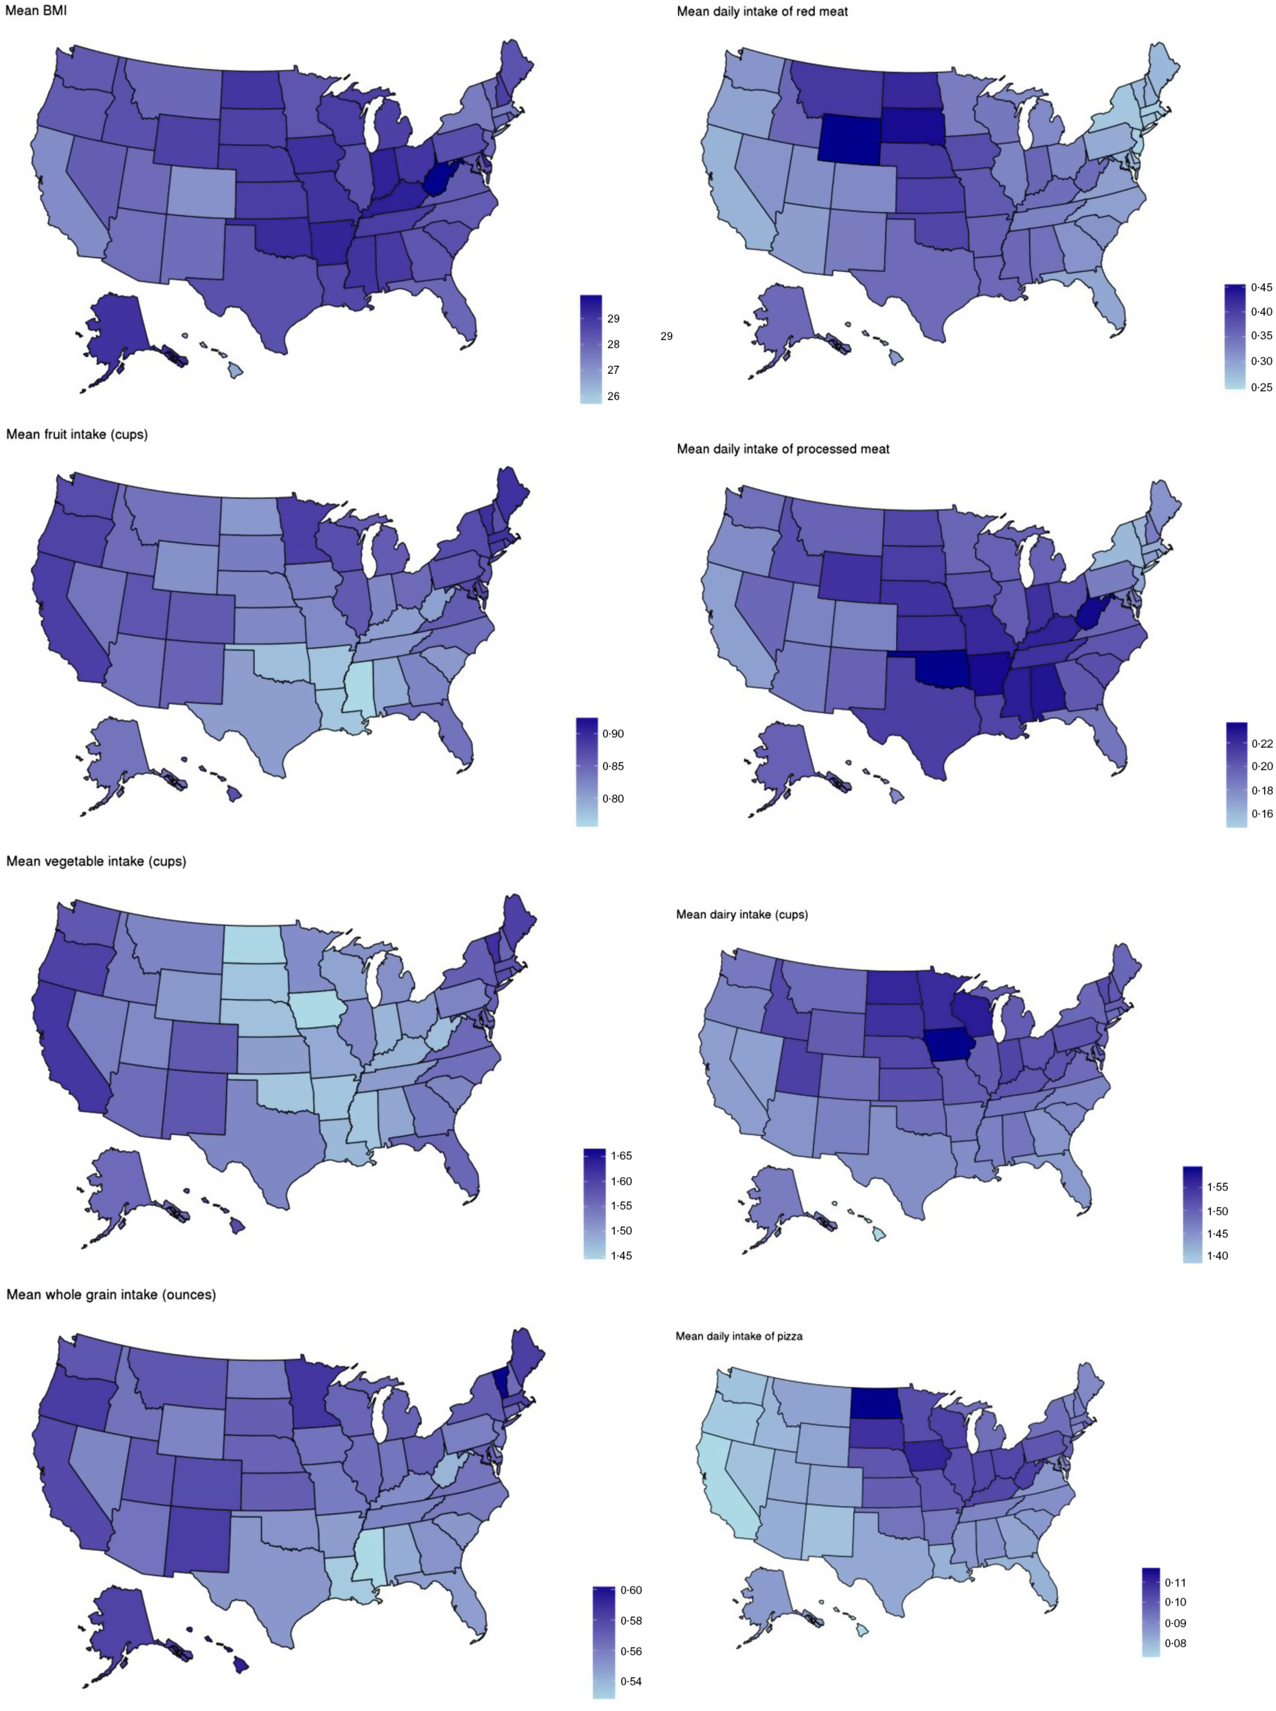
Fig. 4 Maps of average BMI and average intake of select dietary factors by state, 2017–2019
Dietary intake estimates
Only 2·6 % of the respondent population met national recommendations of fruit intake (1-½–2 cups/d for adults depending on age and sex), with an average population intake of 0·83 cups/d(20). Mean vegetable intake (excluding French fries but including other potatoes) across all respondents was 1·54 cups/d, translating to only 5·9 % of the total adult population who met guidance of 2-½–3 cups/d depending on age and sex (Tables 2 and 3). Vegetable intake showed a clear dose–response relationship with age, whereby among males and females aged 51 years and over, 6·1 % and 10·8 % met recommendations, respectively. Among 20–30-year-olds, only 1·1 % of males and 0·3 % of females met recommendations (Table 3)(21).
Table 2 Survey-weighted mean (se) intake of fruit, vegetables, whole grains, dairy, added sugars and sugar-sweetened beverages (SSB), by sample demographic characteristics

Table 3 Percent of the survey weighted 23andMe research participant population meeting federal dietary recommendations for fruits, vegetables and dairy by age and sex (2017–2019)

Table 4 Survey-weighted mean (se) intake of select vegetables, fruit, dairy, added sugars and whole grains by region (2017–2019)

In stratified estimates of average intake, college education v. no college education conferred higher intake of fruits, vegetables and whole grains, with substantially less sugar intake both in total added sugars and the percent consuming at least one sugar-sweetened beverage/d. Differences across race/ethnicity showed Oceanian populations (i.e. Americans with origins in the Pacific islands) eat substantially less whole grains compared with other groups, and nearly half of American Indian respondents reported at least one sugar-sweetened beverage/d. Dairy consumption was lower among Asians compared with other groups.
As shown in Fig. 5, consumption of many of the food items included in the NHANES dietary screener shows strong associations with BMI. In models adjusted for age, sex, education and race/ethnicity, foods associated with the greatest increase in BMI included processed and red meat, fried potatoes and pastry. Higher consumption of dairy products (cheese and ice cream) was all associated with higher BMI. Conversely, each tertile increase in the past month consumption of fruits, vegetables, whole grains, beans and cereals corresponded to lower BMI. Frequency of chocolate consumption showed no statistically significant association with BMI.
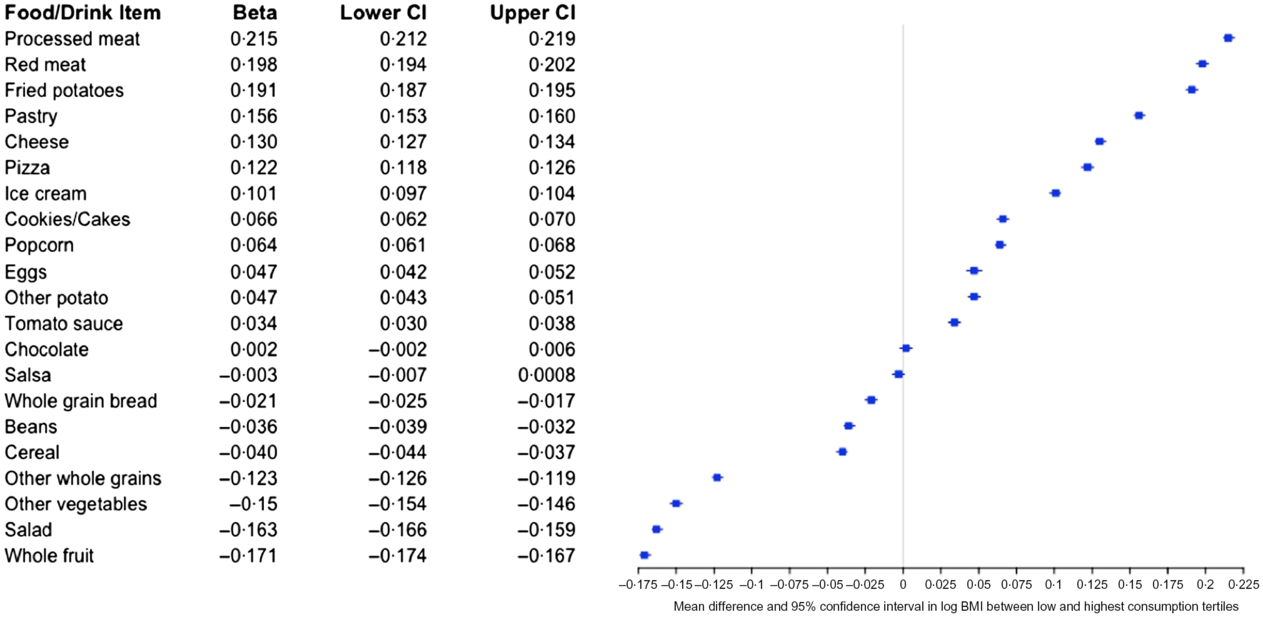
Fig. 5 Mean difference in log BMI (beta, 95 % CI) between the highest and lowest consumption tertiles. Beta estimates and 95 % CI were derived from linear models regressing intake tertile on log-transformed BMI, adjusted for race/ethnicity, education, age (centred), sex and age (centred) squared
Discussion
Here, we detail demographic, temporal and spatial characteristics of dietary factors measured by the DSQ and how they relate to BMI among 23andMe research participants. Because 23andMe research participants are twice as likely to have a college education, more likely to be female, white and older than the general US population, dietary habits differential across these characteristics were most changed by weighting the sample to better represent the broader free living US population of adults. In the weighted sample, the majority of 23andMe participants fall well below dietary guidelines for consumption of fruits and vegetables showing remarkable similarity to the broader US population. In our stratified analyses, the most pronounced difference by education, which we used as a proxy for socio-economic status, was for soda consumption, which is less common as educational attainment increases. In our cross-sectional analyses of BMI and dietary habits, these under-consumed foods corresponded to lower BMI, whereas dairy, meats and added sugars were associated with higher BMI. Descriptive spatial patterns of models of high v. low intake of select dietary factors and BMI replicate results from large-scale nationally representative studies such as the Behavioral Risk Factor Surveillance System(23,24) . Although it is generally agreed that there exists a troubling degree of bias in self-reported dietary intake data(Reference Ioannidis25), observation of these patterns which are replicated across more rigorous data collection methods(Reference Newby, Muller and Hallfrisch26) are reassuring.
Direct comparisons between weighted intake estimates among 23andMe research participants and the NHANES sample may be limited based on methodological differences in data collection. As described, 23andMe estimates are based on a brief screener, whereas the NHANES estimates are based on two in-person 24-h food intake interviews(22). Comparing the survey-weighted results to the 2011–2012 NHANES study, 23andMe respondents were most similar to the general US population for fruits (0·73 v. 0·69 median cups/d) and (1·54 v. 1·63 cups/d) vegetables but less so for added sugars (15·4 v. 18·5 tsp/d) and whole grains (0·56 v. 1·00 ounces/d). Because of the significant time gap (5–6 years) between the most recently published NHANES values and the 23andMe data, it is possible that some amount of this difference is explained by the previously reported downward trends in consumption of added sugars observed over time(Reference Rehm, Penalvo and Afshin4).
Measurement of dietary habits in the context of a self-reported web-based survey has the benefit of efficiency, but is hindered by the limited scope of data collection and its accuracy in reflecting the individuals’ general habits. Because web-based survey completion tends to decline as survey length increases(Reference Hoerger27), we chose the DSQ rather than a longer assessment such as a full food frequency questionnaire to maximise utility of the data collected with minimal respondent drop-off. However, the NHANES dietary screener (2009/2010)(9,10) does not allow for estimation of total energy intake and may be a suboptimal tool for measuring the proportion of population meeting national fruit intake guidelines.
For example, due to a truncated response option at two or more times/d, for many adults (all men and women aged 19–30 years), it is not possible to report eating enough whole fruit to meet current dietary recommendations (2 cups/d for women aged 19–30 years and men aged 19–50 years) if the portion size estimates are applied, which are <1 cup per serving. This becomes a greater problem for women, because the quantity multiplier (i.e. the estimated number of cups per serving) used to estimate cups/d is smaller for women than it is for men. Because the total fruit estimate is based on the combination of whole fruit and 100 % fruit juice, participants that report the maximum serving size frequency (two or more times/d) must also drink 100 % fruit juice regularly to meet the recommended minimum fruit intake requirements.
Because fruit juice is not universally considered a healthful dietary option due to its high added sugar and low fibre content(Reference Walker, Dumke and Goran28), those who eat fruit in quantities equal to or exceeding 2 cups/d but abstain from drinking fruit juice will be systematically misclassified by the DSQ as not meeting fruit intake recommendations. In an assessment of this screener, it was recommended to pilot test in each population prior to use, and to take caution when deriving precise estimates, but neither ceiling effects on fruit intake nor this particular problem was noted(Reference Thompson, Midthune and Kahle11). Because the 23andMe respondent population includes an over representation of college educated people who we show here consume less added sugars compared with those without a college degree, limitations inherent to this questionnaire may be more pronounced.
Generalisability of the survey-weighted 23andMe respondent sample to the US population was achievable for age, sex, education, white v. non-white and BMI. However, limits to sample weighting still require a higher representation of non-white participants to develop a generalisable weighted sample. An alternative approach would be sub-sampling the database(Reference Liu, Cella and Gershon29) to achieve a more balanced distribution across race/ethnicity, which we would recommend for analyses which aim to draw direct comparisons to the general population from the 23andMe research participant database. In addition to considerations of generalisability, other limitations to our study include the cross-sectional nature of the ascertainment for both exposure (diet) and outcome (BMI), which limits inferences of temporality and causality. Future studies may use prospectively collected data or Mendelian randomisation analyses to further understand the causal architecture of our observed associations. Finally, our results are based on a one-time dietary measurement, which may not reflect habitual dietary intake.
In addition to the very low proportion of participants who met national guidelines for intake of fruits and vegetables, plots of reported intake over time are not encouraging. While some patterns are easily explained by broader trends, for example, with milk, declines in reported consumption of fruits and vegetables over the study period are either indicative of changing characteristics of the 23andMe research population or are reflective of broader declines in consumption of these foods.
Our exploration of nutrition patterns within the 23andMe database identified several unique advantages of this large-scale, participant-driven, digital cohort. The ability to quickly and contemporaneously collect nutritional information can inform more expeditious assessment of nutrition trends compared with traditional surveys; in contrast to the 23andMe data, NHANES data are usually made available to researchers several years after collection. Additionally, our unprecedentedly large sample size enables well-powered subgroup analyses, including future nutrigenomic studies, and rigorous ascertainment of spatial and seasonal variation in dietary intake. Finally, digital ascertainment of nutritional exposures minimises participant burden, encouraging participation in future surveys(Reference Bowling30).
In conclusion, we have characterised the demographic, seasonal and spatial patterns of nutritional habits among 23andMe research participants in the USA. Additionally, we report cross-sectional positive associations between BMI and the intake of red and processed meat as well as dairy and inverse associations between BMI and the intake of fruit, vegetables and whole grains. Our dataset offers a unique opportunity for rapid, large-scale, real-time data collection, which can inform national trends in a much shorter time frame than current nationwide surveys. Efforts to diversify the 23andMe research participant database will increase the generalisability to the US population, but because of the significant number of participants, survey sampling and weighting methods can achieve this at present. While large-scale cohorts like the 23andMe participants offer exciting future opportunities in precision nutrition, general efforts to continuously work towards improvements in dietary habits remain critical for maximising health, maintaining a healthy BMI and preventing chronic diseases.
Acknowledgements
Acknowledgements: The authors would like to thank the research participants and employees of 23andMe for making this work possible. Members of the 23andMe Research Team are Michelle Agee, Adam Auton, Robert K. Bell, Katarzyna Bryc, Sarah K. Clark, Sarah L. Elson, Kipper Fletez-Brant, Pierre Fontanillas, Nicholas A. Furlotte, Pooja M. Gandhi, Karl Heilbron, Barry Hicks, David A. Hinds, Karen E. Huber, Ethan M. Jewett, Yunxuan Jiang, Aaron Kleinman, Keng-Han Lin, Nadia K. Litterman, Jennifer C. McCreight, Matthew H. McIntyre, Kimberly F. McManus, Joanna L. Mountain, Sahar V. Mozaffari, Priyanka Nandakumar, Elizabeth S. Noblin, Carrie A.M. Northover, Jared O’Connell, Steven J. Pitts, G. David Poznik, J. Fah Sathirapongsasuti, Anjali J. Shastri, Suyash Shringarpure, Chao Tian, Joyce Y. Tung, Robert J. Tunney, Vladimir Vacic and Xin Wang. Financial support: This study was conducted with no external financial support. Conflict of interest: All authors are employees of 23andMe, Inc., and hold stock or stock options in 23andMe. All authors had full access to all of the data in this study and take complete responsibility for the integrity of the data and the accuracy of the data analysis. Authorship: J.S., R.G. and S.A. formulated the research question. B.C. carried out statistical analyses. J.S. and S.A. wrote the article. Ethics of human subject participation: This study was conducted according to the guidelines laid down in the Declaration of Helsinki, and all procedures involving research study participants were approved by the Ethical & Independent Review Services, a private independent institutional review board. All 23andMe customers consent to participate in research online and consent is captured electronically. Ethical & Independent Review Services approved this form of informed consent and waived the requirement to obtain signed consent under 45 CFR 46·117(c).
Supplementary material
To view supplementary material for this article, please visit https://doi.org/10.1017/S1368980020001251


