


An unhealthy diet is one of the four major risk factors of the global leading cause of deaths known as non-communicable diseases (NCD)( 1 ). It is well recognized that diet-related NCD are increasing across the globe; however, the food supply differs across countries and varies with countries’ economy and food cultures( Reference Imamura, Micha and Khatibzadeh 2 ). Dietary patterns are influenced by the healthiness of the food environment, including health-related labelling, nutritional quality of the food products available, food marketing and prices( Reference Brug 3 , Reference Swinburn, Sacks and Vandevijvere 4 ), which are further shaped by private-sector and government policies and practices( Reference Swinburn, Sacks and Vandevijvere 4 , Reference Nestle 5 ).
To strengthen the development and implementation of countries’ nutrition policies related to obesity and NCD, the International Network for Food and Obesity/Non-communicable Diseases Research, Monitoring and Action Support (INFORMAS) developed a framework and protocols to monitor and benchmark the healthiness of national food environments and related obesity and NCD policies globally( Reference Swinburn, Sacks and Vandevijvere 4 ). The overarching INFORMAS framework contains nine key modules including public policies and actions, private-sector policies and actions, food prices, food promotion, food provision, food retail, food trade and investment, food labelling and food composition.
Consumption of ultra-processed foods (ready-to-eat or to ready-to-heat foods such as savoury snacks, soft drinks, breads, biscuits, canned foods and flavoured milk) has been increasing considerably in low- and middle- income countries during the last decades and contributes significantly to the rising trend of obesity and diet-related NCD( Reference Monterio, Moubarac and Cannon 6 , Reference Baker and Friel 7 ). Thailand, a middle-income country, has been considered as a new market being penetrated by the processed food industry. As a result, ultra-processed foods are becoming more common( 8 ), so these products should be accounted for when tackling the obesogenic environment.
In Thailand, nutrition labelling is one of a few legal tools that have been used to tackle obesity and NCD. By law, a nutrition facts panel is required on some types of food. Since 1998, a full or short nutrition facts panel (Fig. 1) must be displayed on packaged food products when the products display claims or are aimed at specific consumer groups, such as patients or toddlers, with the following information: serving size, serving per container, energy (and energy from fat), amount and percentage of Recommended Daily Intake (%RDI) of total fat, saturated fat, cholesterol, protein, carbohydrate, fibre, sugar, Na, vitamin A, thiamin, riboflavin and Fe( 9 ). From 2007 to 2015, the Guideline Daily Amount (GDA) label together with full or short nutrition facts and the statement ‘consume in small amounts and exercise for a healthy condition’ were required on five food groups, including: potato chips; popcorn or corn snacks; rice crisps; crackers or biscuits; and wafers. These five food groups were selected as pilot food groups to display a GDA label because they are commonly consumed among children and considered unhealthy( 10 , 11 ). Apart from nutrition labelling, nutrition claims on packaged foods are also regulated in Thailand. In brief, the law( 9 ) specifies criteria and requirements as follows: (i) only the nutrients mentioned in the Thai Recommended Daily Intakes (Thai RDI) are allowed; (ii) the words ‘high’ or ‘low’ or other words with equal meaning can be used only when the quantity of the claimed nutrient meets the suggested criteria; and (iii) claims can be displayed on a food product only when the total fat or saturated fat or cholesterol or Na content is not higher than the suggested criteria (13 g, 4 g, 60 mg and 360 mg per serving size, respectively). Recently, the Thai Food and Drug Administration has adopted the ‘healthier’ logo, which is a voluntary front-of-pack labelling scheme for packaged foods( 12 ). Only the food products that are classified by the Thai Nutrient Profile Model as healthier can carry the Thai ‘healthier’ logo( 13 ). The scheme was aimed to promote informed decision making by consumers when purchasing foods and to encourage the food industry to reformulate food products.

Fig. 1 (a) Full and (b) short nutrition facts in Thailand
There are no voluntary or mandatory food composition policies that have been developed or implemented in Thailand to date. Assessing the nutritional quality of the food supply is important to inform government policy to create healthy food environments. Food composition and labelling policies have the potential to encourage healthier food consumption among consumers and food reformulation by the food industry( 14 , Reference Ducrot, Méjean and Julia 15 ). Also, it is crucial that the nutrition information on the labels is not misleading and is communicated clearly to consumers( 16 ). Therefore, the aim of the present study was to examine, for the first time, the nutritional quality of ready-to-eat packaged foods available and the nutrition information on the packages of such food products in Thailand using the INFORMAS food composition and food labelling protocols.
Methods
Sampling and data collection
In March 2015, data collection took place in Bangkok and Nonthaburi provinces at the biggest store of each of twelve major retail chains, which included three hypermarkets (Big C, Tesco Lotus and Makro), four supermarkets (Tops, Max Value, Gourmet Market and Home Fresh Mart) and five convenience stores (7–11, 108 shops, Lawson, Family Mart and Jiffy).
Eleven categories of packaged food products were included in the study. The inclusion criteria were that the products be ready-to-eat and widely consumed across Thailand according to Thailand’s Food Consumption Survey( 17 ). Based on these criteria, canned meat/fish and fresh foods were excluded because they tend to be cooked before consumption and bread was excluded because it is not widely consumed in Thailand.
Food composition and labelling data were collected according to the INFORMAS protocols( Reference Neal, Sacks and Swinburn 18 , Reference Rayner, Wood and Lawrence 19 ). All sides of the food packages were included, and the following data were collected: brand and product name; size; presence or absence of a list of ingredients; type of nutrition label; nutrient components; supplementary nutrition information; presence or absence of a GDA label; claims; company name; and country of origin. The protocol recommended taking pictures of the whole package of each food product to collect nutrient composition and nutrition information. However, taking pictures was not allowed in the outlets in Thailand. Therefore, we purchased all selected products and developed a mobile phone application together with a database to prevent duplicate purchasing, since, from observation, the twelve outlets sold similar products. Barcodes of the food products purchased were scanned and new products were purchased for data entry only if the information of the scanned products did not match any product already in the database. After collecting all the information needed, the food products were donated.
Nutritional quality and food classification
The nutrient profile model which supports the ‘healthier’ logo approval in Thailand( 13 ) was used to classify food products as healthier (entitled to carry the ‘healthier’ logo) or less healthy (not entitled to carry the ‘healthier’ logo). This nutrient profiling system is currently and legally used as a tool to indicate the eligibility of packaged food products to carry the Thai ‘healthier’ logo( 12 ). The food products included in the present study were categorized into five broad categories according to the Thai Nutrient Profile Model as follows: (i) sugary beverages; (ii) milk products and yoghurts; (iii) snacks (e.g. biscuits, crackers, wafers, chocolate, crispy snacks, cookies, cakes, candies and nuts); (iv) composite foods; and (v) instant noodles and porridges. To define products as healthier or less healthy, different nutrient criteria for each food category were applied.
Sugary beverages were classified as healthier if their sugar content was less than 6 g/100 ml or 18 g/300 ml drink or larger size. Milk products with no added sugar were classified as healthier if their total fat content was less than 4 g/100 ml or 12 g/300 ml milk or larger size. Sugary milk products were classified as healthier if their sugar content was less than 8 g/100 ml milk or 24 g/300 ml milk or larger size and their total fat content was less than 3·5 g/100 ml milk or 10·5 g/300 ml milk or larger size.
Yoghurts and drinking yoghurts were classified as healthier if their sugar content was less than 5 % or 11·25 g/225 g yoghurt or larger size. Snacks, except nuts and beans, were classified as healthier if they contained less than 628 kJ (150 kcal)/serving size, less than 6 % of saturated fat, less than 7 % of sugar and less than 500 mg Na/100 g. Nuts and beans were classified as healthier if they contained less than 0·3 % of added sugar or added fat or oil, less than 100 mg Na/serving size and less than 837 kJ (200 kcal)/serving size. To classify a composite food as healthier or less healthy, each nutrient (including protein, Ca, Fe, fibre, total fat, saturated fat, total sugar and Na) was assigned a score (from 0 to 5) according to the nutrient content in the food per 418 kJ (100 kcal). Then, the scores of all the nutrients were summed. The food was defined as less healthy when the total score was less than 20. In addition, the composite food was classified as less healthy if the food provided less than 1046 kJ (250 kcal)/serving size or more than 209 kJ (500 kcal)/serving size or if the food scored 0 for sugar or Na or saturated fat. Instant noodles and porridges were classified as healthier if they contained less than 1000 mg Na/50 g food or 1400 mg Na/70 g food.
The products with no nutrition label or missing some information needed for classification were excluded from the analysis of nutritional quality.
Claim coding
The INFORMAS taxonomy( Reference Rayner, Wood and Lawrence 19 ) was used to classify claims on food packages as either nutrition claims or health claims. Both the claim format (whether the claim is numerical, symbolic or verbal format) and the claim content (whether the claim is a nutrition or health claim) were coded. The definitions of each type of claim are summarized as follows:
1. Nutrition claims are claims that (i) state a product has a certain ingredient that has nutritional properties (e.g. ‘contains probiotics, soya and wholegrain’) or (ii) indicate the level of nutrients contained in a product (e.g. ‘low fat/sodium/sugar’, ‘no sugar added’, ‘source of vitamin B12’, ‘high calcium’, ‘a good source of fibre’) or (iii) compare a nutrient level of other products to its own (e.g. ‘less fat than the original recipe’ and ‘reduced fat’).
2. Health claims are claims that (i) concern the benefit of a product on health, but do not refer to a nutrient (e.g. ‘healthy’, ‘good for bones’ and ‘helps the digestive system’) or (ii) refer to a nutrient in the product that benefits health (e.g. ‘source of calcium to help build stronger teeth and bones’ and ‘vitamin D to help the body absorb calcium’) or (iii) reduce risk of a disease.
Claims were coded by two researchers independently in certain food types for 56 % of total products included in the study. Afterwards, both researchers discussed discrepancies in the coding to reach 100 % agreement. Thereafter, one researcher continued coding for the remainder of the food groups because the remaining claims were similar to the majority of claims categorized by both researchers.
Statistical analysis
Nutritional quality of food products was calculated as median, minimum and maximum values. Healthiness of food products was presented in number and percentage of food products. Types of nutrition information displayed on food packages were reported in number and percentage as well. The χ 2 test was used to compare displayed nutrition information between healthier and less healthy products. An inter-rater reliability analysis using Cohen’s kappa statistic was performed to determine consistency between the two raters in coding claims. A P value of <0·05 was considered statistically significant. Data analysis was performed using the statistical software package Stata version 11.0 for Windows.
Results
Nutrition information on ready-to-eat packaged foods in Thailand
In total, the packages of 7205 ready-to-eat food products were analysed. For the claim coding, the inter-rater reliability between the two researchers was 0·84 (95 % CI 0·82, 0·86; P<0·001).
Table 1 describes the different types of nutrition information displayed on the five types of food products. An ingredients list was found most frequently (n 7188; 99·8 %), followed by a nutrition facts panel (n 5707; 79·2 %), a GDA label (n 2536; 35·2 %), nutrition claims (n 1487; 21·0 %) and health claims (n 291; 4·0 %). Out of the 5707 products carrying nutrition facts, only 4691 products (65·1 %) followed the Thai Food and Drug Administration’s guidelines. Among the food products carrying a compliant nutrition facts panel, the milk product and yoghurt group had the greatest proportion of food products carrying nutrition facts in accordance with the regulations (80·7 %), followed by snacks (73·6 %) and sugary beverages (51·7 %). The snack group had the greatest proportion of products displaying a compliant GDA label (56·6 %), followed by instant noodles and porridges (11·6 %).
Table 1 Provision of ingredients lists, nutrition information labels and claims on the packages of different types of Thai ready-to-eat packaged foods, March 2015
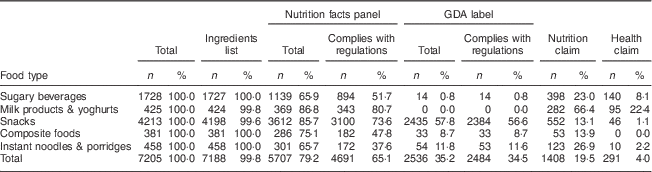
GDA, Guideline Daily Amount.
The proportion of domestic food products carrying nutrition facts was 21·1 %, which was not significantly different from the proportion of imported food products (20·2 %). However, the proportion of non-compliant nutrition facts displayed on imported products was ten times higher than the proportion found on domestic food products (30·4 v. 3·4 %). The proportion of food products with a GDA label was greater for imported food products (43·1 %) compared with domestic products (30·3 %). Nevertheless, the compliance of GDA labels of domestic products (99·1 %) with the regulation was slightly higher compared with that of imported products (96·7 %; data not shown).
There were 1807 (25·1 %) products carrying at least one health-related claim. Considering each claim category, 1408 products (20·6 %) and 291 products (4·0 %) carried nutrition claims and health claims, respectively. The milk product and yoghurt group had the greatest proportion of products displaying nutrition claims (66·4 %), followed by the instant noodle and porridge group and the sugary beverage group (26·9 and 23·0 %, respectively). Health claims were found most frequently on milk products and yoghurts (22·4 %) and sugary beverages (8·1 %).
Nutritional composition of the sampled products
Table 2 presents the energy, total fat, saturated fat, total sugar and Na contents per 100 g of various types of food, as per the nutrition labels. After excluding missing or invalid data, information on energy and saturated fat content was most available (4739 products or 65·8 %), while information on total sugar content was the least available (4713 products or 65·4 %) on ready-to-eat food products.
Table 2 Energy, total fat, saturated fat, total sugar and sodium contents displayed on the nutrition facts panels of ready-to-eat packaged food products by food category in Thailand, March 2015

* Nutrient amounts are calculated from 100 g of undiluted food products (data of diluted food products were not available); 15 % of other beverage products are either concentrated or diluted one-in-three.
† To convert to kJ/100 g, multiply kcal/100 g values by 4·184.
Wide ranges for the content of each nutrient in food products were observed. The contents of energy, total fat, saturated fat, sugar and Na were in the range of 0·0–3456 kJ (0·0–826·1 kcal), 0·0–85·7 g, 0·0–46·7 g, 0·0–90·0 g and 0·0–10250·0 mg per 100 g, respectively. The mean energy, total fat, saturated fat, sugar and Na contents were 712 (sd 673) kJ (170·1 (sd 160·8) kcal), 7·1 (sd 9·5) g, 1·6 (sd 3·8) g, 8·9 (sd 11·9) g and 262·3 (sd 627·5) mg per 100 g, respectively. Instant noodles and porridges had the highest mean energy content (1433 (sd 397) kJ/100 g (342·6 (sd 94·9) kcal/100 g)), while snacks had the second highest mean energy content (892 (sd 702) kJ/100 g (213·1 (sd 167·7) kcal/100 g). Snacks had the highest mean total fat content (10·0 (sd 10·3) g/100 g), followed by instant noodles and porridges (5·9 (sd 6·7) g/100 g) and composite foods (5·3 (sd 5·2) g/100 g).
Snacks had the highest mean saturated fat content (2·2 (sd 4·4) g/100g), followed by instant noodles and porridges (2·1 (sd 3·1) g/100 g). The highest mean total sugar content was found in snacks (10·2 (sd 13·7) g/100 g) and the second highest mean total sugar content was observed in instant noodles and porridges (7·9 (sd 10·4) g/100 g). The highest mean Na content was found in instant noodles and porridges (2597·3 (sd 1455·8) mg/100 g), followed by the composite food group containing mean Na content of 299·3 (sd 207·7) mg/100 g.
Nutritional quality of Thai ready-to eat food products
Table 3 presents the nutritional quality of different types of food products. Out of 7205 products, 4689 products (65·1 %) had sufficient information on the label to be classified according to the Thai Nutrient Profile Model( 13 ). Among 4689 products, 4257 products (90·8 %) were classified as less healthy. The majority of snacks (98·4 %) and composite foods (91·1 %) were less healthy. Milk products and yoghurts had the lowest proportion of less healthy products (50·2 %). Nutritional quality was significantly different between all food groups at P<0·05.
Table 3 Nutritional quality of Thai ready-to-eat packaged foods (n 4689) as classified by the Thai Nutrient Profile Model( 13 ), March 2015

* The χ 2 test was used to compare between healthier and less healthy categories.
Out of the 4429 domestic products (produced in Thailand), only 3321 products (75·0 %) provided adequate data for the nutritional quality assessment. Among the classifiable domestic products, 2900 products (87·3 %) were classified as less healthy and 421 products (12·7 %) were classified as healthier. Approximately 49·3 % of imported food products (1368 out of 2776 products) could be classified by the Thai Nutrient Profile Model and 1357 products (99·2 %) of classifiable imported food products were less healthy (data not shown). There was a statistically significant association between nutritional quality and origin of the food products at P<0·05.
Nutrition information of ready-to-eat packaged foods by nutritional quality
Table 4 compares the presence of an ingredients list, a nutrition label and claims between healthier and less healthy food products. Nutrition facts provision by nutritional quality of food products was not presented because only the food products with nutrition facts could be classified according to the Thai Nutrient Profile Model. The proportions of healthier and less healthy food products carrying an ingredients list were similar (99·8 %). The less healthy food products had a greater proportion of products carrying a GDA label, while having a lower proportion of products carrying claims when compared with the healthier products (P<0·05). In total 2451 out of 4257 less healthy products (57·6 %) displayed the GDA label, which was significantly higher than healthier products carrying a GDA label (33/432 or 7·6 %). In contrast, the proportion of healthier food products displaying claims was greater than for less healthy products (68·1 v. 28·6 %). The majority of food products carrying health-related claims were less healthy products (1219 out of 1487 products or 82·0 %; data not shown).
Table 4 Provision of ingredients lists, Guideline Daily Amount (GDA) labels and claims on the packages of healthier and less healthy Thai ready-to-eat packaged food products (n 4689), March 2015

* The χ 2 test was used to compare between healthy and less healthy categories.
† Refers to GDA label in compliance with related regulations.
‡ One product can carry more than one type of claim, so summation of the percentage of nutrition, health and other claims can exceed 100 %.
Discussion
The findings provide insight into the extent of nutrition information provided on product packages according to nutritional quality. In addition, the present study illustrates nutritional quality of the food products in Thailand, showing both quantity of each nutrient and overall nutritional quality of the food products. To the best of our knowledge, the present study is the first that provides insights into the availability, variety, nutritional quality and healthiness of ready-to-eat packaged food products available in Thailand.
It is important to provide nutrition information to enhance decision making by consumers, to encourage healthy food consumption and to protect consumers’ rights. However, the provision of nutrition facts and GDA labels in Thailand was relatively insufficient (only 79·2 and 35·2 %, respectively). The provision of nutrition facts on food products reported in the current study is lower than the figures from Ireland and the UK (>90·0 %)( Reference Storcksdieck genannt Bonsmann, Fernández Celenín and Larraňaga 20 ), but higher than the provision of nutrition declaration (energy, protein, carbohydrate, fat and Na) in a city in China (26·0 %)( Reference Lv, Chen and Wang 21 ).
Considering the GDA or some other form of front-of-pack label, the proportion of food products carrying a GDA label in the present study was lower than the proportion reported in Ireland, the UK, Finland and Germany( Reference Storcksdieck genannt Bonsmann, Fernández Celenín and Larraňaga 20 ). In addition to the inadequate provision of nutrition labels, a significant proportion of nutrition facts labels (14·1 %) do not comply with the Thai law. Despite four-fifths of the packaged food products providing nutrition facts, only two-thirds of them provided compliant nutrition facts. The coverage and compliance of the nutrition labels varied with their origin; imported food products tended to have inferior performance compared with domestic products. Important gaps of nutrition label regulations in Thailand, in terms of the coverage and law enforcement, were highlighted.
Nutrition and health claims are a form of nutrition information that influences consumers’ food choices( Reference Kaur, Scarborough and Rayner 22 ). In addition, claims have also been considered as a form of marketing( Reference Hawkes 23 ) that could increase consumption; therefore, claims (especially health claims) have been regulated to some extent in some countries, such as Australia and New Zealand( Reference Hawkes 23 ). The prevalence of claims identified by the present study was lower than the prevalence of claims reported from surveys of pre-packaged foods in many European countries( Reference Storcksdieck genannt Bonsmann, Fernández Celenín and Larraňaga 20 , Reference Hieke, Kuljanic and Pravst 24 ), a survey of pre-packaged and some fresh foods in New Zealand( Reference Al-Ani, Devi and Eyles 25 ), and a survey of beverages and cereal products in Australia( Reference Hughes, Wellard and Lin 26 ).
Some food products are major sources of potentially harmful nutrients. For example, snacks are high in sugar and instant noodles and porridges are the major source of Na. The mean Na content per 100 g in these convenience foods (2597·3 (sd 1455·8) mg) exceeds the Thai RDI of Na (2400 mg/d). The findings are in accordance with studies conducted in other continents and contexts, which stated that manufactured ready-to-eat food products, so-called ultra-processed foods, have poor nutritional quality and could lead to poor diets, obesity and metabolic syndrome( Reference Luiten, Steenhuis and Eyles 27 – Reference Tavares, Fonseca and Garcia Rosa 32 ).
However, the availability of nutrition composition data is limited since not all packaged foods were required by the Thai law to declare nutrition facts. From available data, the results of overall nutritional quality suggest that almost all ready-to-eat packaged food products available in Thailand are less healthy, especially snacks and composite foods. The provision of nutrition facts on imported food products was considerably less, while the proportion of less healthy was greater compared with domestic products. This is another critical point to address.
The proportion of less healthy foods in Thailand observed in the current study is much higher than the figure reported by a similar survey conducted in New Zealand( Reference Al-Ani, Devi and Eyles 25 ) when considering comparable categories such as beverages, convenience foods, snacks and dairy products. It cannot be concluded that the comparative food groups available in Thailand in 2015 had poorer nutrient values than those available in New Zealand in 2014. This is because the latter study used the Nutrient Profiling Scoring Criterion (NPSC) developed by Food Standards Australia New Zealand as the NPSC is used in New Zealand for claims regulation( 33 ), while the present study used the Thai Nutrient Profile Model since it is used for issuing healthier logo labels in Thailand( 12 ). The comparison indicated that, considering the four food groups classified by country-specific nutrient profile models, the healthier choices in Thailand were relatively less available compared with the healthier choices in New Zealand. To be able to compare the nutritional value of food products between countries, a standard nutrient profile for comparison across countries should be developed and adopted.
High availability of ultra-processed foods may lead to lower diet quality( Reference Luiten, Steenhuis and Eyles 27 , Reference Monteiro, Levy and Claro 29 ). As the nutritional quality of nearly all ready-to-eat packaged foods collected in the current study is poor, it is crucial to provide nutrition information to consumers to enable informed decision making. However, in Thailand, nutrition information was not provided as extensively and responsively as it should be. Despite poor nutritional quality, only two-thirds of packaged foods carried a nutrition facts panel and one-third of them displayed a GDA label correctly. In addition, almost half of the less healthy products did not carry a GDA label. The findings strongly confirm that the contents and enforcement of Thai nutrition labelling policy should be improved.
Even though the proportion of less healthy products displaying claims found herein is less than the proportion reported by the study from New Zealand mentioned above( Reference Al-Ani, Devi and Eyles 25 ), a significant proportion of less healthy products had claims on their packages. A higher proportion of healthier products carrying claims compared with less healthy products was observed (68·1 v 28·6 %), which is similar to findings from studies conducted in five European countries( Reference Kaur, Scarborough and Hieke 34 ) and also in New Zealand( Reference Al-Ani, Devi and Eyles 25 ). However, the majority of food products carrying health-related claims were less healthy even though health-related claims should not be found on less healthy food products due to the fact that claims could mislead consumers( Reference Wansink and Chandon 35 , Reference Kozup, Creyer and Burton 36 ). The findings suggest that although there is a regulation to protect Thai consumers from potentially harmful claims( 10 ), there is still room for improvement.
The findings indicated that interventions to promote a healthy food environment should be implemented in Thailand, which may include encouraging healthy products on the checkout aisles( Reference Glanz, Bader and Iyer 37 ), promoting reformulation of the products( 14 ), requiring packaged food products to display compulsory understandable nutrition labels( Reference Roberto and Khandpur 38 ), and allowing only healthy foods to carry claims to avoid overconsumption of unhealthy foods.
Even though the present study is the first that collected information from the majority of the ready-to-eat packaged foods available in Thailand, several limitations can be identified. First, the study is based on data available from product labels and the validity of nutrient composition of the food products was not verified. However, to control the quality of the results, we excluded extreme outliers compared with other foods in the same categories and showed no disagreement between nutrition components in the same product. For example, the summation of energy separately calculated from fat, protein and carbohydrate must not exceed total energy. In addition, sugar must not exceed carbohydrate’s quantity. Second, our cross-sectional survey did not cover local corner stores where locally made packaged foods might be sold. However, the modern trade outlets are major sources of ready-to-eat packaged foods among Thai adults( Reference Kelly, Seubsman and Banwell 39 ) and the selected retail chains are dominant across the country with attractive marketing strategies( 40 ), which should cover most of the manufactured ready-to-eat packaged foods.
Conclusion
In conclusion, the provision of nutrition information, meant initially to protect consumers, did not cover all ready-to-eat food products in Thailand. Moreover, a high proportion of less healthy products was allowed to carry health-related claims, which could promote consumption of those products. In addition, the availability of healthier ready-to-eat packaged foods in Thailand was very low; in other words, it is almost impossible to find healthy choices when purchasing ready-to-eat packaged food products. The findings identify the need to improve the availability of healthier ready-to-eat products and the provision of nutrition information. Moreover, gaining comparable data on food composition and nutritional quality between countries could enable benchmarking and could stimulate further improvement of food environments. To facilitate such comparisons and further actions, a standard nutrient profiling model should be promoted and adopted internationally.
Acknowledgements
Acknowledgements: The authors would like to express their sincere gratitude to the Bureau of Food, Food and Drug Administration, Ministry of Public Health of Thailand as well as the International Health Policy Program Foundation for facilitating this research project. Financial support: This study was funded by the Thai Health Promotion Foundation (ThaiHealth) (grant number 57-00-1091). S.V. is supported by a research fellowship from the National Heart Foundation in New Zealand. The funders had no role on the design, analysis or writing of this article. Conflict of interest: S.V. is a Deputy Editor for Public Health Nutrition. Authorship: S.P. was responsible for study design, data analysis, writing and revision of the manuscript. P.C. was also responsible for data analysis and revision of the manuscript. P.T. contributed to data collection and manuscript revision. S.V. contributed to study design and manuscript revision. All authors have read and approved the final version of this manuscript. Ethics of human subject participation: This study was approved by the Institute for the Development of Human Research Protections (IHRP).


