


Consumption of an adequate quantity and variety of fruit and vegetables (F&V) is strongly linked to the achievement of good health, whereas inadequate consumption is associated with chronic disease(1–Reference Savige3). Australia's national dietary guidelines specifically support the consumption of a variety of F&V with the recognition that inadequate F&V consumption is responsible for 2·1 % of Australia's total disease burden, representing significant avoidable health-care costs(4).
Dietary behaviour is complex and although social, environmental, economic and individual factors have been identified as key determinants(Reference Vita, Moxon and Macoun5), it remains poorly understood. People of low socio-economic position (SEP) are least likely to comply with dietary guideline recommendations when purchasing and consuming food(1, Reference Turrell6–Reference Giskes, Turrell and Patterson9) and, consequently, experience a disproportionate burden of nutrition-related ill-health(Reference Philip, Nelson and Ralph10). While it has been proposed that differences in food price, availability, accessibility and affordability may play a role in the observed dietary inequalities(Reference Ball, Timperio and Crawford11), studies examining the underlying cause(s) in Australia have produced inconclusive results(Reference Turrell6, Reference Ball, Timperio and Crawford11–Reference Coveney and O'Dwyer13). Cost-effective strategies that reduce dietary inequalities are urgently required(Reference Inglis, Ball and Crawford14).
Farmers’ markets (FM) are predominantly fresh food markets that operate regularly within a community where farmers (and often retailers) sell produce and associated products directly to consumers. The number of FM in Australia has increased rapidly in recent years and while up-to-date annual revenue figures are not available, in 2004, based on figures from seventeen Australian FM, it was estimated that annual revenues of all FM were approximately $AUD 40 million(Reference Coster and Kennon15). Despite more recent national estimates not being available, a Victorian survey of FM in 2010 estimated that annual revenue from Victorian FM alone was approximately $AUD 113 million(16), demonstrating the significant growth that has occurred in FM in recent years. In comparison, total consumer expenditure on food and in Australia in 2003–04 was $AUD 89 billion(17). FM aim to provide customers with regular supplies of fresh food, access to improved nutrition and contribute to the economic, social and health capital of the host community(18). It has been proposed that FM could also contribute to a reduction in obesity and food security by playing a role in educating consumers on food and nutrition, improving cooking skills, and contributing to the development of coherent communities via provision of positive social connections(19–Reference Fisher21). Non-causal mechanisms such as education, income and food-related values must also be considered as mediating the relationship between FM patronage and the opportunity for better health outcomes. A small Australian study has indicated that FM may play a role in increasing the consumption of F&V for regular attendees(Reference Payet, Gilles and Howat20).
FM may therefore offer potential as a public heath nutrition strategy, particularly for improving the dietary intakes of lower socio-economic groups. However, it has been proposed that as FM have become fashionable, they have started selling boutique, expensive food products, becoming a place for the ‘food elite’ to do their grocery shopping and potentially excluding certain social groups(Reference Holloway and Kneafsey22).
There has been some research, both in Australia and internationally, suggesting that customers perceive FM produce to be of higher quality(Reference Coster and Kennon15, Reference Payet, Gilles and Howat20, Reference Smithers, Lamarche and Joseph23, Reference Feagan, Morris and Krug24). It has also been claimed that FM may offer a price advantage over other retail streams(19). However, there has been little research that confirms the existence of such benefits and whether any associated advantage varies by area-level SEP. The objective of the present pilot study was to address this gap by collecting preliminary data on whether or not either area-level SEP or the form of retail stream (FM, supermarket or independent F&V retailer) is associated with differences in the price, availability, variety and quality of a range of fresh, seasonal F&V.
Methods
The study was a multi-site, cross-sectional pilot study of five FM, five supermarkets and five independent F&V retailers operating in five south-east Queensland suburbs conducted in August and September 2009. Ethics approval was obtained from the Queensland University of Technology Human Research Ethics Committee.
Sample design
A list of FM located in south-east Queensland was compiled based on an Internet search, of which seventeen met the preliminary inclusion criteria of being predominantly a fresh produce market (≥80 % food products); running weekly or fortnightly; and operating for longer than 6 months.
The final selection of five FM was based on the need to represent a range of SEP areas, market manager consent and logistical requirements. The Index of Relative Socio-economic Disadvantage (IRSD) was used as a proxy for classifying each suburb's SEP. The IRSD is one of the Australian Bureau of Statistic's Socio-Economic Indexes for Areas (SEIFA), which is a suite of four indices that rank the socio-economic characteristics of Australian geographic areas(25). The IRSD measures relative disadvantage, incorporating seventeen measures of the economic and social resources of people and households within a geographical area(26). A high score is interpreted as a relative lack of disadvantage(26).
Data collection and survey instruments
For each FM, two conventional retail outlets (one large supermarket and one independent F&V retailer) within 5 km by road of the FM were identified via an Internet search. The closest conventional retailers that provided consent were included. One FM, supermarket and F&V retailer in each of the five geographical areas (making a total of fifteen retail outlets) were surveyed on the price, availability, variety and quality of fifteen fruit and eighteen vegetable items. Table 1 reports the location and SEP classification for each of the five areas studied. Of note, the FM located in ISRD decile 8 (high SEP) was an organic FM, while all others dealt largely in non-organic produce with minor amounts of organic produce available also. As a pilot study, sample size was small with low statistical power. Statistical significance was set at P = 0·05.
Table 1 Geographical location and SEP classification of the areas studied, south-east Queensland, August–September 2009
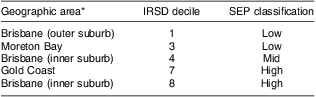
SEP, socio-economic position; ISRD, Index of Relative Socio-economic Disadvantage.
*In each geographic area, one farmers’ market, one supermarket and one independent fruit and vegetable retailer were surveyed.
The produce items included in the survey were based on those included in the Queensland Government's Healthy Food Basket Survey(27) and seasonality considerations (Table 2). Price, availability, variety and quality were scored for a fruit basket (fifteen items), a vegetable basket (eighteen items) and a combined F&V basket (thirty-three items). While prior consent was obtained from store management, retailers were not aware of the date that the audit was to be conducted, minimizing the chance that produce offerings and prices could be manipulated.
Table 2 Fruit and vegetables included in the surveyFootnote *
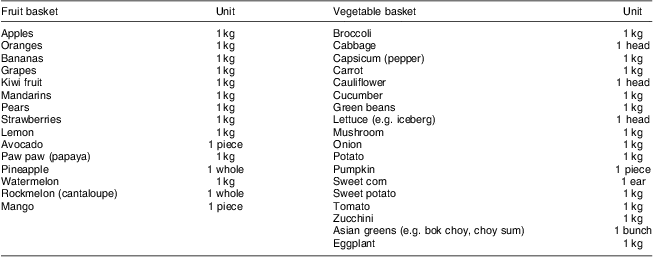
* The combined fruit and vegetable basket included the items in both the fruit basket and the vegetable basket.
The two predictor variables employed in the present study were area-level SEP and store type. Criterion variables included price, availability, variety and quality scores for the fruit, the vegetable and the combined F&V baskets. Area deprivation characteristics (as ascertained by the IRSD) were used to classify the selected geographic areas as either low (areas located in decile 1 and decile 3), mid (area located in decile 4) or high (areas located in decile 7 and decile 8) SEP areas (Table 1). The major factor informing this reclassification was adequate representation of various points on the socio-economic spectrum.
Availability of the fifteen fruit items and the eighteen vegetable items was reported as ‘available’ (score 1) or ‘not available’ (score 0), a reporting method used in similar earlier surveys(Reference Winkler, Turrell and Patterson12, 27). From this, an availability score was calculated, with a higher score representing a greater availability. When an item was not available in-store, it was not possible to determine a score for price, variety or quality. Price was recorded by noting the cheapest dollar price and pricing unit for an available produce type. At certain retail outlets, the prices of some items were only available on a per unit basis and as weighing the produce was not feasible, an average fruit or vegetable weight was obtained from the NUTTAB 2006 database using the software FoodWorks Professional 2007 (Xyris Software, Brisbane, Australia). This method was used to determine a per kilogram price, facilitating appropriate statistical comparisons. Pumpkin was excluded from the final price analyses as the recorded price data did not clearly distinguish between varieties with significantly different sizes, hindering meaningful price comparisons. Variety was scored by counting the number of different varieties that were available for each of the different types of F&V in each of the baskets. For example, if six different apple varieties were available at a store the allocated score was 6. ‘Variety’ in this survey referred only to the different cultivar of F&V, rather than the same variety packaged differently. Quality was scored as 1 = ‘poor quality’, 2 = ‘satisfactory quality’ and 3 = ‘good quality’, where a higher score represented a greater degree of quality, based on the visual appearance of the item. Taste was not included in the determination of quality. While this classification of quality was based on those used in the Healthy Food Access Basket Survey Guidelines(27), the present survey differed as it used three, rather than two, quality categories. This provided an additional level of quality information, distinguishing between acceptable (‘satisfactory’) produce and exceptional (‘good’) produce. For example, a poor quality score would be given when there was a significant amount of mould or damage evident; a satisfactory classification may include a majority of individual pieces that are damage free but include several items that are damaged, bruised or mouldy; and good quality classification was assigned when all the items in the section appeared fresh, free of damage and mould. Data collection was completed for all items by one researcher to facilitate consistency of measurement.
Statistical analyses
Audit data were analysed using the Predictive Analytics SoftWare (PASW) statistical software package version 18·0 (2009; SPSS Inc., New York, NY, USA). To preserve the size of the data set, where an item was missing, the mean price for the variable was imputed. Fifteen fruits and seventeen vegetables were included in the final analyses for price, while fifteen fruits and eighteen vegetables were included for availability, variety and quality analyses. Basket scores were normally distributed except for the price of the fruit basket, the price of the F&V basket and the three availability basket scores. The price scores for the fruit and the F&V baskets were amenable to log transformations, whereas the availability scores were not. Where log transformations were conducted, geometric mean and the anti-logged log scale confidence interval are reported(Reference Altman, Gore and Gardner28). For parametric data, one-way ANOVA was employed to explore relationships between SEP or store type and basket scores. For non-parametric data, the Kruskal–Wallis statistical test was used to explore the relationships between SEP or store type and basket scores, with post hoc testing employing the Mann–Whitney U test. A comparison was made between basket prices at the single organic FM and the non-organic FM. Correlation testing was used to assess interrelationships between criterion variables.
Results
The average availability, price, variety and quality scores for the fruit basket, vegetable basket and F&V basket across different levels of socio-economic disadvantage are shown in Table 3. Availability, price, variety and quality scores were not significantly different across levels of SEP. However, prices in low-SEP areas tended to be cheapest and increased with higher levels of SEP, while quality and variety scores were lowest in the more socio-economically disadvantaged areas and increased as relative advantage increased.
Table 3 Availability, price, variety and quality basket scores by area-level SEP, south-east Queensland, August–September 2009

SEP, socio-economic position; F&V, fruit and vegetable.
*Kruskal–Wallis test.
†ANOVA.
‡Natural log transformation performed; anti-log of the log scale mean (geometric mean) and 95 % CI are presented.
Table 4 presents the average scores for availability, price, variety and quality for the fruit basket, vegetable basket and F&V basket across the three types of retail outlets. The median availability scores for the fruit basket (P = 0·011) and the F&V basket (P = 0·027) were significantly different across store types. Post hoc analysis evaluating pairwise differences among the groups, controlling for Type 1 error across tests using the Bonferroni approach, revealed that availability score was significantly higher in supermarkets than FM.
Table 4 Availability, price, variety and quality basket scores by retail outlet, south-east Queensland, August–September 2009

F&V, fruit and vegetable.
*Kruskal–Wallis test.
†ANOVA.
‡Significant differences within a row (P < 0·05) between pairs of medians according to the Mann–Whitney U test.
§Natural log transformation performed; anti-log of the log scale mean (geometric mean) and 95 % CI are presented.
Price, variety and quality scores were not significantly different across store types. Exploration of the observed trends indicated that customers tended to pay the most for all three baskets when they shopped at FM and the least when they shopped at independent F&V retailers. Average variety scores trended highest at supermarkets, followed by independent F&V retailers and then FM. Customers interested in quality were potentially better off shopping for the vegetable basket at FM but the quality of the fruit basket was assessed as highest at supermarkets. Quality scores for all three baskets were poorest at independent F&V retailers.
A comparison was made between the prices of the baskets at the single organic FM compared with the four (predominantly) non-organic FM (data not shown). Basket prices were higher at the organic FM than at the non-organic FM. The fruit basket was $AUD 27·63 more expensive than the next most expensive FM ($AUD 45·30 organic FM v. $AUD 17·67 highest price non-organic FM), the vegetable basket was $AUD 18·21 more expensive ($AUD 69·62 v. $AUD 51·41) and the F&V basket was $AUD 48·51 more expensive ($AUD 114·92 v. $AUD 66·41).
Spearman's rank-order correlation assessed the interrelationships between the scores of availability, price, variety and quality for all three basket types (data not shown). Price and quality scores were significantly correlated for all three baskets (fruit: rs(13) = 0·589, P = 0·021; vegetable: rs(13) = 0·532, P = 0·041; F&V: rs(13) = 0·640, P = 0·010). Quality and availability were positively correlated for the fruit basket (rs(13) = 0·518, P = 0·048) and the vegetable basket (rs(13) = 0·542, P = 0·037). For the F&V basket there was a significant correlation between availability and variety scores (rs(13) = 0·674, P = 0·006).
Discussion
The present study has explored the variation in price, availability, variety and quality of a selection of F&V between conventional (supermarkets and independent F&V retailers) and non-conventional (FM) retail streams and across area-level SEP. Availability of the F&V basket was significantly different between retail streams, with supermarkets scoring better for availability than FM. The organic FM was found have significantly higher prices for the fruit basket compared with the other FM. While further significant differences were elusive in the current pilot study, an analysis of the trends indicated that potential differences may exist for price, variety and quality of F&V across areas of differing levels of socio-economic disadvantage and for availability, price, variety and quality of F&V across different retail streams. Trends indicated that although areas with greater levels of socio-economic disadvantage may have access to cheaper F&V than more advantaged areas, the variety and the quality of F&V on offer were poorer. A trend towards higher prices at FM saw FM customers paying the highest price for the all three baskets whereas those shopping at independent F&V retailers were paying the least. In terms of variety, supermarkets scored highest for all baskets with little difference in variety between FM and independent F&V retailers. While quality was not different between store types, F&V quality scores at FM and supermarkets were higher than at independent F&V retailers. Quality and price scores were significantly positively correlated for all baskets.
Similar to the results of the present study, several Australian studies have found that lower-SEP areas were not disadvantaged in terms of price of nutritious foods(Reference Turrell6, Reference Ball, Timperio and Crawford11, Reference Winkler, Turrell and Patterson12). However, it is recognized that such results do not provide insight into the ability of those people with low SEP to afford a dietary intake in line with nutritional recommendations(Reference Turrell6, Reference Winkler, Turrell and Patterson12, Reference Inglis, Ball and Crawford14). There is evidence that dietary decisions when made in the context of sustained budgetary constraints are driven by maximizing calories per dollar spent, which potentially translates into reduced purchasing of F&V(Reference Drewnowski, Monsivais and Maillot29, Reference Brimblecombe and O'Dea30). Other barriers not related to price may potentially prevent lower-SEP groups, and possibly the general population, consuming adequate F&V such as nutrition knowledge(Reference Hollis, Carmody and Connor31), taste preferences(Reference Turrell32), cooking abilities and storage facilities(Reference Giskes, Turrell and Patterson9).
The trend towards poorer F&V variety and quality in areas with higher levels of socio-economic disadvantage is important as environmental factors, whether real or perceived, potentially contribute to decreased dietary compliance among people living in relatively disadvantaged areas(Reference Inglis, Ball and Crawford14, Reference Kamphuis, Giskes and de Bruijin33, Reference Dibsdall, Lambert and Bobbin34). While earlier work in Melbourne reported a degree of area-level disadvantage in relation to produce availability and variety(Reference Ball, Timperio and Crawford11), two Brisbane-based studies did not find similar associations(Reference Turrell6, Reference Winkler, Turrell and Patterson12). Turrell's study(Reference Turrell6) did not concentrate on F&V alone and looked only at availability in supermarkets, and both Winkler et al.(Reference Winkler, Turrell and Patterson12) and Turrell et al.(Reference Turrell, Hewitt and Patterson7) only considered Brisbane (the capital city), rather than south-east Queensland. South-east Queensland may experience a different degree of residential segregation along socio-economic lines than Brisbane alone, which could then impact on observed socio-economic disparities in F&V availability and variety.
No Australian studies known to the authors have explored whether or not fresh produce in lower-SEP areas is of a different quality to that available in more advantaged areas. The trend observed in the present study towards poorer quality scores in lower-SEP areas is concerning. Poor-quality produce may erode price advantages observed in relatively disadvantaged socio-economic areas as poorer-quality produce may not keep as long, may be less visually appealing and potentially does not taste as good as higher-quality produce.
While no Australian studies were identified that explore differentials in fresh F&V price, variety, availability and quality among conventional and non-conventional retail streams, international research has found that the type of (conventional) retail outlet influences the price and availability of food(Reference Block and Kouba35, Reference Cummins and Macintyre36). Also, organic produce is often priced at a premium compared with non-organic produce(37) and therefore it is reasonable to assume that for some households organic F&V may not be easily affordable. It is therefore unsurprising that the prices of the baskets were higher at the organic FM (which also was located in a high-SEP area) than at the non-organic FM. It is acknowledged that the higher price of produce at the organic market affects the comparisons made of the basket prices across store types and SEP levels. Regardless of whether FM sell only premium priced organic produce or not, it has been argued that FM have become places for socio-economically advantaged people to shop(Reference Holloway and Kneafsey22), casting doubt over whether the promotion of FM as a public health nutrition strategy aiming to reduce dietary intake inequalities would indeed be successful.
Perceptions impact food purchasing decisions(Reference Inglis, Ball and Crawford14). Whereas quality for the three baskets was not found to be different between retail streams in the present study, information collected in parallel with that discussed here found that the majority of customers believed FM sold produce superior in taste, quality, variety and delivered more value compared with conventional retail streams (A Millichamp and D Gallegos, unpublished results). Assessment of quality is difficult(Reference Kirchler, Fischer and Holzl38). Research has demonstrated that while price is not a good indicator of ‘objective’ quality, particularly in relation to food products, consumers frequently use price to infer quality(Reference Kirchler, Fischer and Holzl38). As average prices in the current study tended to be highest at FM, this may explain the perception of better quality and ‘value’ that has been associated with FM (A Millichamp and D Gallegos, unpublished results).
The trend towards poorer variety scores found in the present study for the vegetable and the F&V baskets at FM compared with conventional retail outlets potentially reflects the commitment of FM to offer local produce only. FM often market themselves as supporting local agriculture and therefore are unlikely to consistently match the large range in produce offered by conventional retailers, who are able to import and stock a wide range of F&V varieties from all over Australia and the world.
The limitations of the current study include the inability to make interpretations at the individual level due to the ecologic study design, the inability to infer causal relationships and the lack of generalizability. As a pilot study, statistical power was lacking, hindering the ability to obtain significant findings. It is acknowledged that mean imputation is not a perfect way to deal with missing values and can reduce variable variance and influence correlations(Reference Gelman and Hill39). Although conventional retails stores were selected that were as close as possible to the FM within each geographic area, the actual distances between these shopping alternatives may not reflect shopping alternatives for those residents who lack access to a private motor vehicle. Of note, access to independent transport has been found to be more important in determining food access than living in a food desert(Reference Coveney and O'Dwyer13). Geographic areas vary in their ethnic diversity and this may impact on produce availability, price, quality and variety. Ethnicity was not directly considered in the present research; however, the use of commonly available items is likely to have reduced the impact of such differences.
Additional limitations in the study include the reliance on appearance to assess quality and the fact that the single assessor was not blinded to product price. While a defined assessment protocol was followed to improve the reliability of the quality score, it cannot be excluded that the assessment of quality was impacted by the prices observed by the researcher. In addition, the quality score did not attempt to capture other important quality attributes, such as taste, which is an important factor in determining food consumption(Reference Garcia-Bailo, Toguri and Eny40). Finally, as mentioned above, the inclusion of one organic FM which had higher produce prices alongside four non-organic FM may have confounded subsequent price comparisons. Future research would benefit from a more complete assessment of produce quality and a more in-depth consideration of the differences between organic and non-organic produce prices.
Study strengths include the attempt that was made to consider two conventional and one non-conventional (FM) F&V retail streams. The majority of past Australian research in this area has focused on conventional retail streams(Reference Turrell6, Reference Ball, Timperio and Crawford11, Reference Winkler, Turrell and Patterson12). Today's food retail environment presents consumers with more diverse retail options, clearly demonstrated by the increase in FM seen in Australia(41) and abroad(42).
Further research is required to determine whether areas that experience relatively greater levels of socio-economic disadvantage actually experience poorer availability, variety and quality of fresh F&V when both conventional and non-conventional retail streams are considered. The present pilot study drew on a small sample of F&V retailers and focused on only some of the elements that impact food choice. It is recommended that further study is carried out with a larger sample of both conventional and non-conventional retailers, to improve our understanding of how these retailer outlets influence the food environment, purchasing decisions and dietary intake and how this varies by area-level SEP.
Conclusions
The pilot study described here found that while lower-SEP areas showed a trend towards cheaper F&V, this price advantage may possibly be eroded by the trend towards poorer variety and quality of the produce available in these areas. It also demonstrated that conventional retailers and FM are not significantly different in the price, variety and quality of F&V, but that availability of F&V was better at supermarkets than FM.
Acknowledgements
This research received no specific grant from any funding agency in the public, commercial or not-for-profit sectors. No conflicts of interest are reported. A.M. designed the research project, carried out data collection and data analysis, and wrote the manuscript. D.G. acted in a supervisory capacity throughout the research project, providing guidance on design, data collection, manuscript formation and editing.


