In 1985 the FAO/WHO/United Nations University Report on Human Energy Requirements established that the energy requirement of populations should be based on total daily energy expenditure instead of energy intake, as was suggested in previous reports( 1 ). The report recommended the use of the simplified factorial method based on BMR in combination with the physical activity level (PAL) to estimate total daily energy expenditure of the population. Recognizing that measures of BMR would not be easily available worldwide, the report provided a set of age- and gender-specific predictive equations to estimate BMR based on body mass. The report also provided a range of PAL values for different standardized occupational levels of physical activity.
Following the 1985 report the interest in measuring and predicting BMR in different ethnic groups was revived, and many studies showed that the equations from the report did not accurately estimate BMR in different populations around the world( Reference Henry and Ress 2 – Reference Alfonso-Gonzáles, Doucet and Alméras 5 ). In fact, the data set used to derive the equations was based on compiled BMR measurements available in the literature mainly in the first part of the last century and included a large number of Europeans and North Americans. Therefore, these equations were based on BMR information that was not representative worldwide( Reference Piers, Diffey and Soares 6 ) and might not represent BMR in contemporary societies( Reference Müller, Bosy-Westphal and Klaus 7 ).
As has been documented in many countries in the world, Brazil faces a nutrition transition period characterized by declining rates of underweight/malnutrition and increasing rates of overweight/obesity( 8 ). Determination of energy requirement under these circumstances is a challenge for all health professionals since it relies on accurate estimation of BMR. The observed increase in the values of body mass of the population will represent greater estimated BMR and consequently higher energy requirement which will not be derived from actual higher energy expenditure. Before revisions in PAL values are implemented it is important to improve the prediction of BMR( Reference Anjos, Ferreira and Vasconcellos 9 ) because, even though the magnitude of these improvements may be small, it is well recognized that small positive energy balance over time may affect overweight and obesity( Reference Froehle 10 ). Thus, more information on BMR in segments of the population from different regions of the world is necessary to better estimate the energy requirement in population-level nutritional studies. Aware of the criticism about the BMR predictive equations, the joint FAO/WHO/United Nations University Expert Consultation on Human Energy Requirements reviewed the available information and endorsed the use of the Schofield equations( Reference Schofield 11 ) in the most recent report on Human Energy Requirements( 12 ) but emphasized the need to re-evaluate the equations in the following years when more contemporary data on BMR around the world become available.
We have previously reported the inadequacy of different predictive equations in estimating BMR in small groups of Brazilians living in tropical and temperate regions of the country( Reference Cruz, Silva and Anjos 3 , Reference Wahrlich and Anjos 13 ) and abroad( Reference Wahrlich, Anjos and Going 14 ). Thus, the objective of the present study was to measure BMR in a probability sample of adults living in Niterói, Rio de Janeiro state, Brazil and to compare the results with BMR predicted by various equations.
Methods
A household survey – the Nutrition, Physical Activity and Health Survey (PNAFS) – was conducted in 2003 to assess the nutritional and health status and the physical activity patterns of the adult population of Niterói, Rio de Janeiro state. Niterói is located in the tropics, in the south-east region of Brazil at 22°53′00′′S, 43°06′13′′W, with an area of 131 km2.
Details of the sampling procedures have been published elsewhere( Reference Anjos, Ferreira and Vasconcellos 9 , Reference Bossan, Anjos and Vasconcellos 15 , Reference Anjos, Machado and Wahrlich 16 ). In short, a sample was designed in three stages to identify: (i) census enumeration areas (CEA), (ii) households within CEA and (iii) an adult within a household. In the first stage, 110 CEA were selected with a probability proportional to the number of household dwellings from a list ordered according to average household income, which allowed an implicit income stratification of the CEA( Reference Gomes, Vasconcellos and Anjos 17 ). In the second stage, sixteen households were selected with equal probability using an inverse sampling technique( Reference Haldane 18 ) similar to that of the World Health Survey in Brazil( Reference Vasconcellos, Silva and Szwarcwald 19 ). The households were visited after the selection order until sixteen interviews were completed. In the third stage, for each interviewed household an adult was selected to participate in the study with equal probability among all adults in the household. To be eligible the adult had to be free of any cardiac or metabolic condition, and under no medication that could alter heart rate or metabolism. A sub-sample of five selected participants per CEA (n 550) was invited to come to the laboratory for a series of physiological measurements including basal metabolism.
During the household interview, all procedures related to the measurement of BMR by indirect calorimetry (BMRi) were explained and participants were acquainted with the facemask to be used in the measurements before scheduling the laboratory visit. All participants were advised to drive his/her own car or use public transportation to come to the laboratory immediately after waking early in the morning. Each participant had to have fasted for 12 h, slept for 6–8 h, and neither engaged in vigorous exercise nor consumed alcohol during the preceding 24 h.
Upon arrival at the laboratory, the participants read and signed an informed consent form. Prior to BMRi measurement the participant's adherence to the protocol was verified and a heart-rate monitor (POLAR S-610; Polar Oy, Kempele, Finland) was placed on the participant's chest after which the participant rested for 15 min in the supine position in a dark, isolated, temperature-controlled (22–25°C) room. This duration was chosen to keep the participants awake and has been proven to allow accurate BMR measures given that the test environment is physically comfortable(
Reference Compher, Frankenfield and Keim
20
). After the rest, a facemask was adjusted to the participant and gas exchange was measured for 25 min using a validated(
Reference Wahrlich, Anjos and Going
21
) calorimeter (VO2000 Portable Metabolic Testing System; MedGraphics, St. Paul, MN, USA) which was calibrated according to the manufacturer's instructions. Minute heart-rate data were obtained simultaneously to minute
 $$--><$>{{\dot{\rm V}}}{{{\rm{O}}}_2} $$$
and
$$--><$>{{\dot{\rm V}}}{{{\rm{O}}}_2} $$$
and
 $$--><$>{{\dot{\rm V}}{{\rm C}}{{{\rm{O}}}_2} $$$
. These data were converted to energy expenditure using the Weir equation(
Reference Weir
22
) and expressed in kJ/d. BMRi was calculated as the average of the last 20 min of gas-exchange data collection. One researcher monitored the participant to check for activity, hyperventilation or nap. The criterion for a valid BMRi was a <10 % variation of
$$--><$>{{\dot{\rm V}}{{\rm C}}{{{\rm{O}}}_2} $$$
. These data were converted to energy expenditure using the Weir equation(
Reference Weir
22
) and expressed in kJ/d. BMRi was calculated as the average of the last 20 min of gas-exchange data collection. One researcher monitored the participant to check for activity, hyperventilation or nap. The criterion for a valid BMRi was a <10 % variation of
 $$--><$>{{\dot{\rm {V}}}{{{\rm{O}}}_2} $$$
as recommended in the literature(
Reference Compher, Frankenfield and Keim
20
,
Reference Haugen, Melanson and Tran
23
,
Reference Leonard
24
). A total of 120 participants were rescheduled due to instability of
$$--><$>{{\dot{\rm {V}}}{{{\rm{O}}}_2} $$$
as recommended in the literature(
Reference Compher, Frankenfield and Keim
20
,
Reference Haugen, Melanson and Tran
23
,
Reference Leonard
24
). A total of 120 participants were rescheduled due to instability of
 $$--><$>{{\dot{\rm{V}}}{{{\rm{O}}}_2} $$$
, napping or restlessness.
$$--><$>{{\dot{\rm{V}}}{{{\rm{O}}}_2} $$$
, napping or restlessness.
Forty-two participants (twenty-five women) repeated the BMRi measures on two different days. Mean BMR values between days were not significantly different (mean difference = −12·8 (se 26·1) kJ/d; P = 0·63) and the two measures were highly correlated (r = 0·98). The mean intra-individual CV of BMRi was 4·72 %. The inter-individual CV was calculated for the pooled data and age groups by gender.
Anthropometric and body composition information measurements were done following the BMRi measurement with the participant barefoot and wearing standardized light clothes and no shoes. Stature (S) was measured in duplicate on a wooden stadiometer to the nearest 0·1 cm. The average of the two measures was used in the analysis. Body mass (BM) was obtained with an electronic scale (Tanita TBF-305; Tanita Corporation, Tokyo, Japan) to the nearest 0·2 kg. BMI was calculated as the ratio between BM (in kilograms) and the square of S (in metres). Percentage of body fat was measured using a validated leg-to-leg bioimpedance scale (Tanita TBT-305) using the equations described in Wahrlich et al.( Reference Wahrlich, Anjos and Blew 25 ). The study was conducted according to the guidelines laid down in the Declaration of Helsinki and all procedures involving human subjects were approved by the Ethics Committee of the Oswaldo Cruz Foundation.
Data analysis
Means and their standard errors, minimum and maximum values are presented for all continuous variables. Nutritional status was evaluated for gender and age groups according to BMI cut-off points proposed by WHO( 26 ): underweight (BMI < 18·5 kg/m2); normal (18·5 ≤ BMI<25·0 kg/m2); overweight (25·0 ≤ BMI < 30·0 kg/m2); and obesity (BMI ≥ 30·0 kg/m2). Measured BMRi was compared with estimated BMR from various predictive equations: those of Schofield( Reference Schofield 11 ), Henry and Rees( Reference Henry and Ress 2 ), and Harris and Benedict( Reference Harris and Benedict 27 ). The equations are based on BM, S, age (A) and gender (Table 1). The Harris and Benedict( Reference Harris and Benedict 27 ) equations are given in kcal/d and include age. Henry and Rees( Reference Henry and Ress 2 ) do not provide equations for the age group ≥60 years.
Table 1 Equations used in the present study to predict BMR

BM, body mass in kilograms; S, stature in metres; A, age in years.
1 kcal = 4·184 kJ.
Bias (predicted BMR minus BMRi) was calculated for each equation along with the percentage of participants whose predicted BMR fell within ±10 % of measured BMRi ( Reference Frankenfield, Roth-Yousey and Compher 28 ). Bland–Altman( Reference Bland and Altman 29 ) analysis was performed for the comparison between BMR predicted with the Schofield equations and measured BMRi.
Sample weights were calculated as the inverse of the product of the inclusion probabilities in each selection stage. The Integrated Household Weighting System was used to calibrate the sample weights in order to adjust the estimates to known population totals by gender and age groups. Of the recruited 550 participants, BMRi measurement was not performed in twenty-one participants due to instrument malfunction, non-adaptation to the facemask or refusal. The final sample of 529 participants (190 men and 339 women) represents the estimated total of 324 671 adults (145 886 men and 178 785 women) living in Niterói at the time of the study. The data were divided into age groups (20–30 years; 30–60 years; ≥60 years) merely for comparison with the results of the current recommended predictive equations of BMR( Reference Schofield 11 , 12 ). All analyses were performed using the SAS statistical software package release 9·2. Mean values, standard errors and 95 % confidence intervals were obtained using the procedure SURVEYMEANS. The procedure SURVEYREG was used to generate gender-specific BMR prediction from equations based on BM, S and A. Significance of the difference between measured BMRi and predicted BMR for the pooled data and within each age category was identified when the 95 % confidence interval of the bias did not include zero.
Results
Age ranged from 20·0 to 80·3 years and the mean value was 42·6 (se 1·4) years for men and 44·9 (se 1·0) years for women (Table 2). The participants presented a large range of BMI (15·5–45·3 kg/m2). Based on mean BMI, both men and women were, on average, overweight (BMI ≥ 25·0 kg/m2). Only approximately 1 % (2·0 % and 0·9 % of females and males, respectively) of participants were underweight. Obesity was higher in women than men (16·3 % and 12·4 %, respectively). Percentage body fat increased with increasing age for both men and women and was always higher in women than in men.
Table 2 Age, anthropometric and body composition data according to age group: men (n 190) and women (n 339) from Niterói, Rio de Janeiro state, Brazil

The inter-individual CV of BMRi was 12·8 % in women and 13·8 % in men. In women, the CV was 11·6 %, 12·8 % and 12·6 % for the 20–30-, 30–60- and ≥60-year-old groups, respectively. The same values for men were 11·0 %, 12·3 % and 15·8 %, respectively. Average measured BMRi values were 5839·7 (se 73·9) kJ/d and 4758·1 (se 39·5) kJ/d for men and women, respectively (Tables 3 and 4). BMR values decreased with increasing age. Estimated BMR by all predictive equations was significantly higher than measured BMRi in both men and women in each age group. Larger BMR overestimation occurred for young men when using the Schofield equations (26·0 %) followed by the Harris and Benedict (24·0 %) equation. For older women (≥60 years), the Schofield and Harris and Benedict equations yielded lower overestimations compared with both groups of younger women (Table 4). When using the Henry and Rees equations, the lowest overestimation within women was observed in the group aged 20–30 years (13·8 %; Table 4), whereas in men the lowest overestimation occurred for the age group of 30–60 years (11·8 %; Table 3). Overall, the percentage of participants whose BMR predicted by the Schofield equations fell within 10 % of measured BMRi was very low (7·8 % and 14·1 % of Niterói men and women, respectively).
Table 3 Indirectly measured and predicted BMR according to age group: men (n 190) from Niterói, Rio de Janeiro state, Brazil
BMRi, BMR measured by indirect calorimetry.
*Predicted BMR – BMRi.
†(Bias/BMRi) × 100.
‡Percentage of participants whose predicted BMR fell within 10 % of BMRi.
Table 4 Indirectly measured and predicted BMR according to age group: women (n 339) from Niterói, Rio de Janeiro state, Brazil

BMRi, BMR measured by indirect calorimetry.
*Predicted BMR – BMRi.
†(Bias/BMRi) × 100.
‡Percentage of participants whose predicted BMR fell within 10 % of BMRi.
When results were compared according to BMI classification, predicted BMR was higher than measured BMRi in all categories (Table 5). Both overweight and obese men and women had higher BMR compared with underweight and normal-weight participants. The lowest overestimation (13·2 %) was seen in underweight women and the highest in underweight men (28·3 %). Overall, the Schofield equations overestimated BMR by about 20 % (19·3 (se 0·6) % in women and 22·0 (se 0·7) % in men).
Table 5 Physical characteristics and indirectly measured and predicted BMR according to nutritional status: men (n 190) and women (n 339) from Niterói, Rio de Janeiro, Brazil

F, females; M, males; BMRi, BMR measured by indirect calorimetry.
*BMR predicted by the Schofield equations( Reference Schofield 11 ).
†Predicted BMR – BMRi.
‡(Bias/BMRi) × 100.
§Percentage of participants whose predicted BMR fell within 10 % of BMRi.
The relationship between bias and average of predicted and measured BMRi (Bland–Altman analysis) is presented in Fig. 1 and indicates that the bias does not vary in any systematic way (R 2 = 0·118, 0·067 and 0·025 for pooled, men and women, respectively). Average biases were 1055·2 (95 % CI 1006·5, 1104·1) kJ/d for the pooled data, 1263·6 (95 % CI 1185·5, 1341·7) kJ/d for men and 885·2 (95 % CI 839·3, 931·2) kJ/d for women. The generated equations are:
 $${ {\rm{Males}},\,{\rm{BMR }}\ ({\rm{kJ/d}})\: = \,\:(9 \cdot 99\:\times \:{\rm{BM}})\: + \:(7 \cdot 14\:\times \:{\rm{S}}) \cr &- (2 \cdot 79\: \times \:{\rm A})\: - \:450 \cdot 5 \cr &\!\!\!\!\!\!\!\!\!\!\!\!\!\!\!\!\!\!\!\!\!\!\!\!\!\!\!\!\!\!\!\!\!\!\!\!\!\!\!\!\!\!\!\!\!\!\!\!\!\!\!\!\!\!({{R}^2} \:= \:0 \cdot 87;\,{\rm{SEE}}\: = \:290 \cdot 0\,{\rm{kJ/d}}) \rm$$
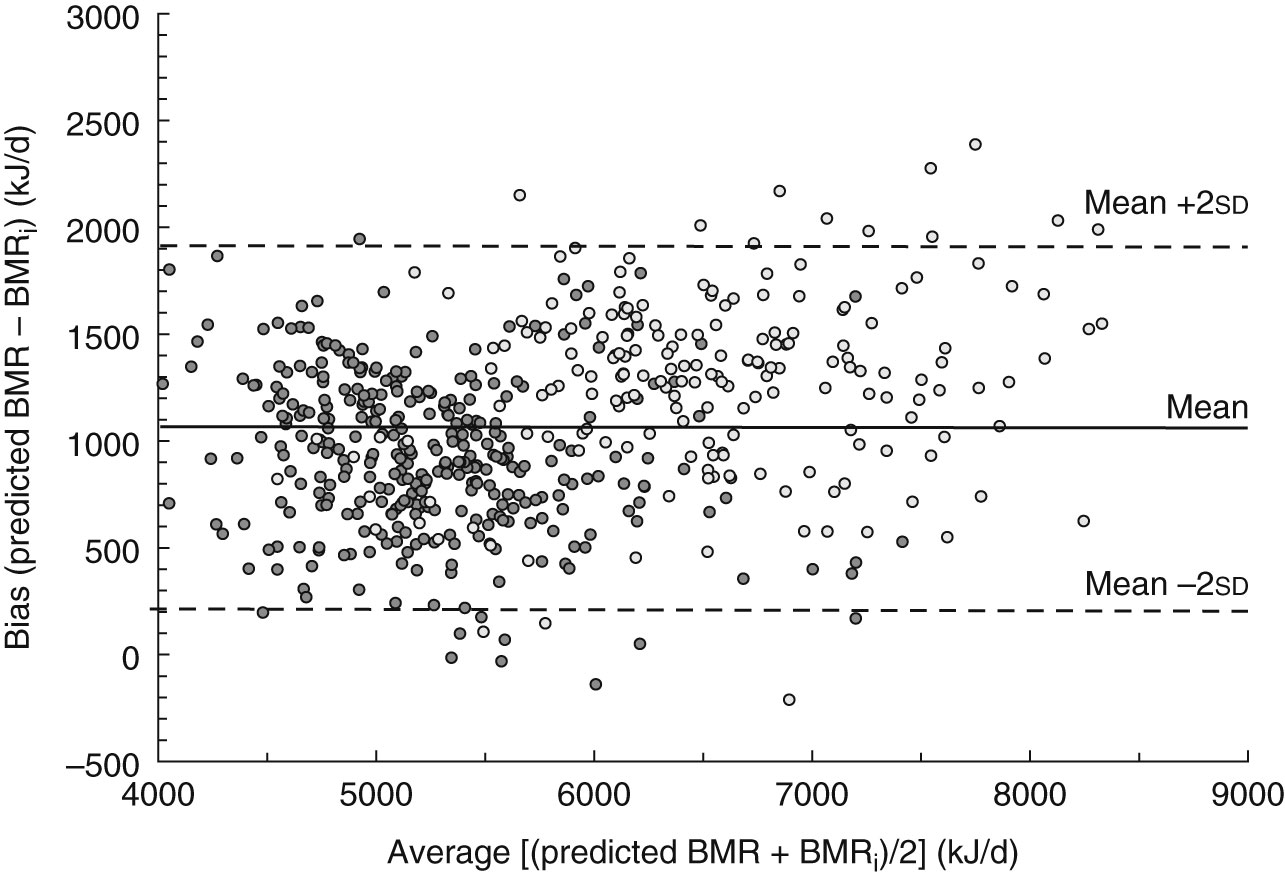
Fig. 1 Bland–Altman plot showing the mean bias (–—) and limits of agreement (–––) between BMR predicted by Schofield's equations(
Reference Schofield
11
) and BMR measured indirectly (BMRi) among adults aged ≥20 years (
 $$$$
, men, n 190;
$$$$
, men, n 190;
 $$$$
, women, n 339) from Niterói, Rio de Janeiro state, Brazil
$$$$
, women, n 339) from Niterói, Rio de Janeiro state, Brazil
and
 $${ {\rm{Females,}}\,{\rm{BMR}}\ {\rm{(kJ/d)}}\: = \,\,\:({\rm{8}} \cdot {\rm{95}}\:\times \:{\rm{BM)}}\: + \:({\rm{8}} \cdot {\rm{87}}\:\times \:{\rm{S)}}\: \cr & - \:({\rm{0}} \cdot {\rm{70}}\:\times \:{\rm{A)}}\: - \:{\rm{814}} \cdot {\rm{3}} \cr &\!\!\!\!\!\!\!\!\!\!\!\!\!\!\!\!\!\!\!\!\!\!\!\!\!\!\!\!\!\!\!\!\!\!\!\!\!\!\!\!\!\!\!\!\!\!\!\!\!\!\!\!\!\!\!\!\!\!\!{\rm{(}}{{R}^2} = \:0 \cdot 83{\rm{;}}\,{\rm{SEE}}\: = \:{\rm{254}} \cdot {\rm{5}}\,{\rm{kJ/d)}} \rm$$
where SEE is the standard error of the estimate.
Discussion
The present study measured BMRi in participants from a household survey in Niterói, Rio de Janeiro state, Brazil and compared the results with BMR predicted by different equations. Based on a literature review performed by the authors, the present study is apparently the largest data set of BMR obtained in a developing country and the first attempt to obtain BMR information in a probability sample of a specific population. The majority of the studies with large samples used to generate BMR predictive equations were based mainly on compiled data available in the literature( 1 , Reference Henry and Ress 2 , Reference Müller, Bosy-Westphal and Klaus 7 , Reference Schofield 11 ).
As for many developing countries, there are very few data on BMR in Brazilian samples. Absolute BMR values for men and women of Niterói were similar to the values of seventy male garbage collectors of mean age ∼37 years (5888·2 (se 106·2) kJ/d)( Reference Anjos, Ferreira and Damião 30 ) and eighty-one college-aged women (4819·1 (se 74·3) kJ/d) living in Rio de Janeiro, but lower than the values of forty-eight students of college age (twenty-three women) from southern Brazil( Reference Wahrlich and Anjos 31 ). Rodrigues et al.( Reference Rodrigues, Mancini and Dalcanale 32 ) retrospectively analysed resting energy expenditure data of 760 Brazilian female participants in a hospital setting and the results were higher than the values found for women from Niterói. This discrepancy may be due to the characteristics of Rodrigues et al.'s sample that included in-patients and comprised a large number of obese females.
All predictive equations examined in the present analysis significantly overestimated mean BMR in both men and women. The greatest overestimation, in general, was observed with the equations presently recommended for international use( 12 ) and the lowest with the equations suggested to be used in populations living in the tropics( Reference Henry and Ress 2 ). The FAO/WHO recommended equations to be used internationally (Schofield)( Reference Schofield 11 ) have been reported to overestimate BMR, particularly in people living in tropical regions of the world( Reference Henry and Ress 2 , Reference Alves, Rocha and Gonzalez 33 , Reference Nhung, Khan and Hop 34 ). For many years it was thought that people living in the tropics had lower BMR values comparatively to Europeans and North Americans( Reference Henry and Ress 2 , Reference Schofield 11 ). In fact, this idea gained strength in the early years of the 20th century when Almeida( Reference Almeida 35 , Reference Almeida 36 ) found that the BMR values of twenty Brazilian men living in Rio de Janeiro (tropics) were 20 % lower than the published values for North American men. Later, Almeida( Reference Almeida 37 ) concluded that BMR was lower in the populations living in the tropics based on measured BMRi values of eight individuals in comparison to the values obtained from the equations of Harris and Benedict( Reference Harris and Benedict 27 ). During the last century these premises have been weakened by growing evidence that BMR values of people living in the tropics are similar to those of people living elsewhere when body composition is considered( Reference Wahrlich and Anjos 4 , Reference Luke, Rotimi and Adeyemo 38 ). Comparison of results from studies in young Brazilian women using the same protocol and calorimeter showed that BMR was not significantly different between women who lived in the tropics (Niterói, Rio de Janeiro state)( Reference Cruz, Silva and Anjos 3 ) and women who lived below the Tropic of Capricorn in the temperate region of the country (Porto Alegre, Rio Grande do Sul state, at 30°01′59′′S, 51°13′48′′W)( Reference Wahrlich and Anjos 13 ).
The Schofield equations have also been shown to be inadequate to estimate BMR in clinical settings of people living in Europe and North America( Reference Alfonso-Gonzáles, Doucet and Alméras 5 , Reference Müller, Bosy-Westphal and Klaus 7 , Reference Li, Tereszkowski and Edwards 39 – Reference Miyake, Tanaka and Ohkawara 43 ). It has been suggested that the equations have unsolved problems in origin because they were based on a non-representative sample of the population( Reference Piers, Diffey and Soares 6 ), limiting their use for prediction of BMR in different populations. The equations were derived from compiled data available in the literature mainly in the first part of the last century and the final data set included 7173 participants (4809 men and 2364 women) who were mainly from Europe and North America( Reference Henry and Ress 2 ). Approximately 50 % of the sample were Italians who had higher BMR compared with participants of other nationalities represented in the data set, which may have introduced some bias in the final equations( Reference Hayter and Henry 44 ).
Aware of these problems, Henry and Rees( Reference Henry and Ress 2 ) revised the available information on BMR of people living in the tropical region and ended up with data on 2822 subjects (3–60 years of age), of whom 1896 were between 18 and 60 years of age. The authors derived different equations for men and women of four age groups (3–10 years; 10–18 years; 18–30 years; 30–60 years). These equations yield lower BMR values than the ones predicted by the Schofield( Reference Schofield 11 ) equations, but the values were still significantly greater than BMRi in the adult population of Niterói. This has also been reported in other samples of adult women from tropical regions( Reference Cruz, Silva and Anjos 3 , Reference Wahrlich and Anjos 31 ).
In clinical settings, the equations of Harris and Benedict( Reference Harris and Benedict 27 ) are still widely used( Reference Weijs and Vansant 45 ). These equations were derived from BMRi measurements of 239 American adults (136 women) almost a century ago with techniques that may have led to some discomfort and therefore higher BMR values( Reference Clark and Hoffer 46 ). There is some evidence that these equations do not work in the general North American population( Reference Frankenfield, Roth-Yousey and Compher 28 ) and other groups worldwide( Reference Li, Tereszkowski and Edwards 39 , Reference Yang, Li and Mao 41 , Reference El Ghoch, Alberti and Capelli 47 – Reference Horie, Gonzalez and Torrinhas 49 ), but in some studies they have been shown to be valid( Reference Weijs and Vansant 45 , Reference Amirkalali, Hosseini and Heshmat 50 ). As observed in other studies conducted in tropical regions( Reference Cruz, Silva and Anjos 3 , Reference Wahrlich and Anjos 4 , Reference Piers, Diffey and Soares 6 , Reference Santos, Suen and Marchini 48 ), the Harris and Benedict( Reference Harris and Benedict 27 ) equations significantly overestimated BMR in all age groups of the adult population of Niterói. Regression analyses with BMR data of the adult population of Niterói yielded equations with higher R 2 and lower SEE than the values of the three sets of published equations used in the present study. It is worth noting that only the Harris and Benedict equations included BM, S and A, the same variables included in the developed equations.
Niterói is an urban city located in the most developed area of Brazil, the south-eastern region, with high prevalences of overweight/obesity in adults( Reference Bossan, Anjos and Vasconcellos 15 ) and adolescents( Reference Gomes, Vasconcellos and Anjos 17 ). Indeed, the prevalence of underweight was very low in both adult men and women of Niterói but overweight was observed in >40 % of the adult population. Energy requirement determination in countries undergoing nutrition transition is a challenge, since it relies on accurate estimation of BMR which is multiplied by appropriate values of the PAL depending on the lifestyle of the subjects( 12 ). The results of the present study indicate that BMR is not adequately estimated across all nutritional status categories. With the current recommended procedures( 12 ), the energy requirement of the adult population of Niterói would be overestimated by ∼20 %, exactly the same value documented by Almeida some 80 years ago and a problem for a population undergoing nutrition transition at present. It is evident that more data on energy expenditure must be generated for establishing the energy requirement of populations in the tropics( Reference Vasconcellos and Anjos 51 ) to ascertain whether it will be necessary to revise the suggested PAL values presently recommended( Reference Anjos, Ferreira and Vasconcellos 9 ).
Conclusion
The present study showed that the currently available predictive equations of BMR( Reference Henry and Ress 2 , Reference Schofield 11 , Reference Harris and Benedict 27 ) are not adequate to estimate BMR in the adult population living in Niterói, Rio de Janeiro state, Brazil. A new set of equations has been developed and should be validated before its use is recommended.
Acknowledgements
Sources of funding: The research upon which the manuscript is based was partially funded by the Brazilian National Research Council (CNPq, Proc. 200837/03-6, 308489/09-8, 308833/06-6, 471172/01-4 and 475122/03-8) and the Oswaldo Cruz Foundation (Fiocruz PAPES III – 250·139). Conflicts of interest: The authors report no conflict of interest regarding the manuscript. Authors’ contributions: L.A.A., V.W. and M.T.L.V. planned the research. M.T.L.V. designed the sample and calculated the natural and calibrated sampling weights. L.A.A. and V.W. supervised the field data collection and were in charge of data analyses. V.W. wrote the first draft of the paper, which was revised and approved by the other authors.