


Adolescents in the 21st century are coming under increased pressure to be thinner, which may lead to dieting or other behaviours to induce weight loss(Reference Field, Javaras and Aneja1, Reference Haines, Kleinman and Rifas-Shiman2). In the Health Behaviour in School-Aged Children (HBSC) study, of 11- to 18-year-olds from forty-one participating sites across Europe and America, the overall prevalence of those engaged in weight-reduction behaviours at age 13 years was 14 %, with rates in individual countries varying from 4 % in Turkey to 25 % in Iceland(Reference Currie, Hurrelmann and Settertobulte3). Teenagers who are trying to lose weight do not always follow a healthy diet(Reference Field, Javaras and Aneja1). Previous research has suggested that adolescents may exhibit less healthy dieting behaviours than adults who are trying to lose weight(Reference Neumark-Sztainer, Rock and Thornquist4). In addition, dieting in adolescence may lead to an increase in unhealthy weight-control behaviours such as binge eating, purging, missing meals or excluding certain food groups entirely(Reference Field, Javaras and Aneja1, Reference Haines, Kleinman and Rifas-Shiman2, Reference Vik, Overby and Lien5).
The diets of adolescents who are trying to lose weight have been shown to differ from those of non-dieters, especially among girls. Some authors have reported that those who are on a diet are more likely to consume less food by cutting out certain foods, resulting in decreased intakes of fruit, vegetables, grains and selected micronutrients(Reference Neumark-Sztainer, Hannan and Story6–Reference Larson, Neumark-Sztainer and Story8), as well as being less likely to consume snack foods and sugar-sweetened beverages than non-dieters(Reference Larson, Neumark-Sztainer and Story8). Other studies have found that dieting in adolescents is associated with increased fruit and vegetable intake and decreased fat intake(Reference French, Perry and Leon9). These studies are in agreement with research showing that adolescents may consider dieting to be a reduction of energy, fat or sugar or to change their diet and increase consumption of foods they consider healthy(Reference Roberts, Maxwell and Bagnall10). In general, cross-sectional studies have shown that dieters skip breakfast more often than non-dieters(Reference Lattimore and Halford11, Reference Timlin, Pereira and Story12). In one such study female dieters were more likely to skip breakfast, while male dieters were more likely to skip lunch(Reference Brugman, Meulmeester and Spee-Van der Wekke13). Longitudinal evidence suggests that those adolescents who persist on dieting missed more meals, with breakfast being missed the most often(Reference Larson, Neumark-Sztainer and Story8).
While previous research has focused on certain foods or food groups, to our knowledge no study has looked at overall dietary patterns. Individual foods or food groups are not eaten in isolation; therefore previous research does not allow us to elucidate whether those dieters who increase their fruit and vegetable intake also decrease their intake of less healthy foods at the same time. Therefore, it may be more useful to examine overall dietary intake and meal patterns in relation to dieting behaviours than to look at individual food groups. This may allow for the representation of the complex interactive effects of multiple dietary exposures. As food preferences and psychosocial factors have also been shown to be related to consumption(Reference Brug, Tak and te Velde14), it is important that we investigate these factors in relation to dieting. There is a lack of information regarding adolescent dieters in New Zealand (NZ). To our knowledge there have been only a limited number of studies investigating this, and the focus was on the prevalence of intending to lose weight rather than actual weight control(15). As previous research has found that dieting is associated with both attitudes to and beliefs towards food, as well as changes in both diet quality(Reference Neumark-Sztainer, Hannan and Story6–Reference French, Perry and Leon9) and skipping meals(Reference Larson, Neumark-Sztainer and Story8, Reference Lattimore and Halford11–Reference Brugman, Meulmeester and Spee-Van der Wekke13), we wanted to investigate whether participants’ attitudes and beliefs towards healthy eating and their actual patterns of consumption would predict dieting. For example, were those with less favourable dietary pattern scores (indicating less interest in consuming a healthier diet) less likely to diet?
Therefore, the objectives of the present study were to investigate: (i) the percentage of Otago adolescents who are currently on a diet or doing something to lose weight; and (ii) whether dietary patterns or meal skipping, and other selected psychosocial factors, differ between dieters and non-dieters.
Methods
Study design and participants
The present study analysed data collected as part of the Otago School Students Lifestyle Survey (OSSLS), a cross-sectional survey conducted in the final school term (summer months October to December) of 2009, which investigated food choice, physical activity and related factors. All secondary schools in the Otago area (as defined by the NZ Ministry of Education) were invited to take part in order to achieve a sample from as many school deciles as possible. School decile is a socio-economic status (SES) indicator of the school, and is based on the proportion of students at the school with low SES as defined by the student's home address. Decile 1 includes the 10 % of schools with the highest proportion of students from low-SES communities; decile 10 the lowest proportion. Cluster sampling was undertaken using schools as sampling units and classrooms within schools as clusters. Classes from both Year 9 and Year 10 from each school were randomly invited to take part. The number of classes sampled at each school ranged from one per year group at the smaller schools to four classes per year group at the larger schools. A total of 1658 students were invited to take part in the study and 1646 agreed (99·3 % response rate). Figure 1 shows study recruitment.
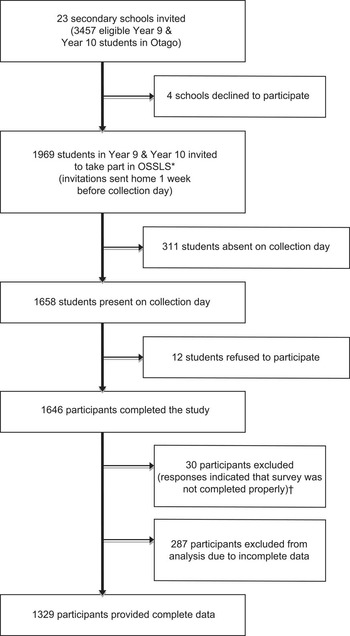
Fig. 1 Flowchart showing recruitment of schools and adolescents into the Otago School Students Lifestyle Survey (OSSLS). *Not every class was invited into the study; the number of classes sampled per school was dependent on the school year size at each school. This ranged from one class per year in smaller schools to four classes per year at larger schools. †Reasons for exclusion included clicking patterns detected, consistently choosing contradictory options to similar questions or consistently picking unrealistic answer options
Invited students were given packs containing separate information sheets and consent forms for students and their parents. Students were required to sign a consent form in order to participate, while parents were only required to provide opt-out consent on behalf of their child. The study was approved by the University of Otago Human Ethics Committee.
Survey
The survey was administered online during class time in the schools’ computer rooms. Students self-reported their date of birth, age, sex, ethnicity, height, weight and residential address. Neighbourhood-level SES was assessed using the New Zealand Deprivation Index Score (NZDep06), which is derived from residential address and provides a measure of area-level deprivation(Reference Salmond, Crampton and Atkinson16). The NZDep06 combines nine variables from the 2006 census that reflect eight dimensions of deprivation, including income, owning a house and access to a car. The deprivation index is an ordinal scale ranging from 1 (least deprived) to 10 (most deprived) and this variable was collapsed into five categories. BMI was calculated from self-reported heights and weights and participants were categorized as normal weight, overweight or obese using the reference International Obesity Taskforce cut-off values(Reference Cole, Bellizzi and Flegal17). Physical activity was measured using the previously validated Youth Physical Activity Questionnaire(Reference Corder, van Sluijs and Wright18).
Those adolescents who were currently on a diet or doing something to lose weight (dieting) were identified using the HBSC question ‘At present, are you on a diet or doing something else to lose weight?’ Responses of ‘no, my weight is fine’, ‘no, but I should lose some weight’, ‘no, because I need to put on weight’ and ‘yes’ could be chosen by participants. This question was dichotomised into 0 for those participants who answered ‘yes’ or 1 for all other responses. Food consumption was assessed with a previously validated fifteen-item FFQ(Reference Vereecken and Maes19). The food items included were fruit, vegetables, sweets, chocolates, sugary soft drinks, diet soft drinks, low-fat milk, regular milk, cheese, breakfast cereals, white bread, brown/wholegrain bread, crisps, hot chips (French fries) and alcohol. Participants reported their usual intake on a seven-point scale, ranging from ‘never’ to ‘every day more than once a day’. Previous research showed that the reliability of this FFQ is acceptable to good, with weighted κ values ranging from 0·45 for ‘sweets’ to 0·70 for ‘skimmed milk’(Reference Vereecken and Maes19). Acceptable validity was also shown when compared with a 7 d diet record, with low levels of gross misclassification being shown; for example, 2 % for vegetables and 7 % for cheese(Reference Vereecken and Maes19). Validation of this questionnaire in a sample of Otago adolescents of the same age as our study population showed similar reliability and validity to previously published work on this questionnaire (JE Wong, PML Skidmore, WR Parnell et al., unpublished results).
Liking scores were determined from the question ‘Do you like these foods?’ Participants could choose the following responses: ‘like’, ‘they're OK’ and ‘dislike’. Scores of overall liking were obtained by summing responses for groups of foods. These questions asked whether participants like the following commonly consumed foods: cake, ice cream, chocolate, pasta, rice and potatoes. Liking scores were calculated for ‘sweet food’ (likes cake, ice cream and chocolate) and ‘starchy food’ (likes pasta, rice and potatoes). Frequency of weekend breakfast, lunch and dinner was assessed using the question ‘How often do you usually have breakfast/lunch/evening meal (more than a drink) during the weekend?’ Responses of ‘I never have breakfast/lunch/an evening meal on the weekends’ to ‘I usually have breakfast/lunch/evening meal on only one day on the weekend (Saturday or Sunday)’ to ‘I usually have breakfast/lunch/evening meal on both weekend days (Saturday and Sunday)’ could be chosen by participants. Weekday meal frequency was assessed with the questions ‘How often do you usually have breakfast/lunch/evening meal (more than a drink) during the week?’, using responses of ‘I never have breakfast/lunch/evening meal on weekdays’ to ‘5 d’. These two categories were combined to obtain the variable ‘the number of meals eaten for the whole week’ for each meal occasion and to determine if the participant eats three meals per day. No direct questions were asked about skipping meals.
Participants were also asked whether they considered ‘the healthiness of the food’, ‘the taste of the food,’ ‘that the food is quick and easy to eat’ and ‘that the food is easy to get’ as important or not important. The participants were also asked ‘If I eat fruit and vegetables every day I believe that… (i) it will make me better at sport; (ii) it will make me look better’, with either ‘yes’ or ‘no’ responses given for all food choice factor questions.
Experienced researchers piloted the survey questions and data collection methods for comprehension and acceptability with both students from the relevant age groups and school staff. The online survey was also piloted to ensure it could be completed within one class period and refinements were made to the survey before data collection.
Statistical analysis
Survey commands used sampling weights and primary sampling units (schools) to ensure results were representative of the Year 9 and Year 10 population in the sampled area. Participants were excluded if their responses indicated the survey was not completed properly. Reasons for exclusion included clicking patterns detected (e.g. participants who consistently chose the extreme left or right answer options for all questions, or whose answers formed patterns on the screen), participant consistently chose contradictory options to similar questions or participant consistently picked unrealistic answer options (e.g. a boy reported being in a girls-only school and provided an unrealistic date of birth and inconsistent answers to demographic questions). Only participants who had complete data for all variables of interest were included in the final analysis. Sex differences and differences in demographic variables between dieters and non-dieters were examined using χ2 tests. Dietary pattern scores were derived using principal components analysis (PCA). All fifteen food items from the FFQ were entered into the PCA as raw frequencies. Eigenvalues above 1 and factor loadings above 0·3 were considered significant when naming patterns. PCA was carried out without rotation. The PCA was then repeated using varimax rotation but as this made no real difference to either the PCA patterns or the factor loadings, only results of the unrotated PCA are presented. The patterns produced were transformed to remove skew and converted to Z-scores.
Multiple logistic regression analysis was used to examine the relationship between dieting and the exposure variables. The influence of confounding variables was assessed by fitting three models. In model 1 adjustment was for age only. As sex(Reference Bradlee, Singer and Qureshi20), obesity(Reference Bradlee, Singer and Qureshi20) and SES(Reference Cutler, Flood and Hannan21, Reference Scully, Dixon and White22) have been found to be associated with food choice, these were additionally adjusted for in model 2. Model 2 was initially run with a neighbourhood-level measure of deprivation (NZDep06). This model was repeated with individual measures of deprivation, including household crowding and car ownership. As NZDep06 was the only significant measure of deprivation seen, it was used in the models. As physical activity has also been associated with food choice(Reference Pearson, Atkin and Biddle23, Reference Sanchez, Norman and Sallis24), model 3 included all variables in model 2 plus physical activity. Interactions between BMI and SES, BMI and ethnicity and BMI and age were also tested for but were not included in the models if they were not statistically significant. A P value of < 0·05 was considered statistically significant. Statistical analyses were undertaken using the STATA statistical software package version 10·0SE (StatCorp, College Station, TX, USA).
Results
Figure 1 shows an overview of school and student recruitment. The participation rate for schools was 82·6 %. Of those 1658 students available on data collection days, 1646 participated in OSSLS (99·3 % classroom response rate); OSSLS participants represented 57 % of the general population of all eligible students. The school deciles for the nineteen participating schools ranged from 4 to 10, with the deciles of the four non-participating schools ranging from 8 to 10. Of the 1616 students who completed the survey satisfactorily, 1329 (82·2 %) had complete demographics, food questionnaire and BMI data. The mean age of participants was 14·09 (sd 0·70) years. Of the participants, 59 % were male, 18 % were overweight and 5 % were obese (Table 1). Overall, 10 % of participants reported they were currently dieting. Some 14·7 % of girls and 7·0 % of boys reported being on a diet (Table 1), while of those not dieting, 21 % reported they should lose weight, 8 % reported they should gain weight and 61 % reported their weight was fine (data not shown).
Table 1 Characteristics of participants: adolescent students from school years 9 and 10, Otago, New Zealand, October–December 2009
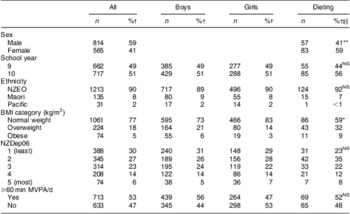
Dieting, currently on a diet or doing something to lose weight; NZEO, New European and Others; NZDep06, New Zealand Deprivation Score; MVPA, moderate-to-vigorous physical activity.
*P < 0·05, **P < 0·01, ***P < 0·001.
†Adjusted for survey weights.
‡Percentage of dieters.
§χ 2 test for differences by sex or differences in demographic variables between dieters and non-dieters.
PCA produced three patterns that explained 50·4 % of the total variance (Table 2). The three patterns produced were a Treats pattern (loading positively for sweets, chocolate, sugary drinks, crisps and hot chips), a Fruit and Vegetable pattern (loading positively for fruit, vegetables and brown bread) and a Breakfast Foods pattern (loading positively for full-fat milk, cereal and white bread). As the relationship between dieting and the Fruit and Vegetable pattern was not linear, results are presented by quintiles. There was no consistent relationship between dieting and Fruit and Vegetable pattern scores. No significant differences were seen for the Treats or Breakfast Foods dietary pattern scores between those who reported they were currently dieting and those not (Table 3). Those currently dieting had a significantly lower score for liking sweet foods compared with those not currently dieting (OR = 0·72, 95 % CI 0·61, 0·84).
Table 2 Factor loadings of various food items for the three principal dietary components identified (loadings above 0·3 are shown in bold) based on the fifteen-item FFQ from the Health Behaviour in School-Aged Children study completed by adolescent students from school years 9 and 10, Otago, New Zealand, October–December 2009
†Variance explained.
Table 3 Associations between food patterns and liking scores and dieting (currently on a diet or doing something to lose weight) among adolescent students from school years 9 and 10, Otago, New Zealand, October–December 2009
All data adjusted for survey weights.
*P < 0·05, **P < 0·01, ***P < 0·001.
†Logistic regression controlled for age.
‡Logistic regression controlled for age, sex, BMI classification and NZDep06 (New Zealand Deprivation Score).
§Overall result not significant (model 1: OR = 1·01, 95 % CI 0·82, 1·25; model 2: OR = 1·01, 95 % CI 0·80, 1·29).
There were no significant relationships between dieting and weekend meal consumption. Those currently not dieting were 17 % more likely to eat lunch and 22 % more likely to eat an evening meal on one more weekday than those who were dieting (Table 4). Similar results were shown for the number of lunches (OR = 0·84, 95 % CI 0·74, 0·96) and evening meals (OR = 0·83, 95 % CI 0·71, 0·98) eaten during the entire week (7 d, data not shown). No relationship was found between reported breakfast consumption frequency and those currently dieting.
Table 4 Associations between meal frequency and dieting (currently on a diet or doing something to lose weight) among adolescent students from school years 9 and 10, Otago, New Zealand, October–December 2009
All data adjusted for survey weights.
*P < 0·05, **P < 0·01, ***P < 0·001.
†Logistic regression controlled for age.
‡Logistic regression controlled for age, sex, BMI classification and NZDep06 (New Zealand Deprivation Score).
Those who reported themselves as currently dieting were more likely to consider healthiness (OR = 2·18, 95 % CI 1·11, 4·26), but not taste, an important factor when choosing food. They were also more likely to agree with the statement ‘eating fruit and vegetables makes you better looking’ (OR = 1·66, 95 % CI 1·24, 2·23; Table 5). As adjustment for physical activity made no difference to the effect sizes in all analyses, results for model 3 are not shown.
Table 5 Associations between factors associated with food selection and dieting (currently on a diet or doing something to lose weight) among adolescent students from school years 9 and 10, Otago, New Zealand, October–December 2009
All data adjusted for survey weights.
*P < 0·05, **P < 0·01.
†Logistic regression controlled for age.
‡Logistic regression controlled for age, sex, BMI classification and NZDep06 (New Zealand Deprivation Score).
No significant sex by dieting interaction was found. When data for boys and girls were analysed separately, differing effect sizes were seen for boys and girls for selected variables (Table 6). For example, boys who reported that they were dieting were more likely than non-dieting boys to report they thought eating fruit and vegetables makes you better looking (OR = 2·12, 95 % CI 1·34, 3·35), but no significant relationship was seen in girls. When analyses were repeated for model 1 including those with no BMI data, effect sizes were unchanged.
Table 6 Associations between selected correlates and dieting (currently on a diet or doing something to lose weight), analysed separately among female and male adolescent students from school years 9 and 10, Otago, New Zealand, October–December 2009
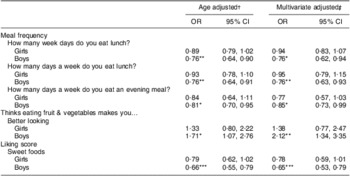
Only kept those with both models significant.
All data adjusted for survey weights.
*P < 0·05, **P < 0·01, ***P < 0·001.
†Logistic regression controlled for age.
‡Logistic regression controlled for age, sex, BMI classification and NZDep06 (New Zealand Deprivation Score).
Discussion
The prevalence of NZ high-school students who reported currently trying to lose weight in the present study was 10 %, which is comparable to other Western countries(Reference Currie, Hurrelmann and Settertobulte3). The authors were interested in seeing whether unhealthy attitudes, beliefs and behaviours were associated with dieting in adolescents. Previous studies have looked at individual foods or food groups(Reference Neumark-Sztainer, Hannan and Story6–Reference French, Perry and Leon9), while the current study examined food patterns. While reported food intake between dieters and non-dieters did not differ in the present study, behaviours associated with food choice and meal frequency were different. Significant associations were found between dieting and lunch and evening meal frequency, but not breakfast consumption during the week. This relationship may be because adolescents have autonomy over their lunch choices. NZ schools do not provide meals, although food items are usually available for purchase at tuck shops/canteens, a situation similar to Australia and Denmark, and students are allowed to leave the school to buy their lunch. Our findings are supported by the 2002 New Zealand Children's Nutrition Survey, which found that older children were less likely than younger children to usually eat at lunchtime(Reference Parnell, Scragg and Wilson25). The relationship between both lunch and evening meal frequency and dieting may possibly also be related to activity. A recent NZ survey showed that about 60 % of boys and 50 % of girls were members of a sports club(26). It is possible that the dieters are busy playing sport during lunch and in the evenings at the expense of a meal, yet adjustment for activity had no real effect on any of the tested relationships. The lack of an association between the food patterns and dieters and non-dieters could also be due to a reporting bias by the dieters. For example, previous research has found that adolescents who are concerned about their weight are more likely to under-report certain foods(Reference Ventura, Loken and Mitchell27).
It is also possible that the meal frequency relationships may be an artefact of the question. The questions about meal frequency defined a meal as ‘more than a drink’, but it could be possible that adolescent dieters may eat many small snacks throughout the day, rather than the traditional three meals per day(Reference Moreno, Rodriguez and Fleta28). Even though there was no relationship between dieting and breakfast frequency, it was possible that students were consuming a beverage product, such as those advertised as ‘breakfast in a liquid form’, or other high-energy or sugary drinks. The lack of a significant relationship might be related to the sample demographics. Previous findings in NZ adolescents found that breakfast consumption was related to ethnicity, with Maori and Pacific Island children consuming breakfast less frequently than New Zealand European and Others (NZEO)(Reference Utter, Scragg and Mhurchu29). The current study could not examine ethnic differences due to the lack of ethnic diversity; however future work could investigate this further. The results could also be due to breakfast being consumed at home, where the adolescent may have less autonomy over what is available or is subject to parental pressure. The results could also be reflective of the age group, with previous research suggesting that younger adolescents consume breakfast more often than older adolescents(15, Reference Parnell, Scragg and Wilson25).
Healthiness of food was an important factor in food choice for dieters in the present study. Previous studies reported that dieters are generally more aware of foods and their perceived healthiness(Reference Lattimore and Halford11). The finding that dieters had a lower score for liking sweet foods, possibly due to their perceived ‘unhealthiness’, may also support this idea. It has been suggested that some liking scores are derived from questions that may not differentiate between liking (e.g. taste), preference (e.g. health consideration) or desire (e.g. wanting)(Reference Mela30). As such our results may just indicate that those on a diet have less of a preference or desire for sweet foods, rather than reduced liking. The relationship between beliefs and behaviour may not be explained by a simple cause-and-effect relationship and the true relationship is likely more complex. One of the behavioural theories underpinning the present study is Social Cognitive Theory. Social Cognitive Theory constructs include outcome expectations, which could support the idea that dieters are expected to have less of a preference or desire for sweet foods. Other constructs such as liking and taste preference have been found to be related to intake in children and adolescents. For example, with fruit and vegetable intake, those reporting liking or increased taste preferences for fruit and vegetables consume more fruits and vegetables(Reference De Bourdeaudhuij, te Velde and Brug31). However, it may be that the reduced preference or desire for sweet foods by dieters is adopted to justify the behaviour, with previous work suggesting ‘a psychology of dieting’ whereby food choice is made to achieve the goal of becoming thinner(Reference Contento, Michela and Williams32).
There were several limitations to the present study. First, due to the cross-sectional design of the study we can only determine associations not causality. Second, BMI was calculated from self-reported heights and weights, although previous studies suggest that these data are acceptable for assessing prevalence of overweight and obesity in this age group(Reference Fonseca, Silva and Matos33). Nevertheless, the BMI results are comparable with those from NZ national surveys(15, Reference Parnell, Scragg and Wilson25) in which height and weight were measured. The slightly lower rates of overweight and obesity may be due to the higher proportion of NZEO participants in the present study compared with the population as a whole, which is characteristic of the South Island of NZ. Rates of overweight and obesity were lower than in the Youth '07 survey which found that about 20 % were overweight and 10 % were obese(26). However, the higher proportion of overweight and obesity in the Youth '07 study compared with the current study may be due to the fact that the majority of participants in the Youth '07 survey were from the North Island of NZ, which has a significantly different ethnic makeup from the South Island.
Third, the inability to find significant associations in the present study may have been because of a lack of power as only a small proportion of the cohort was currently dieting. The lack of a difference between sexes, or the lack of significant results for girls, may also have been due to the size of the cohort. Fourth, all dietary assessment methods, including FFQ, have limitations. For example, the FFQ relies on the participant's ability to recall foods eaten. As is the case with most FFQ, the FFQ used in the present study overestimated absolute food intakes but showed good ability to rank individuals(Reference Vereecken and Maes19). Therefore this FFQ is suitable to examine relative intakes between participants, as is the case in the present study. This FFQ has been found to have reasonable validity in a similar population to the current study (JE Wong, PML Skidmore, WR Parnell et al., unpublished results). This particular FFQ contains a limited number of food items as it was originally designed to investigate intakes of foods high in fibre and calcium and to include only food items most commonly consumed in this age group(Reference Vereecken and Maes19). As such major food groups covered included fruits, vegetables, milks, breads and treat foods (e.g. sweets, chocolates, crisps, soft drinks and hot chips or French fries). The latter may be indicative of fast food intake. However, meat intake was not assessed, which has been shown to be restricted by dieters in some research(Reference Neumark-Sztainer, Rock and Thornquist4, Reference Larson, Neumark-Sztainer and Story8). It is possible that the limited number of food items included in the FFQ may have led to the lack of an association in the current study, but the use of dietary patterns allows for a measure of the diet as a whole. The FFQ is an appropriate and commonly used method for obtaining dietary pattern data in these types of large studies and the questionnaire used in the present study has been well validated and used extensively in similar countries(Reference Currie, Hurrelmann and Settertobulte3, Reference Vereecken and Maes19). Finally, while the cohort was not nationally representative with regard to the ethnic diversity of NZ, it is representative of the Otago region(34) and is also representative of the South Island of NZ.
There have been only a few published studies investigating dieting in NZ adolescents(15). One survey found that 30 % of 10- to 14-year-olds and just under 35 % of 15- to 19-year-olds in NZ reported that they had tried to lose weight in the past 12 months(15). However, data were not collected on those who were currently trying to lose weight. We collected information on whether students were currently doing something to lose weight; a question taken from the HBSC survey. Our study results are comparable to HBSC results from Ireland, Finland, Sweden and the Netherlands(Reference Currie, Hurrelmann and Settertobulte3).
Important strengths of the current study are: the use of previously validated and pilot-tested instruments to measure selected food intake and behaviours; the large representative sample from the Otago region; and the high participation rate, with 57 % of all students in Otago being invited to take part and 99 % of invited students agreeing to take part in the study. The use of dietary patterns allowed for an investigation of the overall diet rather than only selected components. While there were no significant findings for the dietary Fruit and Vegetable pattern, it was assessed in quintiles, which allowed for comparison between high and low intakes.
Conclusion
In this cohort where there was no difference in actual food consumption between dieters and non-dieters, there were significant differences in attitudes to food. This highlights the necessity for further exploration of attitudes towards food in relation to dieting, in order to understand the significance of these attitudes so that any future health education can be targeted.
Acknowledgements
The OSSLS was funded by the University of Otago, Dunedin City Council and Otago Regional Council. The authors have no conflicts of interest. P.M.L.S. and S.M. were the principal investigators of the OSSLS and were responsible for the study conception, study design, setup, data collection and processing. A.S.H. conceived the initial idea for this paper. A.S.H. and P.M.L.S. managed the data and performed the statistical analysis. A.S.H. performed relevant literature searches and drafted the initial manuscript. All authors provided critical review and feedback. The authors thank all those who participated in the OSSLS and the Sport and Recreation New Zealand and Otago Secondary Schools Sports Association for their assistance. The authors also thank the SPEEDY and HBSC investigators for the use of material and Associate Professor Sheila Williams from the Department of Preventive & Social Medicine for her invaluable statistical advice.


