


FFQ are a feasible and cost-effective method of collecting dietary data in large-scale epidemiological research( Reference Willett 1 , Reference Willett 2 ). The Scottish Collaborative Group (SCG) FFQ (version 6.6) is a self-administered, 169-item, semi-quantitative FFQ originally developed from the FFQ used in the Scottish Heart Health Study and the Monitoring Trends and Determinants in Cardiovascular Disease (MONICA) study( Reference Smith, Crombie and Tavendale 3 ). The SCG FFQ has been continuously modified and updated for use in large-scale epidemiological studies( Reference Allan, Prabhu and Craig 4 , Reference Theodoratou, Farrington and Tenesa 5 ). A previous validation of the SCG FFQ (version 6.31)( Reference Masson, McNeill and Tomany 6 ) with 4 d weighed food records in forty-one men and forty women from North East Scotland in 2003 showed significantly higher intakes of energy and macronutrients as assessed by the FFQ but no significant differences in macronutrient intakes expressed as a percentage of energy. Spearman’s correlation coefficients were greater than 0·5 for energy-adjusted saturated fat, alcohol and NSP, as well as for many, though not all, micronutrients( Reference Masson, McNeill and Tomany 6 ).
Refining the collection of dietary data through FFQ will provide more accurate estimates of dietary intake that can enhance our understanding of food and nutrients in the aetiology and prevention of disease( Reference Subar, Thompson and Kipnis 7 ). Since the SCG FFQ was first developed in 1993, the food composition and portion size data have been modified to reflect changes in the diet of the UK population. Since the previously validated SCG FFQ, numerous food items have been added and other items removed (see online supplementary material, Supplemental Table 1). Subtle changes in the design of an FFQ can affect the questionnaire’s performance; therefore it is essential to assess the validity of the revised FFQ( Reference Willett 1 ). As the degree to which data from one validation study can be generalised to other populations is unknown, repeating validation studies in different populations is important( Reference Willett 1 ). The aim of the present study was to assess the current relative validity of the SCG FFQ (version 6.6) in healthy, free-living adults across Scotland.
Methods
The present study was carried out using data from an existing study conducted between September 2013 and June 2014. Participants were recruited from the 2010 Scottish Health Survey (SHeS) sample. The SHeS assesses a nationally representative sample of the general population living in Scottish households. In 2010, 8473 adults were randomly selected to participate in the SHeS using postcode address files (response rate=55 %)( 8 ). The SHeS team provided names and addresses of 1600 SHeS participants (800 male, 800 female) who had consented to be contacted for follow-up research; were aged 18–65 years old; and had complete data for sex, age, height, weight and Scottish Index of Multiple Deprivation. An invitation letter, a consent form and a freepost return envelope were mailed to potential participants.
Measures
Participants completed the SCG FFQ followed by a 7 d non-weighed food diary. Dietary data from the study were linked with data collected during the 2010 SHeS including demographic characteristics (e.g. age, sex), height, weight and BMI. Data entry was double checked to maximise accuracy. BMR was calculated using the Henry equations( Reference Henry 9 ) to assess reported energy intake relative to estimated energy requirements.
The SCG FFQ (version 6.6)( 10 ) assessed each participant’s habitual diet over the preceding 2–3 months. Participants completed the paper-based questionnaire and were asked to return the SCG FFQ in a freepost envelope within 1 week. FFQ were checked for missing or unclear responses. Participants with ten or more missing responses were telephoned to provide missing information and FFQ with ten or more missing responses after telephone contact attempts were excluded. Responses were entered using a purpose-built, web-based, data-entry system. FFQ data were analysed using the UK food composition tables( 11 ).
Participants completed the 7 d non-weighed food diary over consecutive days. The food diary and a freepost return envelope were mailed to participants following receipt of the FFQ. The diaries contained photographs of standard portion sizes to assist participants describe the amount of foods and beverages consumed (including foods prepared at home)( Reference Nelson, Atkinson and Meyer 12 ). Participants could also report weights from packaged foods if appropriate. Participants were asked to provide brand names of commercial products and to identify if ‘low-fat’, ‘low sugar’, ‘low calorie’ or ‘diet’ products were used, which aided with identifying the correct food item (or closest substitute) in the food composition tables. Foods that were prepared from ingredients were analysed using representative recipes from the food composition tables or from Internet sources. Food diary data were analysed with WISP 4.0 (Tinuviel Software, 2013) using the UK food composition tables (McCance and Widdowson’s The Composition of Foods, 6th edition, 2002)( 11 ).
Statistical analysis
Data were analysed using the statistical software package IBM SPSS Statistics Version 22.0. The crude medians (interquartile ranges) were reported, and relative differences between the FFQ and food diary for each nutrient were calculated. Intakes from the FFQ were compared with intakes from the food diary for energy, percentage of energy from macronutrients, macronutrients and sixteen micronutrients. Energy-adjusted nutrient values were used to control for energy intake, as recommended for investigating diet–disease relationships( Reference Poslusna, Ruprich and de Vries 13 ). Energy-adjusted intakes were calculated by adding the mean nutrient intake to the residual from the linear regression model. Participants who reported FFQ energy intakes at the highest and lowest 2·5 % of the sample were excluded, in line with the current SCG FFQ standard operating procedures.
Three statistical methods were used to assess relative validity: (i) Spearman rank correlation coefficient and 95 % CI were used to examine the correlation between the SCG FFQ and the food diary; (ii) the percentage of participants classified into the same and opposite thirds of intake and Cohen’s weighted kappa statistic (κ w) were used to assess agreement in ranking into thirds; and (iii) Bland–Altman analysis was used to assess the mean difference and 95 % limits of agreement between the SCG FFQ and food diary( Reference Bland and Altman 14 ).
Results
One hundred and fifty individuals agreed to participate in the study (response rate=9 %). A total of 101 participants completed the study (67 %; forty-nine participants failed to complete both the SCG FFQ and the food diary) and ninety-six participants (fifty-six females) were included in the analysis (lowest and highest 2·5 % of the sample were removed). Eleven participants were re-contacted as more than ten questions had been missed on the FFQ. The final sample had a mean age of 51·4 (sd 11·1) years and mean BMI of 27·1 (sd 4·9) kg/m2 (Table 1). The median (interquartile range) energy and nutrient intakes calculated from the FFQ and food diary are reported in Table 2. One per cent and 35 % of the participants reported an energy intake lower than their estimated BMR, as measured by the SCG FFQ and food diary, respectively.
Table 1 Demographic characteristics of the study participants: healthy adults aged 18–65 years living in Scotland, September 2013–June 2014
SIMD, Scottish Index of Multiple Deprivation.
* BMI was calculated based on weight and height measurements taken at the time of the 2010 Scottish Health Survey.
Table 2 Median daily energy and nutrient intakes, and relative differences in intake, between the Scottish Collaborative Group (SCG) FFQ (version 6.6) and a 7 d, non-weighed food diary in healthy adults aged 18–65 years living in Scotland (forty men and fifty-six women), September 2013–June 2014
P25, 25th percentile; P75, 75th percentile; CHO, carbohydrates.
Relative difference=[(FFQ – food diary)/food diary] × 100.
Relative agreement for energy and energy-adjusted nutrient intakes
Correlation coefficients ranged between 0·21 for retinol and 0·71 for Mg (Table 3). All macronutrients expressed as a percentage of energy had a correlation coefficient above 0·5. Correlation coefficients were above 0·5 for energy-adjusted saturated fat, carbohydrates, sugar, starch, NSP, alcohol, riboflavin, vitamin B6, vitamin C, niacin equivalents, Mg and K. Correlations were lowest for thiamin and retinol at less than 0·3. At least 50 % of participants were correctly classified into the same third of intake for twenty-one of the thirty-one nutrients. For all nutrients, a median of 52 % of adults were correctly classified, ranging from 42 % for PUFA, MUFA and Fe to 64 % for percentage of energy from carbohydrates. Ten per cent or more of participants were grossly misclassified into the opposite third of intake for eleven nutrients. The median percentage of participants who were grossly misclassified was 8 %, ranging from 3 % for carbohydrates and percentage of energy from carbohydrates to 19 % grossly misclassified for thiamin. The κ w values ranged from 0·20 (PUFA, β-carotene) to 0·55 (percentage of energy from carbohydrates). Values of κ w were above 0·4 (indicating moderate agreement) for ten of the thirty-one nutrients. The mean agreement and 95 % limits of agreement for intake by the two methods are shown for each nutrient in Table 4. The smallest limits of agreement, when expressed as a percentage of the mean intake from the FFQ and food diary, were seen for the main macronutrients carbohydrates, fat and protein. Bland–Altman plots to assess relative agreement for percentage of energy from protein, fat and carbohydrates showed good agreement (Fig. 1).
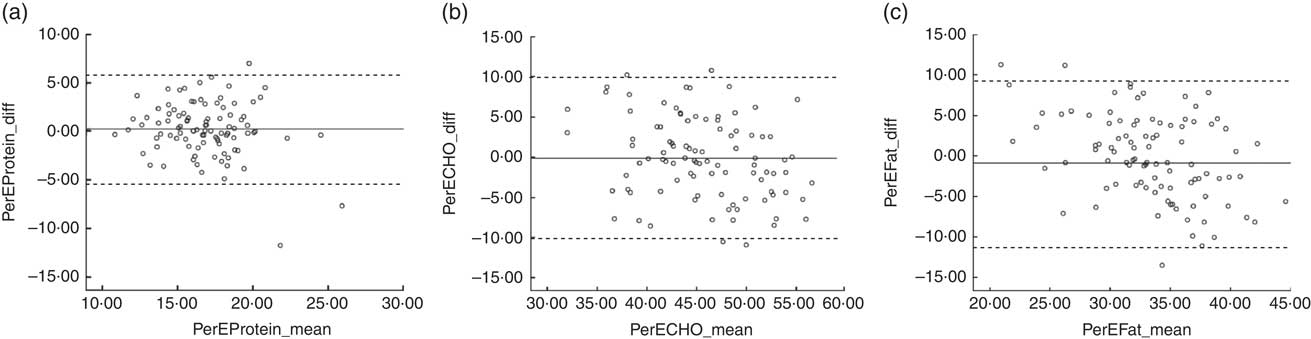
Fig. 1 Bland–Altman plots to assess the relative agreement for (a) percentage of energy from protein, (b) percentage of energy from carbohydrates and (c) percentage of energy from fat between the Scottish Collaborative Group (SCG) FFQ (version 6.6) and a 7 d, non-weighed food diary in healthy adults aged 18–65 years living in Scotland (forty men and fifty-six women), September 2013–June 2014. The difference in percentage of energy (PerE_diff) between the SCG FFQ and the food diary is plotted v. the mean percentage of energy from the two methods (PerE_mean), where —— represents the mean difference (bias) and – – – – – represent the limits of agreement (CHO, carbohydrates)
Table 3 Spearman correlation coefficients (r s), percentages of participants classified into the same and opposite thirds of intake, and weighted kappa (κ w) values between the Scottish Collaborative Group FFQ (version 6.6) and a 7 d, non-weighed food diary, for energy, percentage of energy from macronutrients and energy-adjusted nutrient intakes, in healthy, adults aged 18–65 years living in Scotland (forty men and fifty-six women), September 2013–June 2014
CHO, carbohydrates.
κ w>0·60 indicates good agreement, κ w=0·41–0·60 indicates moderate agreement, κ w=0·21–0·40 indicates fair agreement and κ w≤0·20 indicates poor agreement( Reference Altman 20 ).
Table 4 Bland–Altman calculations of mean difference between the Scottish Collaborative Group FFQ (version 6.6) and a 7 d, non-weighed food diary, and limits of agreement, for energy, percentage of energy from macronutrients and energy-adjusted nutrient intakes, in healthy, adults aged 18–65 years living in Scotland (forty men and fifty-six women), September 2013–June 2014
CHO, carbohydrates.
The median (interquartile range) energy and nutrient intakes calculated from the FFQ and food diary are reported by sex in the online supplementary material, Supplemental Table 2; and the relative agreement between the SCG FFQ and food diary is reported separately by sex in Supplemental Table 3 (Spearman correlation coefficients, percentages of classification into the same and opposite thirds of intake, κ w) and Supplemental Table 4 (Bland–Altman mean agreement and 95 % limits of agreement). The results show that although validation findings were consistent across many nutrients (e.g. percentage of energy from carbohydrates, carbohydrates, NSP, Mg, K) there were some differences according to sex. For example, measurement of percentage of energy from fat, starch, alcohol and niacin equivalents was superior in women; and SFA, PUFA, MUFA, sugars and vitamin B6 were superior in men. Bland–Altman plots to assess relative agreement for percentage of energy from protein, fat and carbohydrates showed good agreement for both sexes (Supplemental Figs 1 and 2).
Discussion
The present study aimed to assess the relative validity of the SCG FFQ (version 6.6) in healthy, free-living adults aged 18–65 years. While the study showed higher intakes of energy and macronutrients by the FFQ, macronutrient intakes expressed as a percentage of energy between the FFQ and food diary were highly correlated. These findings were similar to the previous SCG FFQ validation study( Reference Masson, McNeill and Tomany 6 ) (see online supplementary material, Supplemental Table 5) and other validation studies in adults( Reference Boucher, Cotterchio and Kreiger 15 , Reference Lassale, Guilbert and Keogh 16 ). It has been suggested that correlation coefficients >0·5, >50 % of participants correctly classified and <10 % of participants grossly misclassified into the appropriate third of intake, and κ w values >0·4 are desirable if the possibility of false-negative associations between diet and disease in epidemiological studies is to be minimised( Reference Masson, McNeill and Tomany 6 ). Based on these criteria, percentage of energy from protein and carbohydrates, and energy-adjusted carbohydrates, sugars, NSP, alcohol, vitamin B6, vitamin C, Mg and K could be assessed with equal validity using the SCG FFQ or a 7 d unweighed food diary method.
Comparing the previous SCG FFQ( Reference Masson, McNeill and Tomany 6 ) and the current validation study (and using the above mentioned criteria) there were similar results for NSP, alcohol, Mg and K. The curent study showed greater validity for percentage of energy from protein and carbohydrates, and energy-adjusted carbohydrates, sugars, vitamin B6 and vitamin C, but slightly lower validity for Fe. Correlation coefficients for thiamin and retinol were low and had poorer agreement. This was relatively consistent with findings from the previous validation study( Reference Masson, McNeill and Tomany 6 ). The poor agreement for retinol may reflect the fact that retinol is found in high concentration in infrequently eaten products (e.g. liver/liver products), so habitual intake at the individual level is not measured so well by short-term recording methods such as diaries. This could also be an explanation for the lower correlation coefficients for thiamin, which is found in high concentration in yeast extract. In future studies, multiple food diaries may be needed to assess habitual intake of nutrients with large day-to-day variation within individuals( Reference Henriquez-Sanchez, Sanchez-Villegas and Doreste-Alonso 17 ).
The present paper reports the updated validation results of the SCG FFQ, 10 years after the previous validation study was published( Reference Masson, McNeill and Tomany 6 ), and in a wider population. Multiple statistical approaches have been used to examine the performance of the SCG FFQ against unweighed food records because there is no single superior method for relating a proxy measure to the reference measure, and future epidemiological studies that use the SCG FFQ will require the FFQ to be validated in the nutrients of interest through different methods (i.e. continuous or categorical data) depending on the study methods( Reference Willett 1 , Reference Masson, McNeill and Tomany 6 ). The residual method of energy adjustment was used as it has been recommended for validating nutrients used to investigate diet–disease relationships( Reference Poslusna, Ruprich and de Vries 13 ). Sex-specific validation values should be taken into account for single-sex studies.
The limitations of the present study need to be acknowledged. Food diaries, as with all dietary assessment measures, rely on self-reported data and could be influenced by participant misreporting or a social desirability bias( Reference van de Mortel 18 , Reference Winkler 19 ). A postal estimated weighed food diary (used as the reference method) without an interview may be considered less of a ‘gold standard’ than a weighed food diary, or a food diary with an interview, to check details and enable estimation of portion size. We could not estimate intake of free sugars as this was not available in the UK nutrient composition database. Multiple comparisons may be an issue due to the number of statistical tests and range of variables examined. The participants were recruited from the SHeS sample in an attempt to obtain a representative sample of the population. However, a 9 % response rate from a group who had agreed to be contacted for future health-related research will likely be a highly selected sample, and may be more educated and motivated to complete the assessment methods than those who would be recruited to an epidemiological study.
Conclusion
As in the previous validation study in 2003, the SCG FFQ gave higher estimates of energy and most nutrients than the food diary, but after adjustment for energy intake the SCG FFQ could be used in place of non-weighed food diaries to estimate percentage of energy from protein and carbohydrates, and energy-adjusted carbohydrates, sugars, NSP, alcohol, vitamin B6, vitamin C, Mg and K, in large-scale epidemiological studies but should be used with caution for other nutrients. The similarity of results over 10 years provides reassurance that performance over time remains relatively stable.
Acknowledgements
Acknowledgements: The authors would like to thank Jacqueline Burr and Lindsey Shaw for collecting the data for this study. Data coding and entry for the food diaries was completed by Dr Lindsey Masson. The authors would also like to acknowledge the Scottish Health Survey Team, the Scottish Government and the National Centre for Social Research for their support in conducting this research. Financial support: This work was supported by funding from the Rural and Environment Science and Analytical Services Division (RESAS) programme of the Scottish Government (J.L.H., L.C.A.C., S.W. and G.Mc.N.). The RESAS programme had no role in the design, analysis or writing of this article. Conflict of interest: None. Authorship: J.L.H., L.C.A.C., S.W. and G.Mc.N. were responsible for the design of the study and formulated the research question. L.C.A.C. and S.W. carried out the study. J.L.H. completed the literature review, conducted the statistical analysis and drafted the initial paper. All authors were responsible for drafting and revising the manuscript and have approved the final version. Ethics of human subject participation: This study was conducted according to the guidelines laid down in the Declaration of Helsinki and all procedures involving human subjects were approved by the Rowett Human Studies Ethical Review Panel. Written informed consent was obtained from all participants.
Supplementary Material
To view supplementary material for this article, please visit http://dx.doi.org/10.1017/S1368980016002421


