


To date, there is a dearth of data on anthropometric characteristics of children living in food-insecure households in developed countries. We provide some of such data from a pre-pandemic era to aid future comparison. Food insecurity, characterised by limited access to enough food for an active healthy life, has been associated with impaired child growth in previous studies(Reference Coleman-Jensen, Rabbitt and Gregory1–Reference Shamah-Levy, Mundo-Rosas and Morales-Ruan3). In the USA, about 7·1 % of households with children (26·1 million adults and 11·2 million children) were food insecure in 2018 which shows a decline from the 9·9 % (33·3 million adults and 15·8 million children) reported in 2013(Reference Coleman-Jensen, Rabbitt and Gregory1).
Food-insecure children experience malnutrition which can result in minor or major physical growth faltering depending on the severity of food deficits. Before birth, undernutrition can result in intrauterine growth retardation which can cause small-for-gestation age or low birth weight (LBW). Undernutrition among children presents as growth failure, underweight, wasting and stunting(Reference Thomas, Miller and Morrissey2–Reference Olson, Bove and Miller7). Traits of food-insecure children mirror those of undernourished children including aggression, anxiety, attention deficit, depression, irritability, food allergy, frequent hospitalisation, learning disability and nutrients deficiencies(Reference Gundersen and Ziliak4, Reference Lee, Scharf and Filipp8–Reference Duncan, Brooks-Gunn and Klebanov15). Neonates who experienced intrauterine growth retardation or small-for-gestation age undergo catch-up growth which is associated with rapid accretion of body fat mass, body girth and visceral fat mass(16–Reference Wlodek, Westcokk and Siebel20). They may experience changes in body composition and phenotype usually associated with incapacity and disease later in life(Reference Calkins and Devaskar17,Reference Seligman, Jacobs and López21–Reference Reaven26) . Diseases such as anaemia, arthritis, asthma, cancer, coronary artery disease, dyslipidaemia, food allergy, hypertension, obesity, osteoporosis and type 2 diabetes mellitus are reported possible sequelae of food insecurity(Reference Thomas, Miller and Morrissey2–Reference Gundersen and Ziliak4,Reference Calkins and Devaskar17,Reference Wlodek, Westcokk and Siebel20–Reference Seligman, Laraia and Kushel22,Reference Reaven26,Reference Tayie and Zizza27) .
Even though the clinical symptoms of undernutrition in developing countries are often overt because of elevated severity, these symptoms are often covert in developed countries(Reference Thomas, Miller and Morrissey2,Reference Schmeer and Piperata28) . The large number of food-insecure children in the USA warrants analysis of its associations with childhood physical growth faltering because of its largely indiscernible but damaging health effects(Reference Gundersen and Ziliak4,Reference Calkins and Devaskar17,Reference Seligman, Laraia and Kushel22,Reference Freedman, Mei and Srinivasan24,Reference Reilly, Methven and McDowell25,Reference Schmeer and Piperata28) .
By virtue of the rapid growth of children, physical growth deficits can be detected using established anthropometric standards(Reference Psaki, Bhutta and Ahmed5,29–33) . Anthropometric indices that are typically used to assess physical growth in children include: (1) body weight-for-age (for assessing underweight), (2) body weight-for-height (for wasting, overweight and obesity), (3) height-for-age (for stunting), (4) mid-upper arm circumference (MUAC) (for wasting and overweight), (5) BMI-for-age percentiles (for underweight, overweight and obesity), (6) head circumference (for brain growth) and (7) chest:head circumference ratio (for general growth failure)(Reference Thomas, Miller and Morrissey2,Reference Shamah-Levy, Mundo-Rosas and Morales-Ruan3,Reference Psaki, Bhutta and Ahmed5,29,Reference Fryar, Gu and Ogden31,Reference Wankhede, Bhandari and Jain34) . Common surrogates for estimating height are upper arm length and leg length(Reference Wankhede, Bhandari and Jain34–36).
The National Center for Health Statistics of the Centers for Disease Control and Prevention has established anthropometric standards for US children, whereas the WHO has done the same for children globally(Reference Fryar, Gu and Ogden31,33) . The availability of anthropometric standards applying Z-scores and percentile cut-offs, as well as rapid assessment tools, has enabled inexpensive assessment of malnutrition in children and adults(Reference Fryar, Gu and Ogden31,33) . In this study, we examine anthropometric data of children living in food-insecure households to determine whether the extent of food insecurity experienced in the USA associates with malnutrition. Knowledge of the critical ages where food insecurity has the most profound influence is useful to child nutrition programmes.
Methods
Data sources and participants
Data for this study were from the continuous US National Health and Nutrition Examination Survey (NHANES) 2011–2014(37). The final composite data set comprised 4121 children, specifically 2110 boys and 2011 girls, aged 7 years or younger. Children in this age range were included in the study to obtain adequate span of age range for analysis while obviating confounding by the growth spurt of adolescence. Inclusion criteria were availability of data on age, anthropometry, gender, household food security status and race/ethnicity. The food-insecure children lived in households whose poverty:income ratio, a ratio of household income to the federal poverty threshold provided by the United States Bureau of the Census, was <1·0.
In this study, protocols involving human subjects were approved by the Ethics Review Board of the National Center for Health Statistics, Centers for Disease Control and Prevention (Protocol Nos. 2011-17)(38). Written parental consent and child assent were obtained from all participating households(38). The NHANES data sets analysed for the present study had been de-identified and released for public use(38).
Food security status and categories
During the NHANES 2011–2014, a nationally representative sample of about 45 000 households were surveyed. Based on responses to the ten-item child food security survey module of the US Census Bureau’s Current Population Survey, children in the participating households were assigned to one of four food security categories: (1) food secure, (2) marginal food security, (3) low food security and (4) very low food security which are the categories used in this study(Reference Coleman-Jensen, Rabbitt and Gregory1). Food-secure children were from households that reported no indications of food access issues or food limitations. Those in the marginal food security category had one or two reported indications, typically of anxiety over food sufficiency or anxiety over food shortage with little or no indication of adverse changes in diets or food intake. Those in the low food security category reported reduced quality, variety or desirability of diet, but not reduced quantity of food intake. Participants in very low food security reported multiple indications of disrupted eating patterns, reduced quality, variety, desirability of diet and food intake(Reference Coleman-Jensen, Rabbitt and Gregory1).
Anthropometric data
Available child anthropometric data analysed for this study were birth weight, body length, BMI, height, weight, head circumference, MUAC and upper arm length(37). The anthropometric measurements were done by trained technicians who followed the NHANES Mobile Examination Centers’ approved protocols(36). Measurements were linked to an integrated survey information system which enabled flawless data transmission and storage(36). For more than three decades, the NHANES anthropometric data sets have been used to assess physical growth and body weight of the US civilian population(36,Reference Flegal, Carroll and Ogden39,Reference Hedley, Ogden and Johnson40) . The detailed procedures for the anthropometric measurements are provided in chapter 3 of the anthropometric procedures manual, published elsewhere(36).
Data analysis strategy
We applied a two-pronged approach to ascertain associations between child malnutrition and food security status. In the first approach, we used linear regression models to test whether significant differences in growth rates of children exist between food security categories. Because certain anthropometric indices are unreliable in young children, and not all are applicable to older children, the NHANES anthropometric data tend to be age-dependent. For instance, birth weight is measured shortly after birth, body length is measured up to 2 years, height from 2 years and older, BMI from 2 years and older, head circumference is up to 1 year and MUAC from 2 months and older(29–Reference Fryar, Gu and Ogden31,33,Reference Cattermole, Leung and Mak41,Reference Barlow42) . Consequently, some of the analyses were restricted to applicable age-dependent data.
In the second approach, Z-scores of applicable anthropometric indices were computed based on the Centers for Disease Control and Prevention/National Center for Health Statistics child growth standards for US children(Reference Psaki, Bhutta and Ahmed5,29,Reference Fryar, Gu and Ogden31,33,Reference Nascimento, Machado and Bertoli43) . Prevalence of malnutrition was determined based on Z-scores. The Anthro-for-PC software for survey anthropometric data analysis version 3.2.2 (WHO, 20 Avenue Appia, 1211 Geneva 27, Switzerland) was used to calculate Z-scores for all children aged < 6 years. Z-scores calculated included weight-for-age – for assessing underweight, height-for-age – for assessing stunting and weight-for-height – for assessing wasting, overweight or obesity(Reference Fryar, Gu and Ogden31,33) . Moderate underweight, stunting and wasting were defined as a Z-score ≤ –2 sd, whereas severe forms were defined as a Z-score ≤ –3 sd of the Centers for Disease Control and Prevention/National Center for Health Statistics growth standards(Reference Psaki, Bhutta and Ahmed5,29,Reference Fryar, Gu and Ogden31,33,44) . Overweight was defined as a Z-score ≥ +2 sd, whereas severe overweight (obesity) was defined as Z-score ≥ +3 sd (29–33). We applied anthropometric cut-offs of BMI and MUAC to calculate likelihood ratios for wasting, overweight and obesity using multinomial logistic regression analyses. The MUAC clinical cut-offs applied were: severely underweight or wasted (MUAC < 11·5 cm) and moderately underweight (MUAC < 12·5 cm)(29,Reference Jeyakumar, Ghugre and Gadhave32,33) . A BMI-for-age value greater than the 95th percentile was categorised as obese (severe overweight)(Reference Lee, Scharf and Filipp8,29–Reference Fryar, Gu and Ogden31,33,Reference Barlow42,45) . Participants with birth weight < 2·5 kg were deemed LBW(29,Reference Louer, Simon and Switkowski30,33) .
The NHANES uses complex multistage probability cluster sampling design to select households that together are representative of the state-level and national-level non-institutionalised US civilian population(Reference Coleman-Jensen, Rabbitt and Gregory1). In conformity with this design, Mobile Examination Centers sampling weights assigned to participants were applied in the analyses. To enable application of Mobile Examination Centers sampling weights, the STATA 14.2 statistical software (STATA Corporation, College Station, Texas) was used for analysis(46). The NHANES 2011–2014 consists of two waves, 2011–2012 and 2013–2014; therefore, the Mobile Examination Centers sample weights were halved and applied during analyses(Reference Lee, Scharf and Filipp8,46) . To improve sample size and hence sensitivity, the low and very low food security categories were combined into one category as food insecure(Reference Lee, Scharf and Filipp8).
The following age groups were used to coincide with some life stages of children: <6 months (infants), 6 months–1 year (weaners), 2–3 years, 4–5 years (school entry) and 6–7 years (schoolers)(Reference Nguyen, Ford and Yaroch47). Within each age group, the applicable anthropometric indices of food-insecure children were compared with their food-secure counterparts. Initially, descriptive statistics were calculated for each anthropometric measure stratified by age group and food security category. Proportions that were below or above clinical cut-offs were compared using Pearson’s χ 2 test of independence and multinomial logistic regression analysis. Multiple linear regression analysis was used to examine continuous data. In the regression analyses, statistically significant differences in the continuous variables between food security categories were tested using the design-based Student’s t test components. During the regression analysis, race/ethnicity and sex were controlled as potential confounders(Reference Lee, Scharf and Filipp8,Reference Nguyen, Ford and Yaroch47,Reference Casey, Simpson and Gossett48) . The food-secure children were treated as the referent, food security status as the independent variable and the anthropometric measures as the outcome variables. In all analyses, statistical significance was tested at P < 0·05.
Results
Among the 4121 children meeting inclusion criteria, 65·3 %, 13·7 % and 21·0 % were in the food secure, marginal food security and food-insecure categories, respectively, due to oversampling during the NHANES(Reference Lee, Scharf and Filipp8,Reference Das, Saimala and Reddy49) . Table 1 shows characteristics of the participants. In general, some of them were overweight (4·0 %) or obese (2·6 %). The prevalence of obesity among food-insecure children (6·9 %) was significantly higher than among their food-secure counterparts (2·8 %) (P = 0·003). In general, some of the children were moderately underweight (0·5 %), moderately wasted (0·6 %) or moderately stunted (0·4 %) (Fig. 1).
Table 1 Background characteristics of children aged <1 month to 7 years by food security status

* NHANES sampling weights were applied during the analyses.
† White includes multiracial and small racial groups.
‡ se is standard error linearised per Taylor series linearisation.
§ Income was expressed as poverty:income ratio (PIR) provided by the US’ Bureau of the Census.

Fig. 1 Percentage of participants that fall in various categories of malnutrition by food security category. ![]() , Food secure;
, Food secure; ![]() , Marginal;
, Marginal; ![]() , Food insecure
, Food insecure
The anthropometric values of the children show noticeable differences indicative of malnutrition (Table 2). Food insecurity among those aged 6 months–1 year was associated with significantly less body weight (P = 0·009), body length (–1·7 cm, P = 0·007) and upper arm length (P = 0·010) compared with their food-secure counterparts (Table 2). Food-insecure children younger than 6 months had significantly shorter upper arm length (P = 0·018) and smaller MUAC (P = 0·006) (Table 3). The difference remained significant after adjusting for covariates (Table 4). However, these deficits in the anthropometric values disappeared by age 3 years, and by age 6 years, food-insecure children had amassed greater BMI and arm circumference than their food-secure counterparts. Among the marginal food security category, children aged 2–3 years had significantly greater body weight (P = 0·001), height (P = 0·028), BMI (P = 0·001) and MUAC (P = 0·001) than their food-secure counterparts.
Table 2 Anthropometric values of children by food security status

† The food secure category was the referent.
‡ se is linearised standard error per Taylor series linearisation. Mean values are weighted per the NHANES sampling weights.
§ Anthropometric indices not showing all five age groups are age-specific.
* Significantly different from the food-secure category, P < 0·05.
Table 3 Body girth indices of children by food security status

† The food secure category was the referent.
‡ se is linearised standard error per Taylor series linearization. Means values are weighted per the NHANES sampling weights.
§ Anthropometric indices not showing all five age groups are age-specific.
|| MUAC is mid-upper arm circumference, assessed from age 2 months and older.
* Significantly different from the food-secure category, P < 0·05.
Table 4 Difference, prevalence and likelihood to have abnormal anthropometric measures by food security status
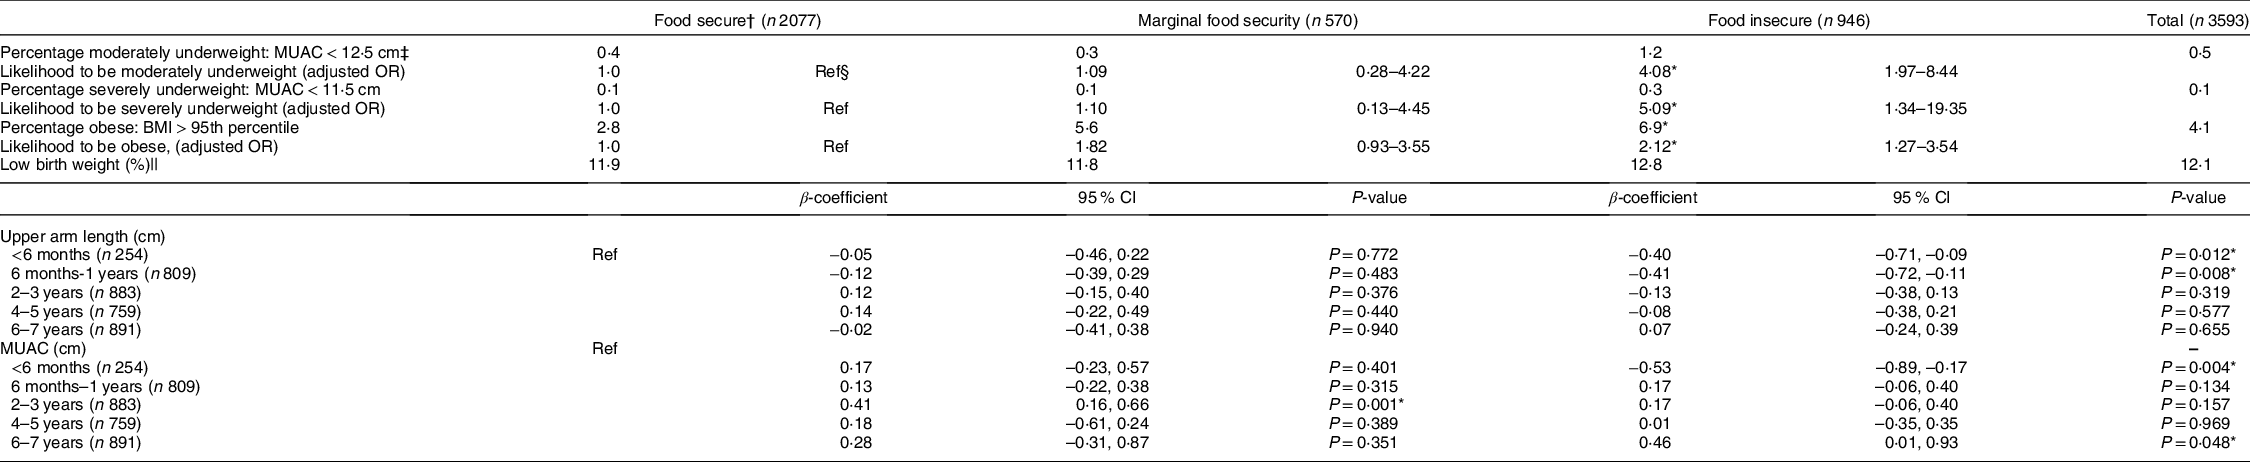
* Significantly different from the food-secure category, P < 0·05.
† NHANES sampling weights were applied in all analysis. β-coefficients and OR have been adjusted for sex and race/ethnicity.
‡ MUAC is mid-upper arm circumference, assessed from age 2 months and older.
§ The food-secure category was the referent.
|| Birth weight < 2·5 kg.
Based on MUAC cut-offs, in general, food-insecure children were more likely to be moderately underweight (OR: 4·08; 95 % CI 1·97, 8·44) or severely underweight (OR: 5·09; 95 % CI 1·34, 19·35) compared with their food-secure counterparts (Table 4). Further analysis showed that food-insecure children younger than 2 years were more likely to be underweight (OR: 4·34; 95 % CI 1·99, 9·46). Conversely, food-insecure children older than 5 years were more likely to be obese (OR: 3·12; 95 % CI 1·23, 7·96). These observations indicate a double burden of undernutrition–overnutrition among food-insecure children.
Figure 1 shows proportions of the children who were underweight, stunted or wasted within each food security category assessed using Centers for Disease Control and Prevention/National Center for Health Statistics Z-score benchmarks. Compared with food-secure children, there appeared to be a greater prevalence of stunting among the marginal food security and food-insecure children, but proportions were inadequate for reliable test of statistical significance. The prevalence of overweight/obesity among the children in the marginal food security (7·8 %, P = 0·001) and food insecure (7·9 %, P = 0·001) categories was significantly higher than the food-secure category (5·8 %) (Fig. 1).
Overall, a high proportion of the children were born having LBW (12·1 %). Categorically, the prevalence of LBW was: food secure, 11·9 %; marginal food security, 11·8 % and food insecure, 12·8 %. Food security status did not significantly associate with LBW.
The patterns of MUAC growth among marginal food security and food-insecure children were conspicuously irregular compared with their food-secure counterparts (Fig. 2). Among marginal food security and food-insecure children, there were conspicuous dips in the MUAC at age 4–5 years (indicated with the letter ‘ϕ’ on Fig. 2), but upper arm length remained unchanged (Fig. 3). The MUAC of food-insecure children aged below 6 months lagged their food-secure counterparts, but this lag disappeared by age 1 year. Similarly, food-insecure children below age 1 year had significantly shorter upper arm length, but this difference disappeared by age 3 years (Table 4, Fig. 3).

Fig. 2 Trends in mid-upper arm circumference of children aged 2 months–7 years categorised by food security status. ![]() , Food secure;
, Food secure; ![]() , Marginal;
, Marginal; ![]() , Food insecure
, Food insecure

Fig. 3 Trends in upper arm length of children aged 2 months–7 years categorised by food security status†. ![]() , Food secure;
, Food secure; ![]() , Marginal;
, Marginal; ![]() , Food insecure
, Food insecure
Discussion
In the current study, although generally the prevalence of stunting, underweight and wasting was below the 20 %, 10 % and 5 % cut-offs, respectively, at which public health intervention is mandated, disparity in the prevalence rates was significantly associated with food security status(Reference Nascimento, Machado and Bertoli43,Reference Nguyen, Ford and Yaroch47,50) . The associations between food insecurity and anthropometric values differed between infants, weaners and older children. The shorter upper arm length and MUAC of food-insecure infants are indicative of undernutrition. At this age of rapid growth, nutritional deficit could engender growth deficit such as observed in younger food-insecure children. Even though an inferior MUAC value can be indicative of either chronic or acute undernutrition, it is often indicative of the latter(29,33,Reference Nascimento, Machado and Bertoli43,Reference Das, Saimala and Reddy49) . However, we reasoned that the concurrent decreases in both MUAC and upper arm length values of food-insecure infants are indicative of chronic undernutrition in this age group.
The MUAC deficit among food-insecure infants had disappeared by age 1 year, whereas the deficit in upper arm length had disappeared by age 3 years. This indicates that MUAC recovered faster than upper arm length. The disappearance of the growth deficit and the upward trend in upper arm length manifest the phenomenon of catch-up growth among food-insecure children. There is ample evidence that catch-up growth early in life associates with markers of adult diseases including excess body fat mass, obesity and visceral adiposity(16–Reference Wlodek, Westcokk and Siebel20). These changes associate with adverse health outcomes and metabolic syndromes severally reported(Reference Thomas, Miller and Morrissey2–Reference Gundersen and Ziliak4,Reference Calkins and Devaskar17,Reference Wlodek, Westcokk and Siebel20,Reference Seligman, Laraia and Kushel22–Reference Tayie and Zizza27,Reference Sanyaolu, Okorie and Qi51) . Due to previously reported associations of childhood food insecurity with poor health in adulthood, and the apparent incidence of accelerated growth among food-insecure children, we assert that childhood food insecurity is a marker of poor health later in life(Reference Thomas, Miller and Morrissey2–Reference Gundersen and Ziliak4,Reference Calkins and Devaskar17–Reference Seligman, Jacobs and López21) .
Food-insecure children at age 6 months–1 year had lesser body weight, body length, upper arm length and MUAC than their food-secure counterparts. This observation warrants attention because most children are weaned or introduced to complementary foods at this stage, a transition accompanied by financial and resources constraints. It is a transition from breast milk to the purchasing of weaning foods while enduring food insecurity. The fact that significant growth faltering occurred at this weaning period is an indication of inadequate nutritional intake.
In general, we observed a positive association between food insecurity and BMI among those aged 2 years or older. Within each age group, BMI increased as the intensity of food insecurity increased, and by age 6 years, food-insecure children already had BMI and MUAC higher than their food-secure counterparts. Children 2–3 years in the marginal food security category were heavier, taller and larger than their food-secure counterparts. These are in households that experience anxiety about food shortage but not necessarily food shortage or hunger. Research reports indicate that households that experience anxiety about food shortage or hunger may adopt coping strategies associated with increased energy intake while decreasing energy expenditure(Reference Sanyaolu, Okorie and Qi51–Reference Drewnowski and Specter54). This could be a reason why a higher prevalence of overweight and obesity was observed among marginal food security and food-insecure children even at this tender age. Casey et al.(Reference Casey, Simpson and Gossett48) had observed similar associations among 3–5-year-old food-insecure children.
Compared with food-secure children, there was a conspicuous dent in the MUAC growth pattern of marginal food security and food-insecure children at age 4–5 years. This drop in MUAC is indicative of acute weight loss, a consequence of sudden onset of energy deficit, at this school entry age(Reference Thomas, Miller and Morrissey2,Reference Gundersen and Ziliak4,Reference Psaki, Bhutta and Ahmed5,Reference Schmeer and Piperata28,Reference Jeyakumar, Ghugre and Gadhave32) . We interpreted this observation as an incidence of acute undernutrition because the upper arm length did not decrease within this age group(50). We reasoned that the lower MUAC at the school entry age could be contributed by increased energy demand.
A limitation of this study, like other cross-sectional studies, is that cause–effect relationships could not be established so no causal inferences can be claimed. Like other population-based studies, not all variables could be controlled in this analysis, so the application of the outcome should be done with vigilance. However, the large sample size used, and the control of some potential confounders facilitated reliable estimates of associations and enabled generalisability of findings.
In conclusion, the extent of food insecurity experienced in the USA, although may not associate with severe undernutrition, is associated with minor chronic and acute onsets of malnutrition. There is a divergent association between child malnutrition and food insecurity. Whereas food-insecure infants and weaning-age children appear smaller and shorter, older food-insecure children appear heavier, suggestive of a double burden of undernutrition–overnutrition associated with childhood food insecurity. It is recommended that child food and nutrition programmes place emphasis on the transition ages.
Acknowledgements
Acknowledgements: The authors express their immense gratitude to the Centers for Disease Control and Prevention for making the NHANES data sets publicly available for such studies. Financial support: None, no funding source. Conflict of interest: There are no conflicts of interest. Authorship: All authors worked diligently together during the preparation of this manuscript. The corresponding author, F.T., conceptualised the idea, performed some of the data analysis and wrote parts of the manuscript, plotted the charts, contributed to editing the drafts and final version and submitted the final article. The co-authors, L.A.L., R.N.A., B.X., G.B., constructed tables, entered values, did literature search and calculations, wrote part of the introduction, formatted references and contributed to editing the drafts and final versions. Ethics of human subject participation: The protocols involving human subjects were approved by the Ethics Review Board of the National Center for Health Statistics, Centers for Disease Control and Prevention (Protocol Nos. 2011-17). Written parental consent and child assent were obtained from all participating households. The NHANES are conducted in accordance with the Code of Ethics stated in the Declaration of Helsinki on experiments involving human subjects. The NHANES data sets analysed for the present study had been de-identified and released for public use.


