


Introduction
Insufficient response to antipsychotic medication is a major challenge in the treatment of psychotic disorders. Around one-third of patients are treatment resistant to the marketed dopaminergic antipsychotics (Cipriani et al., Reference Cipriani, Boso and Barbui2009), which all share an affinity for the striatal dopamine D2 receptors. Poor response to treatment in the chronic phase of schizophrenia has been associated with increased levels of glutamate in the anterior cingulate cortex (ACC) concurrent with relatively unaffected striatal dopamine function (Demjaha et al., Reference Demjaha, Egerton, Murray, Kapur, Howes, Stone and McGuire2014; Mouchlianitis et al., Reference Mouchlianitis, Bloomfield, Law, Beck, Selvaraj, Rasquinha, Waldman, Turkheimer, Egerton, Stone and Howes2015). Recent findings suggest that glutamate and γ-aminobutyric acid (GABA) levels also are increased in antipsychotic-naïve or minimally treated non-responding patients when compared with levels in responders (de la Fuente-Sandoval et al., Reference de la Fuente-Sandoval, Reyes-Madrigal, Mao, Leon-Ortiz, Rodriguez-Mayoral, Jung-Cook, Solis-Vivanco, Graff-Guerrero and Shungu2017; Egerton et al., Reference Egerton, Broberg, Van Haren, Merritt, Barker, Lythgoe, Perez-Iglesias, Baandrup, During, Sendt, Stone, Rostrup, Sommer, Glenthoj, Kahn, Dazzan and McGuire2018), whereas responding patients have higher striatal dopamine activity than non-responding patients (Wulff et al., Reference Wulff, Pinborg, Svarer, Jensen, Nielsen, Allerup, Bak, Rasmussen, Frandsen, Rostrup and Glenthoj2015, Reference Wulff, Pinborg, Svarer, Jensen, Nielsen, Allerup, Bak, Rasmussen, Frandsen, Rostrup and Glenthoj2019). These findings suggest the existence of a subgroup of non-responding patients with higher glutamate levels compared with responders. However, it is unknown if levels of glutamate and GABA in antipsychotic-naïve patients can serve as biomarkers for poor response to antipsychotic treatment compared with levels in healthy controls (HCs). Clinically, it would be highly relevant if non-responding patients could be identified already at illness onset by abnormal glutamate and GABA levels compared with reference levels in a healthy population. Moreover, it is unknown if baseline glutamate and GABA levels characterize non-responders beyond a treatment period of 4 weeks.
Preclinical data indicate that glutamatergic abnormalities originate from reduced activity of inhibitory GABAergic interneurons thereby causing either increased glutamate release through disinhibition of pyramidal neurons (Olney and Farber, Reference Olney and Farber1995) or reduced release to maintain the excitatory-inhibitory balance (Lewis et al., Reference Lewis, Curley, Glausier and Volk2012). This affects the cortico-striato-thalamo-cortical networks believed to be involved in the development of psychotic disorders (Carlsson et al., Reference Carlsson, Waters and Carlsson1999). Especially abnormalities in dorsal ACC and the connected area thalamus are proposed to underlie schizophrenia (Williamson and Allman, Reference Williamson and Allman2012; Pratt et al., Reference Pratt, Dawson, Morris, Grent-’t-Jong, Roux and Uhlhaas2016). In support of this notion, in vivo studies of antipsychotic-naïve or minimally-treated patients with first-episode psychosis have reported aberrant levels of glutamatergic metabolites or GABA as measured with proton magnetic resonance spectroscopy (1H-MRS) in ACC and adjacent regions in terms of increased levels (Theberge et al., Reference Theberge, Bartha, Drost, Menon, Malla, Takhar, Neufeld, Rogers, Pavlosky, Schaefer, Densmore, Al-Semaan and Williamson2002, Reference Theberge, Williamson, Aoyama, Drost, Manchanda, Malla, Northcott, Menon, Neufeld, Rajakumar, Pavlosky, Densmore, Schaefer and Williamson2007; Bustillo et al., Reference Bustillo, Rowland, Mullins, Jung, Chen, Qualls, Hammond, Brooks and Lauriello2010; Kegeles et al., Reference Kegeles, Mao, Stanford, Girgis, Ojeil, Xu, Gil, Slifstein, Abi-Dargham, Lisanby and Shungu2012; Yang et al., Reference Yang, Zhu, Song, Mei, Zhang, Chen, Wang, Xu, Jiang, Li and Liu2015; de la Fuente-Sandoval et al., Reference de la Fuente-Sandoval, Reyes-Madrigal, Mao, Leon-Ortiz, Rodriguez-Mayoral, Jung-Cook, Solis-Vivanco, Graff-Guerrero and Shungu2017) or decreased levels (Wang et al., Reference Wang, Tang, Zhang, Cui, Xu, Zeng, Li, Li, Li, Liu, Lu, Zhang and Wang2016; Chen et al., Reference Chen, Wang, Zhang, Wang, Xu, Li, Yang and Liu2017), although no differences also have been reported (Aoyama et al., Reference Aoyama, Theberge, Drost, Manchanda, Northcott, Neufeld, Menon, Rajakumar, Pavlosky, Densmore, Schaefer and Williamson2011). Increased glutamine levels have been found in the left thalamus (Theberge et al., Reference Theberge, Bartha, Drost, Menon, Malla, Takhar, Neufeld, Rogers, Pavlosky, Schaefer, Densmore, Al-Semaan and Williamson2002; Theberge et al., Reference Theberge, Williamson, Aoyama, Drost, Manchanda, Malla, Northcott, Menon, Neufeld, Rajakumar, Pavlosky, Densmore, Schaefer and Williamson2007) and thalamic glutamate levels are correlated with the genetic liability for schizophrenia spectrum disorders (Legind et al., Reference Legind, Broberg, Mandl, Brouwer, Anhoj, Hilker, Jensen, McGuire, Pol, Fagerlund, Rostrup and Glenthoj2019). Preclinical studies indicate a differential effect of specific antipsychotic compounds on glutamate and GABA levels (Bustillo et al., Reference Bustillo, Barrow, Paz, Tang, Seraji-Bozorgzad, Moore, Bolognani, Lauriello, Perrone-Bizzozero and Galloway2006; Yang and Wang, Reference Yang and Wang2008; Xu et al., Reference Xu, Gullapalli and Frost2015), but currently, antipsychotic monotherapy in initially antipsychotic-naïve or minimally-treated patients has only been investigated in two longitudinal studies. Egerton et al. reported a reduction of glutamate levels in ACC and thalamus after 4 weeks of treatment with amisulpride (Egerton et al., Reference Egerton, Broberg, Van Haren, Merritt, Barker, Lythgoe, Perez-Iglesias, Baandrup, During, Sendt, Stone, Rostrup, Sommer, Glenthoj, Kahn, Dazzan and McGuire2018), and de la Fuente-Sandoval found reductions in the medial prefrontal cortex after 4 weeks of treatment with risperidone (de la Fuente-Sandoval et al., Reference de la Fuente-Sandoval, Reyes-Madrigal, Mao, Leon-Ortiz, Rodriguez-Mayoral, Jung-Cook, Solis-Vivanco, Graff-Guerrero and Shungu2017). The effect of aripiprazole on glutamate levels is of particular interest since preclinical studies have suggested a neuroprotective effect of aripiprazole through reduction of glutamate release (Yang and Wang, Reference Yang and Wang2008; Koprivica et al., Reference Koprivica, Regardie, Wolff, Fernalld, Murphy, Kambayashi, Kikuchi and Jordan2011).
In this study, we examined glutamate levels in ACC and left thalamus and GABA levels in ACC at baseline and after 6 and 26 weeks in a sample of antipsychotic-naïve patients with first-episode psychosis and matched HCs. Patients were treated with aripiprazole monotherapy for the first 6 weeks but could be switched to another compound thereafter. First, we investigated the effect of 6 weeks aripiprazole monotherapy on glutamate and GABA levels. Next, we tested the primary hypothesis that baseline glutamate levels in the left thalamus and ACC would be increased and GABA levels in ACC would be decreased in non-responders after 6 and 26 weeks of treatment compared with levels in HCs.
Patients and methods
Participants and design
This longitudinal cohort study was initiated in January 2014 and carried out at mental health centers in the Capital Region of Denmark and conducted in accordance with the Declaration of Helsinki and approved by the Committee on Biomedical Research Ethics (H-3-2013-149). All participants provided written informed consent after the study procedures had been explained. We included legally competent patients fulfilling a diagnosis of International Classification of Diseases, 10th revision (ICD-10) criteria for schizophrenia, schizoaffective disorder, or non-organic psychosis as determined with the Schedules for Clinical Assessment in Neuropsychiatry (SCAN) (Wing et al., Reference Wing, Babor, Brugha, Burke, Cooper, Giel, Jablenski, Regier and Sartorius1990). Inclusion criteria were: age 18–45 years, no lifetime exposure to antipsychotics or central nervous system stimulants (verified by medical record), and no substance abuse (ICD-10 F1x.2) in the previous 3 months. Tobacco use and current occasional substance use (ICD-10 F1x.1) were accepted and assessed through self-report and a urine drug test (Rapid Response, Jepsen HealthCare, Tune, DK). Benzodiazepines were allowed on per needed basis (maximum three times per day) to reduce anxiety and secure sleep, although no later than 12 h prior to examinations. HCs were recruited through online advertisement (www.forsøgsperson.dk) and matched on age, sex, and parental socioeconomic status. Further details of the in- and exclusion criteria are provided in online Supplementary Methods.
All participants underwent clinical assessment and magnetic resonance imaging (MRI) at baseline and at week 6 and 26. Patients were treated with aripiprazole monotherapy (doses of 5–30 mg/day, tool compound) for the first 6 weeks and the use of other psychoactive compounds (antipsychotics, antidepressants, or mood stabilizers) was not allowed. After 6 weeks patients were allowed to switch to another antipsychotic compound if the clinical effect was inadequate or side-effects outweighed the clinical effect. HCs were not treated. Patients, who prematurely terminated aripiprazole treatment, were not re-examined at 6 weeks, but re-invited for examination at 26 weeks. A scanner upgrade lasting 8 months resulted in some missing MRI examinations as reported in Table 1. Details of participants scanned before and after the upgrade are provided in online Supplementary Methods.
Table 1. Demographics and clinical characteristics at baseline and at 6 and 26 weeks
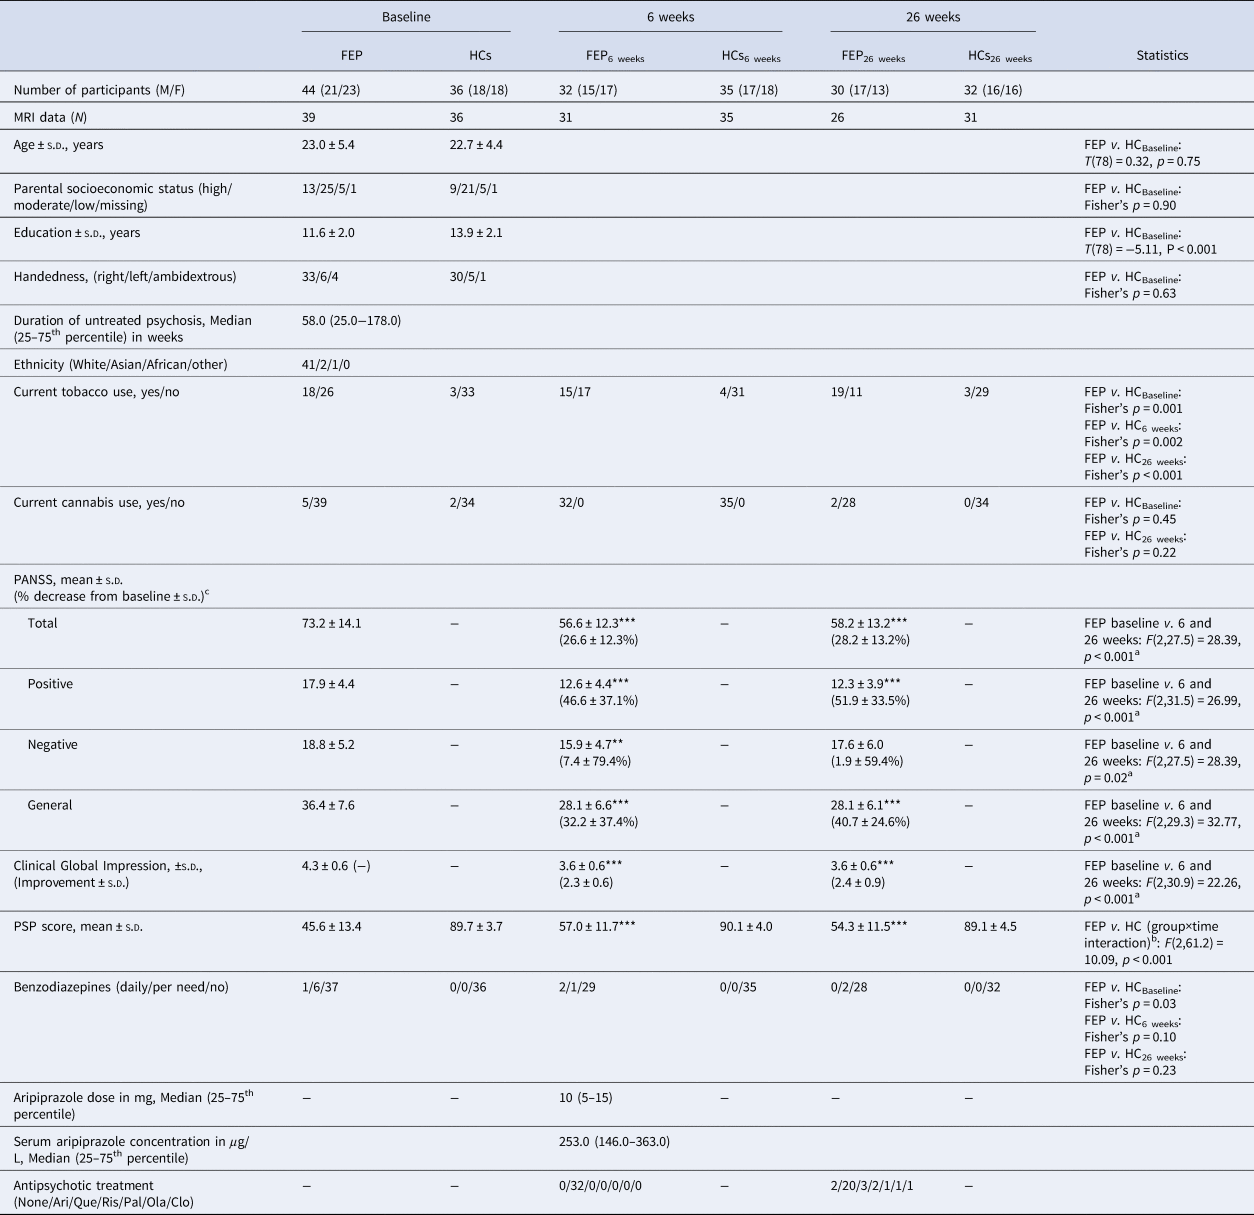
FEP, first-episode psychosis patients; HCs, healthy controls; MRI, magnetic resonance imaging; S.D., standard deviation; PANSS, Positive and Negative Syndrome Scale; PSP, Personal and Social Performance scale; Ari, aripiprazole; Que, quetiapine; Ris, risperidone; Pal, paliperidone; Ola, olanzapine; Clo, clozapine.
a Main effect of time.
b Significant interaction due to an increase in the FEP group after 6 and 26 weeks compared with baseline but not in the HC group.
c For the PANSS reduction %, the minimum score was initially subtracted. ***p < 0.001 in post hoc tests.
Clinical assessments
In patients, psychopathology was assessed by trained raters using the Positive and Negative Syndrome Scale (PANSS) (Kay et al., Reference Kay, Fiszbein and Opler1987), and percentage change in PANSS scores was calculated after subtraction of the minimum score (Leucht et al., Reference Leucht, Davis, Engel, Kane and Wagenpfeil2007). Symptom severity was assessed with the Clinical Global Impression (CGI) scale (Guy, Reference Guy1976), and side effects with the short version of the Task Force for Clinical Investigation (Udvalget for Kliniske Undersøgelser) (UKU) (Lingjaerde et al., Reference Lingjaerde, Ahlfors, Bech, Dencker and Elgen1987). Level of functioning was assessed both in patients and HCs using the Personal and Social Performance Scale (PSP) (Morosini et al., Reference Morosini, Magliano, Brambilla, Ugolini and Pioli2000). Clinical response after 6 and 26 weeks of treatment was assessed using the Andreasen remission criteria (Andreasen et al., Reference Andreasen, Carpenter, Kane, Lasser, Marder and Weinberger2005) (described in the online Supplementary Methods) with the modification that remission status was based on PANSS scores during the previous week rather than 6 months. The terms responder and non-responder are therefore used instead of remitter and non-remitter.
Magnetic resonance spectroscopy
All scans were performed on a 3.0 Tesla Philips scanner with a 32-channel head coil as described previously in (Bojesen et al., Reference Bojesen, Andersen, Rasmussen, Baandrup, Madsen, Glenthoj, Rostrup and Broberg2018) and in the online Supplementary Methods together with details of the T1-weighted structural image acquisition. Levels of glutamate and other major metabolites were estimated using the PRESS sequence (TR 3000 ms, TE 30 ms, 128 averages, MOIST water-suppression) with one 2.0 × 2.0 × 2.0 cm voxel in ACC (Brodmann area 24 and 32) and one 2.0 × 1.5 × 2.0 cm voxel in the left thalamus. Levels of GABA + macromolecules and glutamate + glutamine (glx) were estimated in a 3.0 × 3.0 × 3.0 cm voxel in ACC using the MEGAPRESS sequence (Mescher et al., Reference Mescher, Merkle, Kirsch, Garwood and Gruetter1998) (TE = 68 ms; TR = 2000 ms, 14 ms editing pulse applied at 1.9 ppm and 7.5 ppm, 320 averages, MOIST water suppression). LCModel version 6.3-1J (Provencher, Reference Provencher1993) was used to analyze the PRESS acquisitions fitted in the spectral range between 0.2 and 4.0 ppm, as previously described (Bojesen et al., Reference Bojesen, Andersen, Rasmussen, Baandrup, Madsen, Glenthoj, Rostrup and Broberg2018). Gannet version 2.1 (Edden et al., Reference Edden, Puts, Harris, Barker and Evans2014) was used to analyze the MEGAPRESS acquisitions fitted in the spectral range between 2.79 and 3.55 ppm using water scaling to get an estimate of GABA and total creatine + phosphocreatine (creatine) levels. Spectral quality was initially assessed by visual inspection. In accepted spectra, the exclusion criteria for individual metabolites were Cramér–Rao lower bound (CRLB) >20% for PRESS acquisitions and Gannet signal fit error >15% for MEGAPRESS acquisitions. Details on 1H-MRS and data quality are provided in the online Supplementary Methods, online Supplementary Results, and Fig. S1. We used glutamate and GABA as a ratio to total creatine (/Cr) as the primary outcome measures since the study was inspired by the first cross-sectional study of first-episode patients that reported an association between glutamate/Cr and treatment outcomes (Egerton et al., Reference Egerton, Brugger, Raffin, Barker, Lythgoe, McGuire and Stone2012). To allow for comparisons with other studies, neurotransmitter levels in institutional units (IU) were also calculated as described in the online Supplementary Methods. Findings in metabolite levels in IU are mentioned in the Result section and statistics are reported in the online Supplementary Results.
Statistical analyses
The significance level for the planned main outcomes baseline glutamate/Cr and GABA/Cr in relation to treatment outcome after 6 and 26 weeks was defined as p < 0.05 in the analyses. The primary hypothesis that baseline levels of glutamate and GABA (dependent variables) would differ in non-responders after 6 and 26 weeks compared with baseline levels in HCs was tested with a one-way analysis of variance (ANOVA) and the significance level was adjusted for 2 comparisons (both responders and non-responders were compared with HCs, p < 0.05/2 = 0.025) and with adjustment for age and sex. Next, binary logistic regression was applied to explore if baseline glutamate and GABA levels could predict non-response compared with reference values in HCs. In secondary analyses, the effect of treatment on glutamate and GABA levels was analyzed in separate linear mixed models with the independent variables group (patients v. HCs) and time (0, 6, and 26 weeks). The group×time interaction expressed if the trajectory of glutamate and GABA levels was different in patients and controls. If the interaction was not significant, it was removed from the model. We adjusted for the following factors, which might influence longitudinal glutamate and GABA levels: sex (O'Gorman et al., Reference O'Gorman, Michels, Edden, Murdoch and Martin2011), age (Marsman et al., Reference Marsman, van den Heuvel, Klomp, Kahn, Luijten and Hulshoff Pol2013; Rowland et al., Reference Rowland, Krause, Wijtenburg, McMahon, Chiappelli, Nugent, Nisonger, Korenic, Kochunov and Hong2016), tobacco use, cannabis use, and scanner upgrade. Group differences in demographical- and clinical variables, as well as spectral quality, were tested with χ2, Fisher's exact test, or linear mixed models, as appropriate. In explorative analyses, the associations between baseline glutamate or GABA levels and reduction of PANSS total and positive scores were investigated with Spearman or Pearson's correlations. Statistical analyses were performed using SAS version 7.1 (SAS Institute, Cary, NC, USA).
Results
Participants
Forty-four initially antipsychotic-naïve first-episode patients with psychosis and 36 HCs were recruited. Clinical characteristics are summarized in Table 1 for all patients and HCs. Groups did not differ on age, parental socioeconomic status, current cannabis use, or handedness, but patients had fewer years of education, lower level of functioning, and more were smokers. After 6 and 26 weeks of treatment, patients' functioning level significantly increased, and all PANSS scores significantly decreased, except for PANSS negative after 26 weeks. After 6 weeks, 12 of 44 patients and 1 of 36 HCs were not re-assessed; and after 26 weeks, 11 of 44 patients and 2 of 36 HCs were not re-assessed. Twenty-four patients completed re-examinations at both week 6 and 26. Reasons for drop-out and comparisons between completers and non-completers are provided in online Supplementary Methods.
Clinical characteristics and statistics for responders and non-responders with a baseline MRI scan are summarized in Table 2. Briefly, responders and non-responders did not differ in age, smoking status, cannabis use, or baseline PANSS scores. Non-responders at 6 weeks received significantly higher aripiprazole doses, but serum aripiprazole levels did not significantly differ compared with responders. Three responders and five non-responders at 6 weeks changed their response status after 26 weeks. Five patients were switched to another antipsychotic compound at 6 weeks and one of these responded at 26 weeks, whereas four remained non-responders.
Table 2 Demographics of responders and non-responders at 6 and 26 weeks
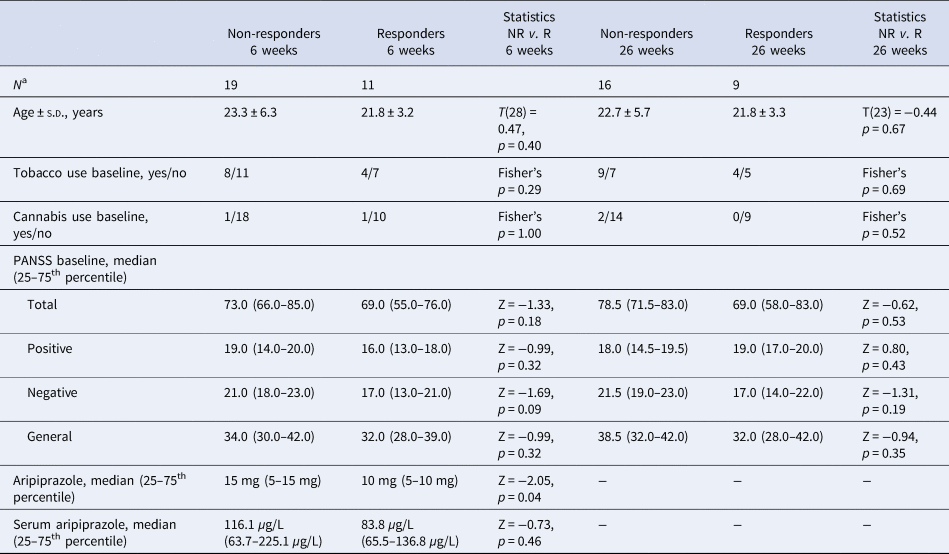
NR, non-responders; R, responders.
a Only patients with an MRI scan at baseline are included.
Treatment effects on glutamate and GABA levels
Glutamate levels in the left thalamus
The trajectory of glutamate/Cr levels in the left thalamus was different in patients and HCs (significant group×time interaction: F (2,61.5) = 5.30, p = 0.008) indicating an effect of treatment. Post hoc tests revealed increased glutamate/Cr levels in patients at baseline compared with HCs [T (70.6) = 2.11, p = 0.04, estimate = 0.08 (CI 0.004–0.15)], whereas there were no differences between groups after 6 weeks of treatment with aripiprazole (p = 0.55) and 26 weeks of naturalistic antipsychotic treatment (p = 0.08) (Fig. 1a). The interaction remained significant after adjusting for age, sex, smoking status, cannabis use, and scanner upgrade (p values: 0.005–0.008).
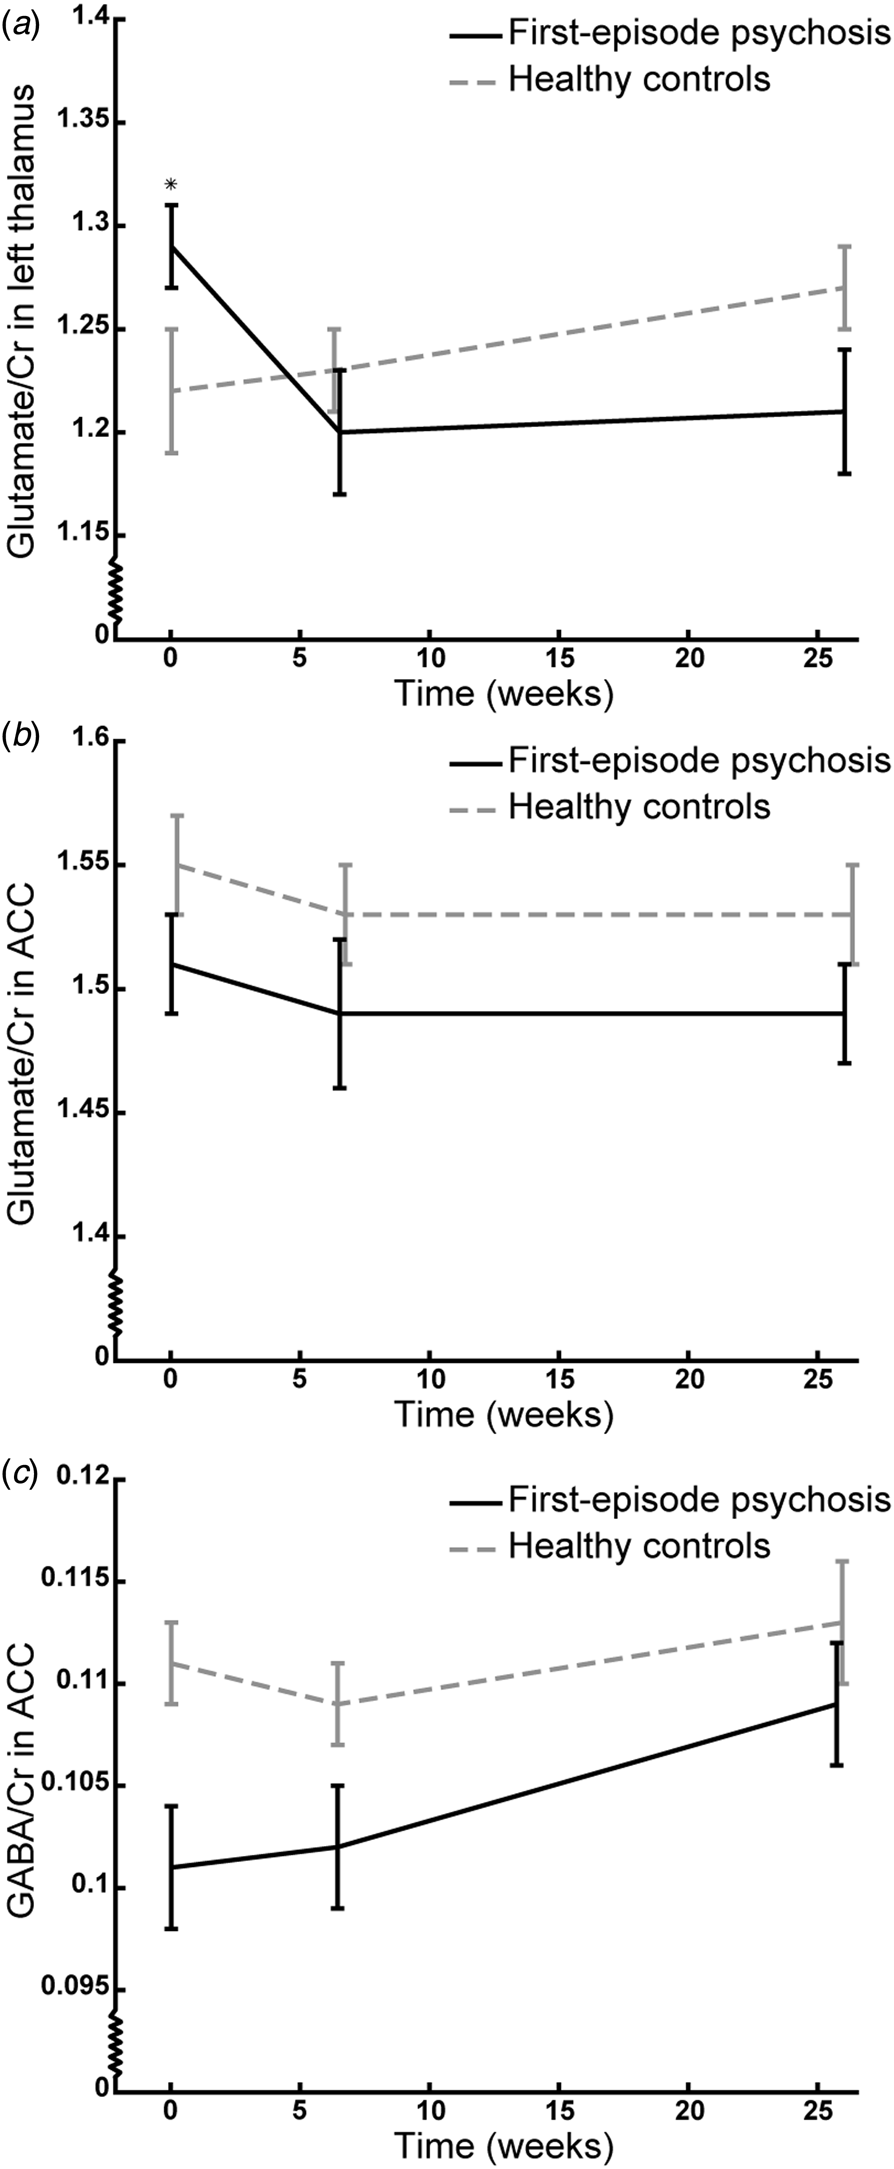
Fig. 1. The trajectory of mean glutamate/Cr levels in the left thalamus (a) and anterior cingulate cortex (ACC) (b) and GABA/Cr levels in ACC (c) of initially antipsychotic-naïve patients with first-episode psychosis (black line) and healthy controls (grey line) at baseline, and after 6 weeks monotherapy with aripiprazole, and 26 weeks of naturalistic antipsychotic treatment. The vertical bars represent standard errors. *p < 0.05 in post hoc testing. Note that the Y-axis does not origin in 0;0.
A similar trend was found for glutamate levels in IU in the thalamus, although not statistically significant.
Glutamate levels in ACC
The trajectory of glutamate/Cr levels in ACC did not differ between patients and HCs (group×time insignificant: p = 0.75) indicating no effect of treatment. The patients had lower levels of glutamate/Cr at all examinations compared with HCs [significant main effect of group: F (1,66.8) = 4.10, p = 0.047, estimate = −0.04 (CI −0.08 to −0.001), Fig. 1b] and this remained significant when removing the group×time interaction (p = 0.046) and adjusting for age (p = 0.02) and cannabis use (p = 0.04) but not when adjusting for sex, smoking status, and scanner upgrade (p = 0.05–0.10). There was no main effect of time.
For glutamate levels in IU in ACC, the interaction and main effect of the group were insignificant.
GABA levels in ACC
The trajectory of GABA/Cr levels in ACC did not differ between patients and HCs (group×time insignificant, p = 0.62) indicating no effect of treatment. The patients had lower levels of GABA/Cr at all examinations compared with HCs [significant main effect of group: F (1,74.2) = 9.16, p = 0.003, estimate = −0.008 (CI −0.01 to −0.003), Fig. 1c] and this was also significant when removing the group×time interaction (p = 0.001) and adjusting for age, sex, smoking status, cannabis use, and scanner upgrade and excluding subjects that used benzodiazepines either occasionally or daily (p = 0.001–0.03). There was no main effect of time.
Similar results were found for GABA levels in IU in ACC, although the main effect of the group only was borderline significant.
The mean levels of other metabolites at all assessments are summarized in the online Supplementary Tables S8–S10 for creatine scaled values, levels in IU, and water scaled values, respectively.
Baseline glutamate and GABA levels in non-responders and responders compared with healthy controls
The baseline levels of metabolites in non-responders, responders, and HCs at 6 and 26 weeks are summarized in Table 3 for creatine scaled values, Table S11 for levels in IU, and Table S12 for water scaled values.
Table 3 Baseline neurometabolite levels scaled to total creatine in responders and non-responders after 6 and 26 weeks compared with HCs
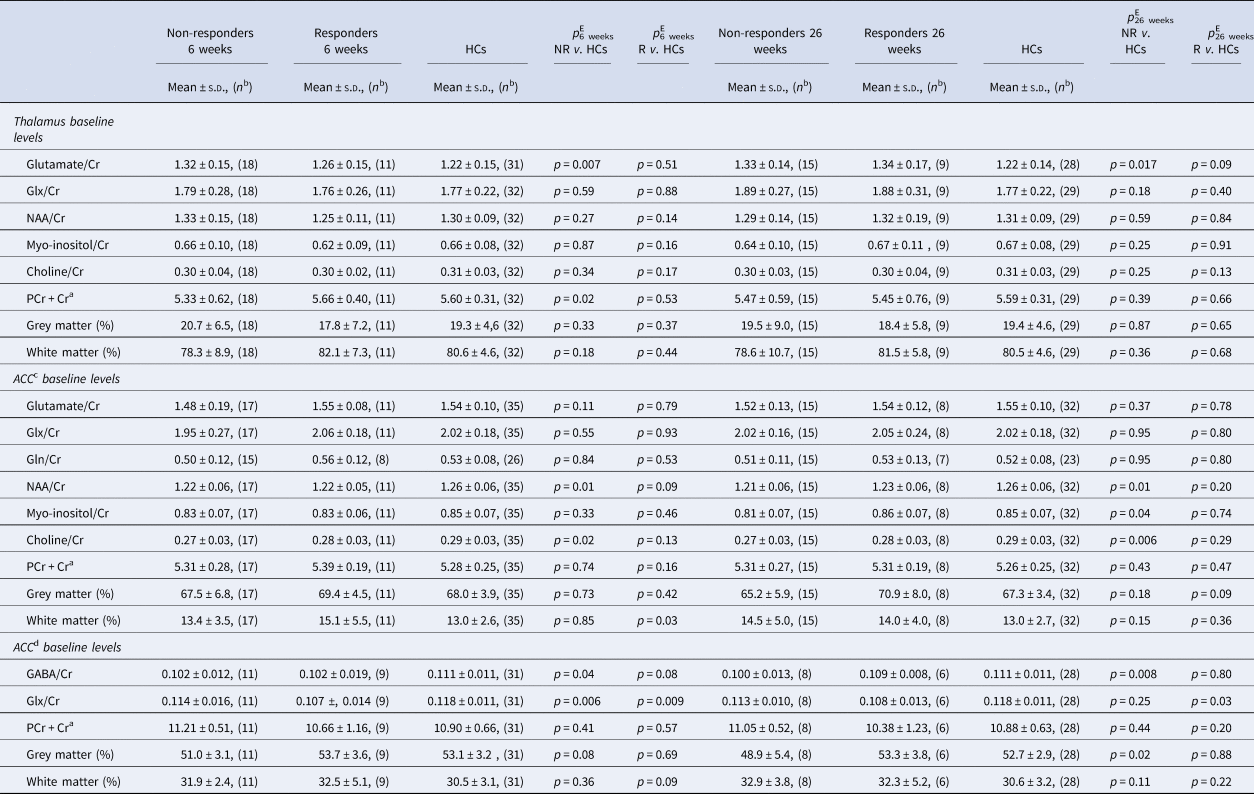
NR, non-responders; R, responders; HCs, healthy controls; ACC, anterior cingulate cortex; Glx, glutamate + glutamine; Gln, glutamine; NAA, N-acetyl aspartate; PCr + Cr, total creatine (phosphocreatine + creatine); GABA, γ-aminobutyric acid.
a Water-scaled value of PCr + Cr provided by LCModel and Gannet and used as a reference in metabolite/Cr values.
b N is the number of spectra analyzed.
c Metabolites in a 2.0 × 2.0 × 2.0 cm voxel.
d Metabolites in a 3.0 × 3.0 × 3.0 cm voxel (details provided in the patients and methods section).
e Adjusted for age and sex.
Baseline glutamate levels in the left thalamus
Baseline glutamate/Cr levels were higher in non-responders at 6 weeks compared with baseline levels in HCs [overall model F (2,57) = 2.83, p = 0.067, after adjustment for age and sex: overall model F (2,55) = 2.89, p = 0.03; post hoc test: T (55) = 2.82, p = 0.007], whereas responders and HCs did not differ (p = 0.51) (Fig. 2a). Similarly, non-responders at 26 weeks had higher baseline levels [overall model F (2,49) = 3.59, p = 0.04; post hoc test: T (49) = 2.34, p = 0.023; after adjustment for age and sex: overall model F (2,47) = 3.89, p = 0.008; post hoc test: T (47) = 2.48, p = 0.017], whereas responders and HCs did not differ (p = 0.05, after adjustment for age and sex: p = 0.09) (Fig. 2b). For glutamate IU, a similar result was found for non-responders at 26 weeks, but not at 6 weeks.
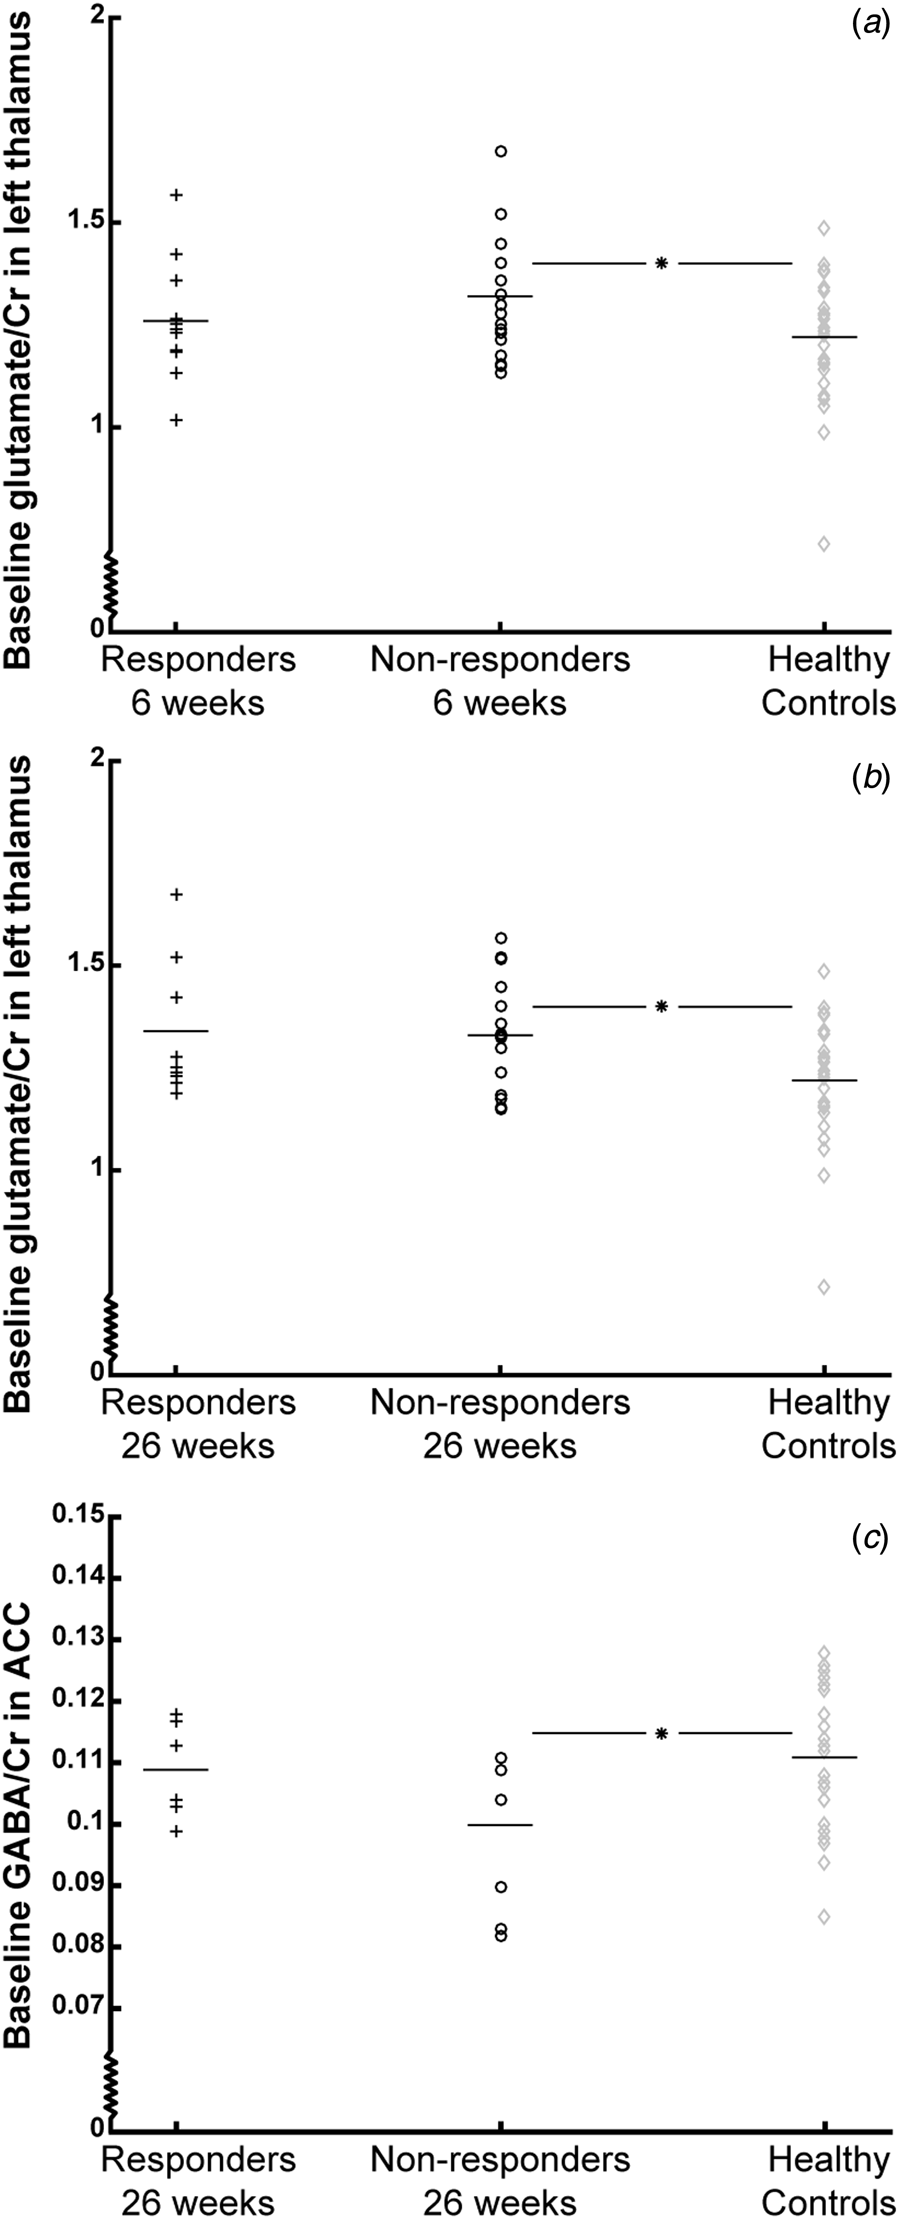
Fig. 2. Baseline levels of glutamate/Cr in the thalamus and GABA/Cr in the anterior cingulate cortex (ACC) of responders (black plusses), non-responders (black circles), and healthy controls (grey diamonds). Mean values are represented by horizontal bars. Baseline glutamate/Cr levels in the left thalamus are shown according to treatment response after 6 weeks (A) and 26 weeks (B), and baseline GABA/Cr levels are shown according to treatment response after 26 weeks (C). *p < 0.025. Note that the Y-axis does not origin in 0;0.
Baseline glutamate levels in ACC
There were no differences between baseline glutamate/Cr levels in neither non-responders nor responders at 6 and 26 weeks compared with HCs [6 weeks: overall model p = 0.18, after adjustment for age and sex: F (2,58) = 3.60, p = 0.01; post hoc tests: p Non-responders v. HCs = 0.11 and p Responders v. HCs = 0.79; 26 weeks: overall model p = 0.69, after adjustment for age and sex: p = 0.60]. Similar results were found for glutamate IU.
Baseline GABA levels in ACC
There was no difference in baseline GABA/Cr levels in non-responders at 6 weeks compared with HCs (overall model: p = 0.08, after adjustment for age and sex: p = 0.09), but non-responders at 26 weeks had significantly lower baseline GABA/Cr levels compared with HCs [overall model: F (2,39) = 3.10, p = 0.056, after adjustment for age and sex: overall model: F (2,37) = 2.64, p = 0.049; post hoc test: T (37) = −2.78, p = 0.008], whereas responders and HCs did not differ (p = 0.79) (Fig. 2c). For GABA IU, the associations were not significant.
Baseline levels of other neurometabolites in the left thalamus and ACC
In the left thalamus, significantly lower baseline levels of total creatine were observed in patients not responding at 6 weeks (p = 0.02). In the 2.0×2.0×2.0 cm ACC PRESS voxel, non-responders at 6 and 26 weeks had significantly lower baseline levels of N-acetyl aspartate (NAA) (both p = 0.01) and choline (p 6 weeks = 0.02; p 26 weeks = 0.006). In the larger 3.0×3.0×3.0 cm ACC MEGAPRESS voxel, baseline glx levels were lower in both responders (p = 0.006) and non-responders (p = 0.009) at 6 weeks and in responders at 26 weeks (p = 0.03) compared with HCs.
Baseline glutamate and GABA levels and prediction of non-response
Predictive value of glutamate levels in the left thalamus
Higher baseline glutamate/Cr levels were significantly associated with the likelihood of being a non-responder at both 6 weeks [p 6 weeks = 0.031, b = 5.37, s.e. = 2.50, Wald χ2 = 4.36, OR = 2.2 (0.02–287) per 0.01 unit increase in glutamate/Cr, sensitivity = 33%], and 26 weeks [p 26 weeks = 0.026, b = 6.38, s.e. = 2.86, Wald χ2 = 4.98, OR = 5.9 (0.02–1594) per 0.01 unit increase in glutamate/Cr, sensitivity = 33%] compared with reference levels in HCs. The association remained significant after adjusting for age (p 6 weeks = 0.027; p 26 weeks = 0.021) and sex (p 6 weeks = 0.028; p 26 weeks = 0.026).
For glutamate levels in IU, a similar result was found for non-responders at 26 weeks, but not at 6 weeks.
Predictive value of glutamate levels in ACC
Baseline glutamate/Cr levels were not associated with the likelihood of being a non-responder (p 6weeks = 0.11; p 26 weeks = 0.39), and adjusting for potential confounders did not affect the results (p 6 weeks = 0.07−0.17; p 26 weeks = 0.17–0.46).
Similar results were seen for glutamate levels in IU.
Predictive value of GABA levels in ACC
Lower baseline GABA/Cr levels were significantly associated with the likelihood of being a non-responder at 6 weeks [p = 0.046, b = −65.4, s.e. = 32.8, Wald χ2 = 3.97, OR = 2.5×1026 (0.03–2.4×1054) per 0.01 unit decrease in GABA/Cr, sensitivity = 36%], and 26 weeks [p = 0.032, b = −81.6, s.e. = 38.1, Wald χ2 = 4.6, OR = 2.7×1033 (11.3–7.6×1065) per 0.01 unit decrease in GABA/Cr, sensitivity = 25%] compared with reference levels in HCs. The association remained significant after adjusting for age (p 6 weeks = 0.047; p 26 weeks = 0.030) and sex (p 6 weeks = 0.047; p 26 weeks = 0.019).
For GABA levels in IU, similar results were not found.
The accuracy of the prediction was slightly improved when both glutamate/Cr in the thalamus and GABA/Cr in ACC were included in the same model (percentage of correct identified non-responders at 6 weeks: 45.5%; and at 26 weeks: 37.5%).
Baseline glutamate and GABA levels: associations with a symptom reduction of PANSS positive and total
Baseline levels of glutamate/Cr in the left thalamus were significantly negatively associated with the percent change in positive symptoms after 26 weeks (N = 24, R = −0.52, p = 0.01). The other correlations were insignificant.
Discussion
To the best of our knowledge, this is the first longitudinal study of initially antipsychotic-naïve patients with first-episode psychosis investigating whether baseline glutamate and GABA levels are associated with treatment response compared with reference levels in HCs. The main results are that higher baseline levels of glutamate in the left thalamus and lower GABA levels in ACC are associated with poor treatment response at 6 and 26 weeks. The data did not, however, confirm our hypothesis of increased baseline glutamate levels in ACC of non-responders.
The finding that high thalamic glutamate levels and low ACC GABA levels at illness onset are associated with non-response at both 6 and 26 weeks compared to reference levels in HCs is clinically important. A normative reference interval of glutamate and GABA levels from HCs can be useful in guiding individual treatment choice in first-episode patients at illness onset, if the current findings are replicated. This could spare non-responders from the trial-and-error treatment approach with multiple dopaminergic antagonists, which they are currently subjected to. Interestingly, high thalamic glutamate levels and low GABA levels in ACC significantly predicted non-responders when compared with levels in HCs. However, the sensitivity was only 25–36%, but it might be enhanced if baseline glutamate and GABA levels are combined with other factors associated with non-response, such as striatal dopamine levels (Wulff et al., Reference Wulff, Pinborg, Svarer, Jensen, Nielsen, Allerup, Bak, Rasmussen, Frandsen, Rostrup and Glenthoj2015, Reference Wulff, Nielsen, Rostrup, Svarer, Jensen, Pinborg and Glenthoj2019), reward disturbances (Nielsen et al., Reference Nielsen, Rostrup, Wulff, Bak, Broberg, Lublin, Kapur and Glenthoj2012), cognitive measures (Green, Reference Green2006), and structural brain changes (Cahn et al., Reference Cahn, van Haren, Hulshoff Pol, Schnack, Caspers, Laponder and Kahn2006) in future studies.
Our findings support that abnormal glutamate and GABA levels in initially antipsychotic-naïve patients are associated with non-response after first antipsychotic treatment as also reported in two recent studies, but the direction of abnormalities and regions affected differ (de la Fuente-Sandoval et al., Reference de la Fuente-Sandoval, Reyes-Madrigal, Mao, Leon-Ortiz, Rodriguez-Mayoral, Jung-Cook, Solis-Vivanco, Graff-Guerrero and Shungu2017; Egerton et al., Reference Egerton, Broberg, Van Haren, Merritt, Barker, Lythgoe, Perez-Iglesias, Baandrup, During, Sendt, Stone, Rostrup, Sommer, Glenthoj, Kahn, Dazzan and McGuire2018). Egerton et al. found significantly higher glutamate levels at baseline in ACC, but not in the left thalamus of minimally-treated non-responder patients after 4 weeks treatment with amisulpride (Egerton et al., Reference Egerton, Broberg, Van Haren, Merritt, Barker, Lythgoe, Perez-Iglesias, Baandrup, During, Sendt, Stone, Rostrup, Sommer, Glenthoj, Kahn, Dazzan and McGuire2018), and de la Fuente-Sandoval et al. reported higher GABA levels in medial frontal cortex of non-responding antipsychotic-naïve patients after 4 weeks of treatment with risperidone (de la Fuente-Sandoval et al., Reference de la Fuente-Sandoval, Reyes-Madrigal, Mao, Leon-Ortiz, Rodriguez-Mayoral, Jung-Cook, Solis-Vivanco, Graff-Guerrero and Shungu2017). These variations may be explained by methodical differences. Most importantly, we used matched HCs as a reference instead of responders. Second, we observed a decrease in thalamic glutamate levels after treatment was initiated and therefore speculate if the prior exposure to antipsychotic treatment had reduced thalamic glutamate levels in the study of minimally-treated patients (Egerton et al., Reference Egerton, Broberg, Van Haren, Merritt, Barker, Lythgoe, Perez-Iglesias, Baandrup, During, Sendt, Stone, Rostrup, Sommer, Glenthoj, Kahn, Dazzan and McGuire2018). Third, the voxel placement varied between studies. We placed our voxel in the area corresponding to the dorsal ACC, whereas the two other studies placed it in the pregenual ACC. Previous studies have reported a different distribution of glutamatergic and GABAergic receptors in these two subregions (Palomero-Gallagher et al., Reference Palomero-Gallagher, Vogt, Schleicher, Mayberg and Zilles2009), and higher glutamate and GABA levels in the pregenual ACC compared to the dorsal ACC in HCs (Dou et al., Reference Dou, Palomero-Gallagher, van Tol, Kaufmann, Zhong, Bernstein, Heinze, Speck and Walter2013). Interestingly, we also observed lower baseline glx in both responders and non-responders after 6 weeks in the larger and more dorsal MEGAPRESS voxel, but not in the PRESS voxel. It therefore seems likely that glutamatergic and GABAergic disturbances in ACC are region-specific in patients. Moreover, differences in factors that influence glutamate and GABA levels, including age (Marsman et al., Reference Marsman, van den Heuvel, Klomp, Kahn, Luijten and Hulshoff Pol2013; Rowland et al., Reference Rowland, Krause, Wijtenburg, McMahon, Chiappelli, Nugent, Nisonger, Korenic, Kochunov and Hong2016), sex (O'Gorman et al., Reference O'Gorman, Michels, Edden, Murdoch and Martin2011), cigarette smoking (Akkus et al., Reference Akkus, Ametamey, Treyer, Burger, Johayem, Umbricht, Gomez Mancilla, Sovago, Buck and Hasler2013), and possibly also ethnicity and substance abuse, may contribute to the heterogeneous findings. Last, clozapine treatment in chronic patients might enhance glutamate levels as indicated by preclinical studies (Melone et al., Reference Melone, Vitellaro-Zuccarello, Vallejo-Illarramendi, Perez-Samartin, Matute, Cozzi, Pellegrini-Giampietro, Rothstein and Conti2001; Tanahashi et al., Reference Tanahashi, Yamamura, Nakagawa, Motomura and Okada2012) and by a recent cross-sectional study that found increased glx in dACC of non-responders to clozapine (Iwata et al., Reference Iwata, Nakajima, Plitman, Caravaggio, Kim, Shah, Mar, Chavez, De Luca, Mimura, Remington, Gerretsen and Graff-Guerrero2019).
Our second aim was to investigate the effect of 6 weeks of aripiprazole monotherapy on glutamate and GABA levels in initially antipsychotic-naïve patients. Aripiprazole has been shown to reduce glutamate release through activation of the dopamine D2 and 5-HT1A receptors (Yang and Wang, Reference Yang and Wang2008). Moreover, in preclinical models, where glutamate has been increased by the administration of a non-competitive NMDAR antagonist in the thalamus, aripiprazole appears to inhibit the cortical release of glutamate (Fukuyama et al., Reference Fukuyama, Hasegawa and Okada2018). We found increased glutamate levels in the left thalamus at baseline and decreased ACC levels of GABA and glutamate at all assessments in the whole group of patients. Both aripiprazole monotherapy during 6 weeks and naturalistic antipsychotic treatment during 26 weeks decreased thalamic glutamate levels, but did not affect glutamate and GABA levels in ACC. This suggests that both aripiprazole and other antipsychotic compounds reduce glutamate levels in the thalamus, which is in line with the two existing previous studies of initially antipsychotic-naïve patients (Theberge et al., Reference Theberge, Williamson, Aoyama, Drost, Manchanda, Malla, Northcott, Menon, Neufeld, Rajakumar, Pavlosky, Densmore, Schaefer and Williamson2007; Aoyama et al., Reference Aoyama, Theberge, Drost, Manchanda, Northcott, Neufeld, Menon, Rajakumar, Pavlosky, Densmore, Schaefer and Williamson2011). Future studies should investigate if a reduction of glutamate levels can prevent further loss of brain tissue in the thalamus. This is clinically relevant since a recent meta-analysis found reduced NAA in antipsychotic-naïve/free patients (Iwata et al., Reference Iwata, Nakajima, Plitman, Mihashi, Caravaggio, Chung, Kim, Gerretsen, Mimura, Remington and Graff-Guerrero2018) suggesting reduced neuronal viability and density from illness onset. In ACC, levels of GABA and glutamate were lower in the patients at all examinations and not affected by monotherapy with aripiprazole. The few existing longitudinal studies of first-episode patients have reported equivocal results of the effect of treatment on glutamate and GABA levels in ACC. Three studies have reported no effect on glutamate levels after treatment with different antipsychotic compounds (Theberge et al., Reference Theberge, Williamson, Aoyama, Drost, Manchanda, Malla, Northcott, Menon, Neufeld, Rajakumar, Pavlosky, Densmore, Schaefer and Williamson2007; Bustillo et al., Reference Bustillo, Rowland, Mullins, Jung, Chen, Qualls, Hammond, Brooks and Lauriello2010; Aoyama et al., Reference Aoyama, Theberge, Drost, Manchanda, Northcott, Neufeld, Menon, Rajakumar, Pavlosky, Densmore, Schaefer and Williamson2011), and two studies have reported reductions in glutamate (Egerton et al., Reference Egerton, Broberg, Van Haren, Merritt, Barker, Lythgoe, Perez-Iglesias, Baandrup, During, Sendt, Stone, Rostrup, Sommer, Glenthoj, Kahn, Dazzan and McGuire2018) and GABA levels (de la Fuente-Sandoval et al., Reference de la Fuente-Sandoval, Reyes-Madrigal, Mao, Leon-Ortiz, Rodriguez-Mayoral, Jung-Cook, Solis-Vivanco, Graff-Guerrero and Shungu2017) after monotherapy with amisulpride and risperidone, respectively. It is possible that only certain antipsychotic compounds reduce levels of glutamate and GABA in ACC as indicated by preclinical studies (Bustillo et al., Reference Bustillo, Barrow, Paz, Tang, Seraji-Bozorgzad, Moore, Bolognani, Lauriello, Perrone-Bizzozero and Galloway2006; Yang and Wang, Reference Yang and Wang2008; Xu et al., Reference Xu, Gullapalli and Frost2015) and that reduction of glutamatergic metabolites mainly occur when levels are abnormally increased.
Strengths of the present study are a large sample of strictly antipsychotic-naïve patients with first-episode psychosis, measures of both glutamate and GABA levels, and follow-up examinations at both 6 and 26 weeks. Some limitations should, however, be considered. First, we used response criteria originally developed for remission in the chronic phase of schizophrenia (Andreasen et al., Reference Andreasen, Carpenter, Kane, Lasser, Marder and Weinberger2005). Second, the association between cellular mechanisms and 1H-MRS measures of whole tissue glutamate and GABA remains to be elucidated, and we cannot determine whether the MRS measures reflect glutamatergic abnormalities in synaptic transmission or metabolism (Rothman et al., Reference Rothman, De Feyter, de Graaf, Mason and Behar2011). Third, our GABA findings reflect GABA + macromolecules, with the latter being a potential confounder (Rothman et al., Reference Rothman, Petroff, Behar and Mattson1993). Last, we used glutamate/Cr as the main outcome. In 1H-MRS, total creatine (PCr + Cr) or water-scaled values corrected for CSF content in the voxel are commonly used as references, and at present, there is no consensus regarding the superiority of either method. The PCr + Cr peak at 3.03 ppm is considered stable despite brain pathologies because Cr plus PCr are in equilibrium (Saunders et al., Reference Saunders, Howe, van den Boogaart, Griffiths and Brown1999). Despite this, we observed that PCr + Cr in the thalamus was significantly lower at baseline in non-responders at 6 weeks compared with HCs. Therefore, we cannot rule out that baseline differences in PCr + Cr between non-responders at 6 weeks and HCs influenced thalamic levels of glutamate/Cr at baseline. However, no differences in PCr + Cr in the thalamus at baseline was observed in non-responders at 26 weeks compared with HCs, neither any baseline differences in PCr + Cr in the MEGAPRESS voxel measuring GABA, why it appears unlikely that the present findings can be explained by alterations in total creatine.
In conclusion, our findings suggest that increased glutamatergic neurotransmission in the thalamus and decreased GABAergic neurotransmission in ACC are part of the pathophysiology of first-episode psychosis and that aberrations in these neurotransmitters are driven by patients, who will not respond to antipsychotic treatment. Furthermore, monotherapy with aripiprazole and naturalistic antipsychotic treatment reduce glutamate levels in the thalamus, whereas glutamate and GABA levels in ACC are unaffected. If replicated, normative reference intervals for glutamate and GABA levels may aid estimation of clinical prognosis in patients with first-episode psychosis.
Supplementary material
The supplementary material for this article can be found at https://doi.org/10.1017/S0033291719002277
Acknowledgements
We thank Mikkel Erlang Sørensen for assistance with creating the figures.
Financial support
This work was supported by a Ph.D. grant from the Faculty of Health and Medical Sciences, the University of Copenhagen to KBB; Ph.D. grants from the Mental Health Services in the Capital Region of Denmark to KJ, AS, and KT; an independent grant from the Lundbeck Foundation (R155-2013-16337) to the Lundbeck Foundation Centre of Excellence for Clinical Intervention and Neuropsychiatric Schizophrenia Research (CINS) to BG; support from the Mental Health Services, Capital Region of Denmark to BG; a grant from the Gangsted Foundation to BG; and support from National Institute of Health (NIH) grants (P41EB015909, R01EB016089, R01EB023963, R01MH106564, and R21MH098228) to RAEE. The funding sources played no further role in the study design, collection, analysis, or interpretation of data, writing of the report, or the decision to submit the paper for publication.
Conflict of interest
BG is the leader of a Lundbeck Foundation Centre of Excellence for Clinical Intervention and Neuropsychiatric Schizophrenia Research (CINS), which is partially financed by an independent grant from the Lundbeck Foundation (R155-2013-16337) based on international review and partially financed by the Mental Health Services in the Capital Region of Denmark, the University of Copenhagen, and other foundations. Her group has also received a research grant from Lundbeck A/S for an additional independent investigator-initiated study. All grants are the property of the Mental Health Services in the Capital Region of Denmark and administrated by them. She has no other conflicts to disclose. Dr BE has received lecture fees and/or is part of Advisory Boards of Bristol-Myers Squibb, Eli Lilly and Company, Janssen-Cilag, Otsuka Pharma Scandinavia AB, Takeda Pharmaceutical Company and Lundbeck Pharma A/S. Mrs AS, and KT; and Drs KBB, KJ, RAEE, HBWL, ER, and BVB have no conflicts of interest to disclose.
Ethical standards
The authors assert that all procedures contributing to the Pan European Collaboration Antipsychotic-Naïve Study II (PECANSII) comply with the Danish Committee on Biomedical Research Ethics (H-3-2013-149) and with the Helsinki Declaration of 1975, as revised in 2008.


 Open access