


Introduction
Anorexia nervosa (AN) and bulimia nervosa (BN) are characterized by abnormal eating behavior, distorted thoughts surrounding food and elevated shape and weight concerns. They are serious conditions, afflicting 0.8–3.6% and 1–2.6% of the population, respectively (Mustelin et al., Reference Mustelin, Silén, Raevuori, Hoek, Kaprio and Keski-Rahkonen2016; Stice, Nathan Marti, & Rohde, Reference Stice, Nathan Marti and Rohde2013). AN is further classified into restrictive (AN-R) and binge-eating and purging (AN-BP) subtypes, where the latter resembles BN but with recurrent binge-eating and/or compensatory behaviors occurring while underweight (American Psychiatric Association, 2013a). Longitudinal studies have shown diagnostic ‘crossover’ from AN-BP to BN, but rarely from BN to AN-BP (Eddy et al., Reference Eddy, Dorer, Franko, Tahilani, Thompson-Brenner and Herzog2008, Reference Eddy, Tabri, Thomas, Murray, Keshaviah and Hastings2016), suggesting that these conditions may partly reflect dissociable etiologies. While dominant models of eating disorder (ED) development and treatment have emphasized psychological mechanisms, both experimental medicine (Misra & Klibanski, Reference Misra and Klibanski2014) and genome-wide association studies (Watson et al., Reference Watson, Yilmaz, Thornton, Hübel, Coleman, Gaspar and Bulik2019) have implicated metabolic dysfunction in their pathogenesis. Therefore, understanding how peripheral metabolic and endocrine signals interact with brain mechanisms to shape the characteristic behaviors and psychopathology of EDs remains an important challenge.
There is a growing knowledge of the role of circulating hormones as regulators of energy balance (Murphy & Bloom, Reference Murphy and Bloom2006). Gut hormones and neuropeptides have critical effects on eating behavior, which may be affected by the altered macronutrient intake (Van Avesaat, Troost, Ripken, Hendriks, & Aam, Reference Van Avesaat, Troost, Ripken, Hendriks and Aam2015) and chronic stress intrinsic to EDs (Culbert, Racine, & Klump, Reference Culbert, Racine and Klump2016b; Monteleone et al., Reference Monteleone, Castellini, Volpe, Ricca, Lelli, Monteleone and Maj2018). Indeed, pre-prandial levels of the orexigenic hormone, ghrelin, and satiety hormones, peptide tyrosine tyrosine (PYY) and cholecystokinin, are increased in AN and to a lesser degree in BN (Prince, Brooks, Stahl, & Treasure, Reference Prince, Brooks, Stahl and Treasure2009) compared to controls. Moreover, increased fasting levels of the anorexigenic neuropeptide, bone-derived neurotrophic factor, and decreased 24-h ghrelin have been reported in AN-BP relative to AN-R (Eddy et al., Reference Eddy, Lawson, Meade, Meenaghan, Horton, Misra and Miller2015; Germain et al., Reference Germain, Galusca, Grouselle, Frere, Billard, Epelbaum and Estour2010), though the precise associations with binge-eating are unknown. The normal postprandial decline in ghrelin and rise of the anorexigenic peptide, glucagon-like peptide-1 (GLP-1), is attenuated in BN (Dossat, Bodell, Williams, Eckel, & Keel, Reference Dossat, Bodell, Williams, Eckel and Keel2015; Naessen, Carlstrom, Holst, Hellstrom, & Hirschberg, Reference Naessen, Carlstrom, Holst, Hellstrom and Hirschberg2011), aligning with observations of reduced postprandial PYY, another satiety hormone, in both AN and BN (Prince et al., Reference Prince, Brooks, Stahl and Treasure2009).
Cortisol has been more extensively investigated in EDs, and both altered basal levels and reactivity have been reported [reviewed by Culbert et al. (Reference Culbert, Lavender, Crosby, Wonderlich, Engel, Peterson and Fischer2016a)]. Waking cortisol levels are typically elevated in AN and, to a lesser extent, in BN (Culbert et al., Reference Culbert, Racine and Klump2016b). The relative hypercortisolemia observed in acute AN may arise from elevated ghrelin and corticotropin-releasing factor levels that stimulate adrenocorticotropic hormone (ACTH) release and cortisol synthesis (Misra & Klibanski, Reference Misra and Klibanski2014). Therefore, cortisol upregulation could serve to maintain euglycemia in states of malnutrition, but this mechanism would not explain hypercortisolemia in BN, where individuals are not underweight. Intermittent dieting may stimulate hypothalamic–pituitary–adrenal (HPA) axis activity in BN, leading to elevated basal cortisol, but another possibility is that cortisol alterations relate to recurrent binge-eating (Culbert et al., Reference Culbert, Racine and Klump2016b).
A key consideration in this regard is stress, which precipitates binge-eating episodes in BN (Goldschmidt et al., Reference Goldschmidt, Wonderlich, Crosby, Engel, Lavender, Peterson and Mitchell2014). Stress may induce binge-eating via HPA axis activation; indeed, acute stress has elicited significant increases in cortisol, caloric consumption and preference for high-fat/high-sugar foods in lean healthy women (Epel, Lapidus, McEwen, & Brownell, Reference Epel, Lapidus, McEwen and Brownell2001; Torres & Nowson, Reference Torres and Nowson2007). Stress-induced cortisol responses have been positively correlated with food intake in binge-eating disorder (BED; Gluck, Geliebter, and Lorence, Reference Gluck, Geliebter and Lorence2004); however, this finding has neither been replicated (Rosenberg et al., Reference Rosenberg, Bloch, Ben Avi, Rouach, Schreiber, Stern and Greenman2013) nor tested in BN or AN-BP. Moreover, reports of blunted cortisol reactivity to acute stress in both BN (Ginty, Phillips, Higgs, Heaney, & Carroll, Reference Ginty, Phillips, Higgs, Heaney and Carroll2012; Monteleone et al., Reference Monteleone, Scognamiglio, Canestrelli, Serino, Monteleone and Maj2011; Pirke, Platte, Laessle, Seidl, & Fichter, Reference Pirke, Platte, Laessle, Seidl and Fichter1992) and a mixed sample of AN and BN (Het et al., Reference Het, Vocks, Wolf, Hammelstein, Herpertz and Wolf2015) could suggest divergent associations between stress, cortisol and eating behavior across disorders (i.e. stress-induced cortisol increases may potentiate binge-eating in one disorder but not another). Acute stress may alternatively augment ghrelin secretion, leading to increased food intake (Morris, Voon, & Leggio, Reference Morris, Voon and Leggio2018). Prolonged stress elicits ghrelin secretion in rodents (Ochi et al., Reference Ochi, Tominaga, Tanaka, Tanigawa, Shiba, Watanabe and Arakawa2008), and there is mixed evidence of increased plasma cortisol and ghrelin following acute stress in obesity and BED (Gluck, Yahav, Hashim, & Geliebter, Reference Gluck, Yahav, Hashim and Geliebter2014; Rouach et al., Reference Rouach, Bloch, Rosenberg, Gilad, Limor, Stern and Greenman2007). While acute stress augmented salivary ghrelin in a pilot study of BN (Monteleone et al., Reference Monteleone, Tortorella, Scognamiglio, Serino, Monteleone and Maj2012), salivary total ghrelin may not correlate with functionally active acyl ghrelin in plasma, warranting further study.
Although extant research has identified endocrine dysfunction in EDs, the confounds arising from low statistical power, unstandardized meals and variable hormone assays obfuscate associations with ED psychopathology. Moreover, examination of acute changes in psychological state and associations with hormonal markers will be central to the identification of physiological mechanisms that sub-serve binge-EDs. We therefore examined associations between acute, psychological stress and subsequent hormonal responses and food consumption in women with AN-BP, BN and matched controls. Participants completed remote saliva sampling prior to a 2-day, inpatient assessment of cognitive function, eating behavior and endocrine responses. The cortisol-awakening response (CAR) was assessed for 2 days and related to diagnosis, ED-related psychopathology and anthropometric measures. In an experimental manipulation, we related ED status and acute stress to circulating cortisol, acylated ghrelin, PYY and GLP-1 levels, as well as ad libitum food consumption in a custom-designed, naturalistic environment. We predicted elevated plasma ghrelin, cortisol, PYY and GLP-1 in both patient groups relative to controls, as well as an increased stress response, indexed as cortisol and ghrelin levels. We anticipated that, while ad libitum intake would be reduced in both AN-BP and BN compared to controls, intake in these groups would increase following experimentally induced stress. Finally, we completed exploratory analyses, examining associations between pre-prandial hormones and food intake.
Patients and methods
Participants
Eighty-five right-handed, women (M age ± s.d. = 23.96 ± 3.98 years) were recruited through advertisement in Cambridgeshire, on social media, via the B-eat charity and from the Cambridge and Peterborough Foundation Trust Adult Eating Disorders Service (AEDS).
English-speaking women between 18 and 40 years were eligible for the study. All ED participants met the Diagnostic and Statistical Manual of Mental Disorders 5th Edition (DSM-5; 4) criteria for current AN-BP or BN. The general exclusion criteria included left handedness, estimated IQ < 80, body mass index (BMI) > 29.9 kg/m2, magnetic resonance imaging (MRI) contraindications (e.g. pregnancy and some metallic implants), anemia or thyroid dysfunction, lactation, previous bariatric surgery and high nicotine dependence per the Fagerström Test for Nicotine Dependence (Heatherton, Kozlowski, Frecker, & Fagerström, Reference Heatherton, Kozlowski, Frecker and Fagerström1991). Healthy controls with a lifetime history of any psychiatric disorder were excluded. Additional exclusion criteria for ED participants included diagnoses of DSM-5 BED, neurodevelopmental disorders, lifetime serious mental illness (e.g. schizophrenia and bipolar disorder) or substance or alcohol use disorder within the past 6 months. Finally, ED participants from AEDS were only included after consultation with their clinician to ensure that participation would not negatively impact their health or ongoing treatment.
Participants provided written, informed consent prior to participation and received compensation for their time and travel expenses. The Cambridge East Research Ethics Committee (Ref. 17/EE/0304) approved the study. The authors assert that all procedures contributing to this work comply with the ethical standards of the relevant national and institutional committees on human experimentation and with the Helsinki Declaration of 1975, as revised in 2008.
Procedure
Following telephone pre-screening to determine initial eligibility, volunteers completed the DSM-5 Cross-Cutting Symptom Measure (American Psychiatric Association, 2013b) to rule out exclusionary psychopathology symptoms. Eligible volunteers then completed an outpatient screening prior to remote saliva sampling and an inpatient study session. An overview of the study design is shown in Fig. 1a and described here.
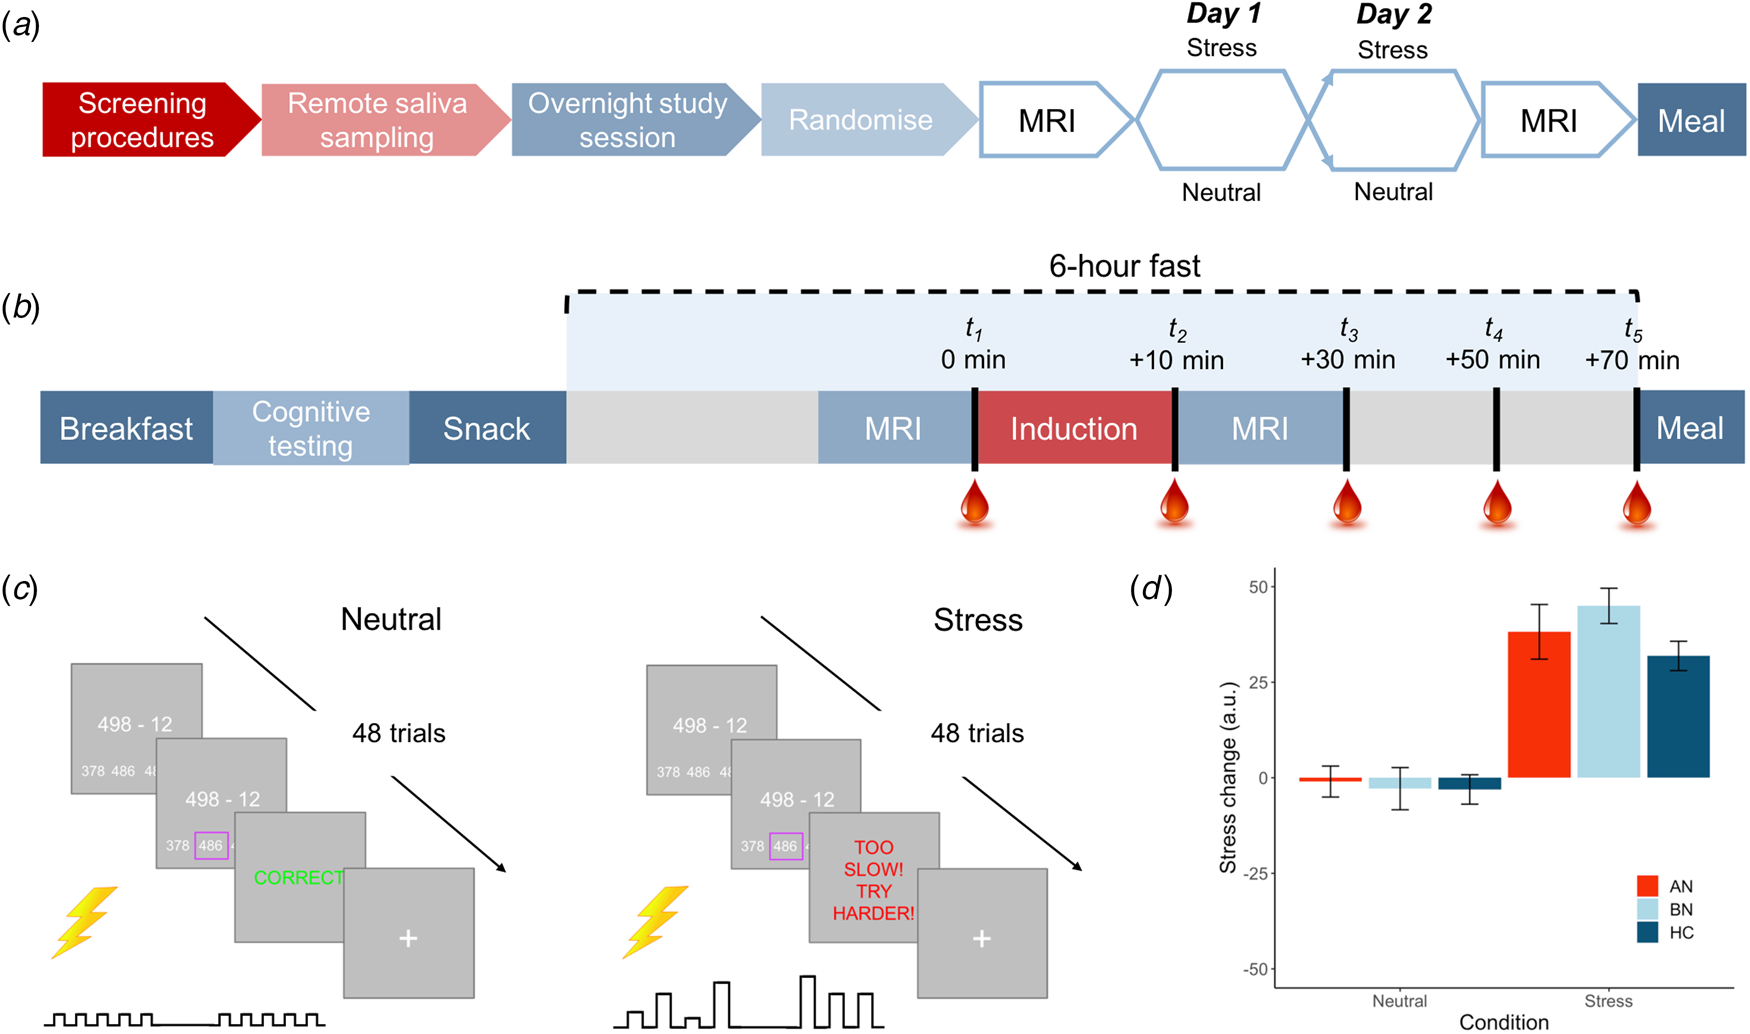
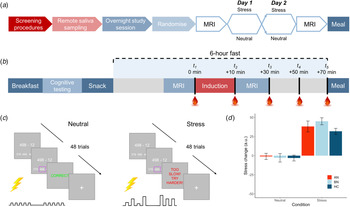
Fig. 1. Overview of study design and blood sampling protocol. (a) Following the screening session, participants completed remote saliva sampling prior to the 2-day, inpatient study session. Induction (stress v. neutral) order was counterbalanced among participants in each group. (b) Inpatient study session daily timeline. Participants were provided standardized meals prior to a 6-h fast on each day. Baseline blood samples were collected ~2 min prior to the start of the induction. Remaining samples were collected at T 2 M ± s.d. = 12.7 ± 2.7, T 3 = 33.5 ± 3.7, T 4 = 53.0 ± 3.8 and T 5 = 72.9 ± 4.6 min relative to baseline. (c) Trial structure for stress and control tasks. Both tasks involved 48 multiple choice maths problems that were matched on difficulty. For the stress induction, participants were told that they must meet the group average score; however, a sliding response window ensured low accuracy. Electrical stimulation was delivered to the participant's abdomen for both tasks; however, for the stress induction, it was delivered at unpredictable frequencies and intensities to induce uncertainty. Stimulation was highly predictable for the control task. (d) Manipulation check of change in subjective stress following neutral and stress induction. Stress ratings ranged from 0 = not at all to 100 = extremely. Error bars represent s.e.m.
Screening
One hundred volunteers underwent screening, where 12 ED participants completed the session remotely (see online Supplementary Material). All remaining participants attended screening sessions at Addenbrooke's hospital after an overnight fast. Following informed consent, a blood sample was collected and processed for full blood count and thyroid hormones. Next, height and weight were measured, and after a negative pregnancy test, body composition was determined via dual X-ray absorptiometry (GE Lunar iDXA). Following a light breakfast, participants completed the National Adult Reading Test (Blair & Spreen, Reference Blair and Spreen1989), an online progressive matrices test (Kosinski, Bachrach, Kasneci, Van-Gael, & Graepel, Reference Kosinski, Bachrach, Kasneci, Van-Gael and Graepel2012), the Structured Clinical Interview for DSM-5 (First, Williams, Karg, & Spitzer, Reference First, Williams, Karg and Spitzer2016), and the Eating Disorder Examination (EDE v16; Cooper and Fairburn, Reference Cooper and Fairburn1987), and they were given saliva-sampling materials.
Remote saliva sampling
Participants collected saliva samples using Salivette swabs (Sarstedt, UK) immediately upon waking and 30, 45 and 60 min after waking on 2 workdays of their choice. Participants were asked to awaken between 06.00 and 08.30 h and not to eat or drink during the hour of sample collection. If a participant was not in work, she was asked to collect the samples between Monday and Friday. Compliance and timing of sample acquisition were recorded in a study booklet.
Inpatient session
Fifteen participants were excluded following the screening session, leaving 85 women in the final sample (n = 22 AN-BP, n = 33 BN, n = 30 HC). A timeline of the 2-day inpatient study session is depicted in Fig. 1b. These sessions began at either 08.00 or 09.00 h, lasting no more than 36 h (one participant arrived late at 10.30 h). Upon admission, participants' height and weight were recorded on a seca 285 measuring station (seca GmbH & Co, Germany), and they were provided with standardized meals prior to a 6-h fast. During the fast, participants underwent functional MRI scanning, either an acute stress or neutral induction and blood sampling. The fast ended with a 30-min ad libitum meal, and an evening snack was offered at 19.00 h for those who had not met their estimated energy requirements (EER) in the buffet. Momentary mood ratings were collected (PANAS; Watson, Clark, and Tellegen, Reference Watson, Clark and Tellegen1988) at all meal times. On day 2, a blood sample was collected upon waking to assess sex hormones (to determine menstrual phase), as well as fasting insulin, glucose, potassium and leptin, which are reported as additional descriptors of metabolic function (online Supplementary Table S1). Then, the same testing schedule was repeated. ED participants continued any prescribed medication(s) throughout the study (online Supplementary Table S2).
Standardized meal plan and ad libitum meal
As macronutrient composition can impact on gut–brain signaling (Ren et al., Reference Ren, Ferreira, Zhou, Shammah-Lagnado, Yeckel and de Araujo2010), participants were provided fixed meals (50% carbohydrate, 35% fat and 15% protein) for breakfast and snacks (see online Supplementary Material; Table S3). Participants were offered 35% of their EER prior to fasting; however, given the nature of EDs, only healthy controls were asked to consume the full 35% of their EER.
The ad libitum meal included various sweet (e.g. grapes and biscuits) and savory (e.g. vegetable pasta and chicken goujons) foods that were selected due to their suitability for examining food choice behavior in an ED population (online Supplementary Table S4). Approximately 4060 kcal were available in the buffet. Prior to the meal, participants were told that they would be eating alone in a naturalistic lounge environment for 30 min, and they could eat as much or as little as they would like.
Acute stress induction
In each MRI session, participants completed either a stress induction or a control task (i.e. neutral condition) on each day (Fig. 1c), with order randomized across participants. The computerized induction incorporated three elements that reliably increase subjective stress and circulating cortisol: a motivated performance task, negative feedback on performance and threat uncertainty (Dickerson & Kemeny, Reference Dickerson and Kemeny2004). In both tasks, participants completed 48 multiple-choice math problems of equivalent difficulty while they received somatic distractors (i.e. trains of electrical shocks to the abdomen). Performance was not evaluated during the control task, but for the stress induction, participants were told that their performance must meet the group average. However, correct responses were penalized, resulting in a shorter response window and therefore poorer performance, and incorrect responses elicited negative feedback. Finally, threat uncertainty was induced through unpredictable sequences of mildly painful electrical stimulation, which has been shown to increase state anxiety (see online Supplementary Material; Carlsson et al. Reference Carlsson, Andersson, Petrovic, Petersson, Öhman and Ingvar2006; Grillon, Baas, Lissek, Smith, & Milstein, Reference Grillon, Baas, Lissek, Smith and Milstein2004). Subjective stress and hunger were recorded pre- and post-induction (0 = Not at all, 100 = Extremely; see online Supplementary Fig. S1 for stimulation ratings). The stress induction and control task lasted M ± s.d. = 7 ± 1 min and 9 ± 2 min, respectively.
Blood sampling protocol
An intra-venous cannula was inserted at least 1 h prior to blood sampling, which occurred between approximately 14.00 and 17.30 h on both days to control for diurnal fluctuations in cortisol. Blood samples were collected approximately 2 min pre- and post-induction, and three additional post-induction samples were collected at 20-min intervals. Plasma cortisol and ghrelin were assessed at all timepoints while PYY and GLP-1 were measured at timepoint 5 only.
Hormone assays
Full sample handling procedures for all hormone assays are described in the online Supplementary Material.
Analytic plan
Cortisol-awakening response analysis
We assessed the CAR using the linear mixed-effects modeling (LMM) package ‘nlme’ in R (Pinheiro, Bates, DebRoy, Sarkar, & Team, Reference Pinheiro, Bates, DebRoy, Sarkar and Team2016; R Core Team, 2015), where group, day and time were included as fixed effects, and random intercepts for time and day were nested within the random effect of the participant. To account for the nonlinear shape of CAR, we also included a quadratic time term in our model. Hormonal contraceptive use (i.e. oral, injection and implant) was entered as a binary covariate to control for reported effects on salivary cortisol (Boisseau et al., Reference Boisseau, Enea, Diaz, Dugué, Corcuff and Duclos2013). In addition to outlier observations (i.e. values ± 3 s.d.s from the mean per timepoint), five observations were excluded due to either contamination or incorrect timing of sample acquisition.
Commonality analysis
Associations between dimensional psychopathology measures and post-awakening cortisol were assessed using regression commonality analysis (R package ‘yhat’; Nimon, Oswald, and Roberts, Reference Nimon, Oswald and Roberts2013). This method extends multiple regression by decomposing the total variance explained by a given regression model (R 2) into unique and shared effects of each predictor (Ray-Mukherjee et al., Reference Ray-Mukherjee, Nimon, Mukherjee, Morris, Slotow and Hamer2014), increasing interpretability of beta estimates in instances of high multicollinearity between predictors. We modeled five predictors of interest, sum scores from the EDE Questionnaire (Fairburn & Beglin, Reference Fairburn and Beglin1994), Beck Depression Inventory-II (Beck, Steer, Ball, & Ranieri, Reference Beck, Steer, Ball and Ranieri1996), State and Trait Anxiety Inventory (Spielberger & Sydeman, Reference Spielberger and Sydeman1994), BMI, and total body fat, and contraceptive use. Area-under-the-curve estimates with respect to ground (AUCg) were calculated as summary measures of post-awakening cortisol using ‘MESS’ and ‘dplyr’ R packages and averaged across days.
Acute stress reactivity analyses
Associations between group, acute stress and plasma cortisol, ghrelin, PYY, GLP-1 and food consumption were tested using LMM. Fixed effects of group and induction condition (stress and neutral) were included in all models, and a random intercept for condition was nested within the random effect of the participant. As cortisol and ghrelin were measured over time, these models included fixed effects (linear and quadratic) and a random intercept for time. A five-level factor of menstrual phase [amenorrhea (n = 9), follicular (n = 17), luteal (n = 22), periovulatory (n = 5) and hormonal contraceptive use (n = 32)] was included as a covariate in the plasma cortisol model. Finally, exploratory correlation analyses related pre-prandial hormone levels (i.e. timepoint 5) on stress and neutral days to ad libitum consumption, pre-prandial negative affect (NA), BMI and objective binge-eating (OBE) counts.
One participant declined to provide blood samples, leaving 84 participants for analysis. For each assay, hemolyzed samples and outlier values were excluded from analysis. Assays that demonstrated a log-normal distribution were log-transformed prior to analysis. Results were Bonferroni corrected for five LMMs, yielding an alpha threshold of p = 0.01 (0.05/5). Findings were considered ‘nominally significant’ if corresponding p values were ⩽0.05 but >0.01. Correlation analyses were adjusted for multiple comparisons via false discovery rate correction.
Results
Demographics
Groups were matched on age and estimated IQ, and BN and HC groups were BMI-matched (t (61) = 0.19, p = 0.85; Table 1). Women with AN-BP had a greater lifetime incidence of AN-R (64% v. 30%; p = 0.015) while excessive exercise episodes were more frequent in BN (11 ± 9 v. 7 ± 14; p = 0.04). All remaining clinical variables (e.g. binge-eating/purging episodes, psychiatric comorbidity and medication use) were comparable across patient groups (Table 1).
Table 1. Clinical and demographic information by group
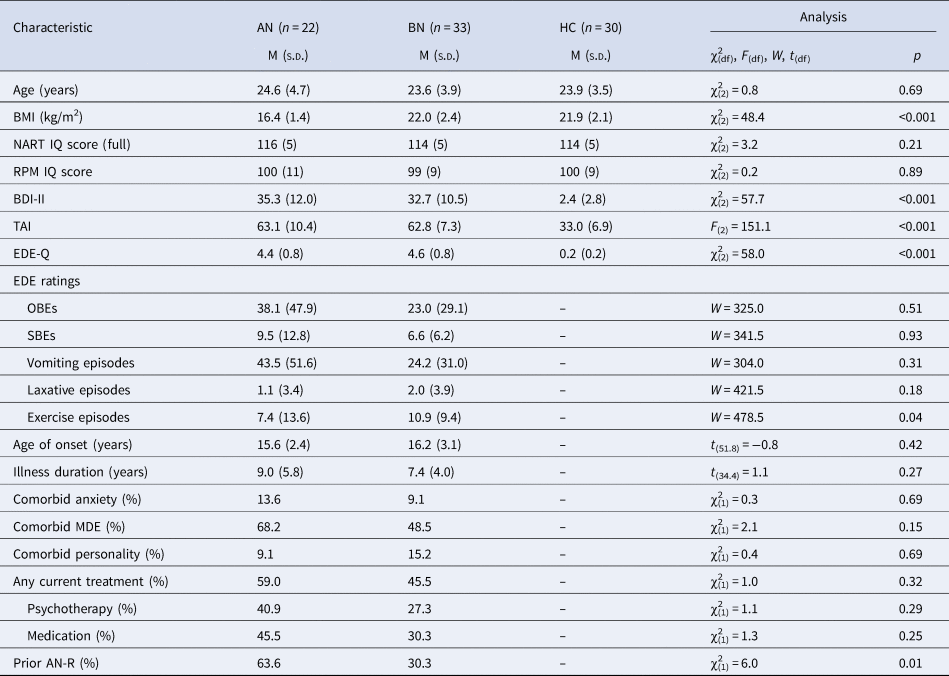
BMI, body mass index; NART, National Adult Reading Test; RPM, Online Raven's Progressive Matrices; BDI-II, Beck Depression Inventory-II; TAI, Trait Anxiety Inventory; EDE-Q, Eating Disorder Examination Questionnaire; EDE, Eating Disorder Examination; OBE, objective binge-eating episode; SBE, subjective binge-eating episode; MDE, major depressive episode; AN-R, anorexia nervosa restrictive subtype.
EDE ratings reflect counts over the previous 28 days. Group differences were evaluated using one-way ANOVA and, for non-normally distributed data, the nonparametric Kruskal–Wallis test. The two-samples t test (two-sided), Mann–Whitney U test and chi-square test were used to assess differences between AN and BN groups.
Salivary CAR
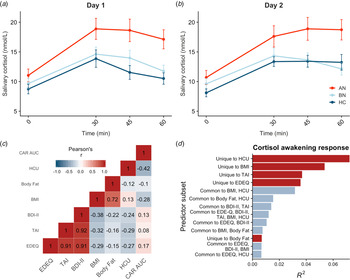
Saliva samples were unavailable for two participants, so the final sample included 83 participants. Salivary cortisol was elevated in AN-BP compared to controls (β = 4.08, t (79) = 2.92, p = 0.005), but differences between BN and control groups were nonsignificant (p = 0.81; Fig. 2a, b). The main effect of time (β linear = 40.54, t (479) = 9.93, p < 0.001; β quadratic = −38.60, t (479) = −9.45, p < 0.001) was also significant, showing nonlinear increases in cortisol over time that are characteristic of CAR. Moreover, a significant group-by-timelinear interaction confirmed greater CAR in AN-BP relative to controls (β = 38.20, t (475) = 3.66, p = 0.0003). Contraceptive use was related to reduced salivary cortisol (β = −3.15, t (79) = −2.84, p = 0.006). Model fit indices supported the inclusion of a quadratic term for time (χ2(1) = 82.63, p < 0.0001) and the interaction term (χ2(4) = 20.27, p < 0.0001).
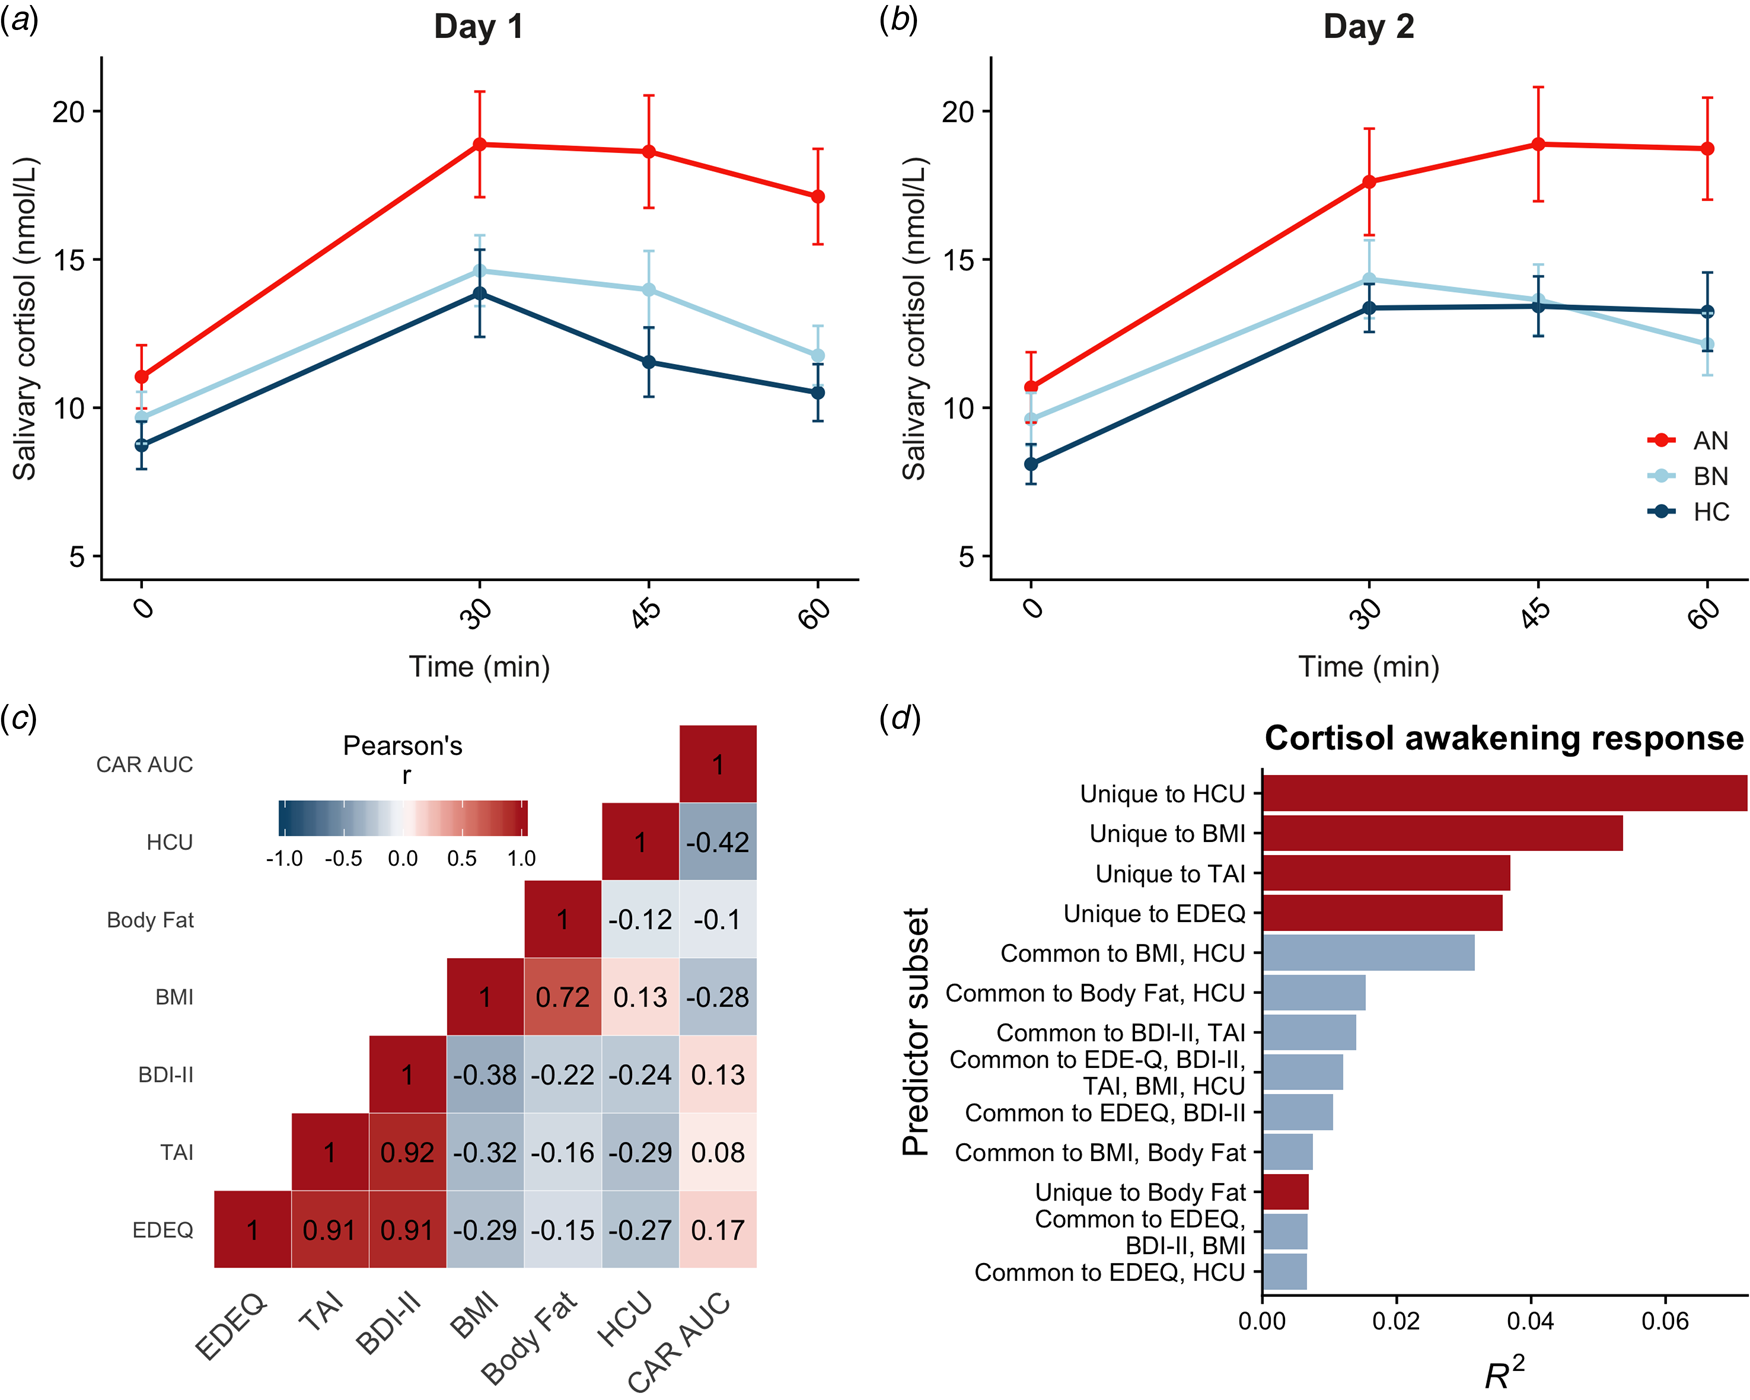
Fig. 2. Diagnostic and dimensional correlates of salivary CAR. (a, b) Salivary CAR was augmented in women with AN-BP relative to controls across 2 days of sampling. (c) Correlation matrix of commonality analysis variables, showing strong correlations between several predictors. (d) Commonality R 2 estimates for dimensional predictor combinations explaining the most variance in post-awakening cortisol (AUCg). All depicted subsets explained at least 2% of total variance in AUCg (R 2 = 0.22). Errors bars depict s.e.m. EDEQ, Eating Disorder Examination Questionnaire; TAI, Trait Anxiety Inventory; BDI-II, Beck Depression Inventory-II; BMI, body mass index; HCU, hormonal contraceptive use.
Associations between psychopathology, anthropometric measures and post-awakening cortisol
Commonality analyses were completed in the 80 participants with AUCg estimates for both days. Of the six predictors, hormonal contraceptive use and BMI, but not total body fat, were negatively associated with post-awakening cortisol (Table 2). In addition, we used commonality analysis to partition total variance into that uniquely attributable to each predictor and that shared across predictor sets. Hormonal contraceptive use accounted for the most variance in cortisol AUCg, as evidenced by both its unique effect and its shared effects with other predictors, namely BMI (Fig. 2d). Both ED and anxiety symptomatology explained unique variance in cortisol AUCg, but depressive symptoms did not.
Table 2. Regression results for psychopathology symptoms predicting salivary CAR

* = p < .05.
r, predictor's structure coefficient; Unique, predictor's unique effect; Common, summed predictor's common effects; Total, Unique + Common; % R 2, Total/R 2.
Manipulation check
Compared to the neutral condition, participants reported greater post-induction stress (β = 41.14, t (84) = 11.98, p < 0.001; Fig. 1c) and increased NA at pre-meal, post-meal and 30 min post-meal timepoints (β = 1.40, t (84) = 2.98, p = 0.004) following the stress induction. Math accuracy was significantly lower in the stress induction (β = −21.77, t (84) = −15.73, p < 0.001). While both AN-BP (β = 9.12, t (82) = 6.20, p < 0.001) and BN (β = 8.95, t (82) = 6.77, p < 0.001) reported greater NA relative to controls, a group-by-condition interaction was nonsignificant (χ2(2) = 5.18, p = 0.08), suggesting that the induction was similarly effective across groups.
Associations between acute stress and hormone profiles
Plasma cortisol
Both AN-BP (β = 0.23, t (77) = 4.72, p < 0.001) and BN (β = 0.20, t (77) = 4.97, p < 0.001) groups had increased cortisol (log-transformed) compared to controls (Fig. 3a). Cortisol significantly increased over time (β linear = 0.27, t (624) = 2.57, p = 0.01), and the shape of this association was nonlinear (β quadratic = 0.34, t (624) = 3.20, p = 0.001). The main effects of condition and menstrual phase were nonsignificant (all p's > 0.05), except for nominally increased cortisol in amenorrhea compared to hormonal contraceptive users (β = 0.13, t (77) = 2.08, p = 0.04). Finally, a nominally significant group-by-condition interaction indicated decreased cortisol reactivity to acute stress in BN, but not AN-BP, compared to controls (β = −0.10, t (81) = −2.23, p = 0.028). Both quadratic time (χ2(1) = 10.36, p = 0.001) and interaction (χ2(2) = 6.07, p = 0.048) terms significantly improved model fit indices.
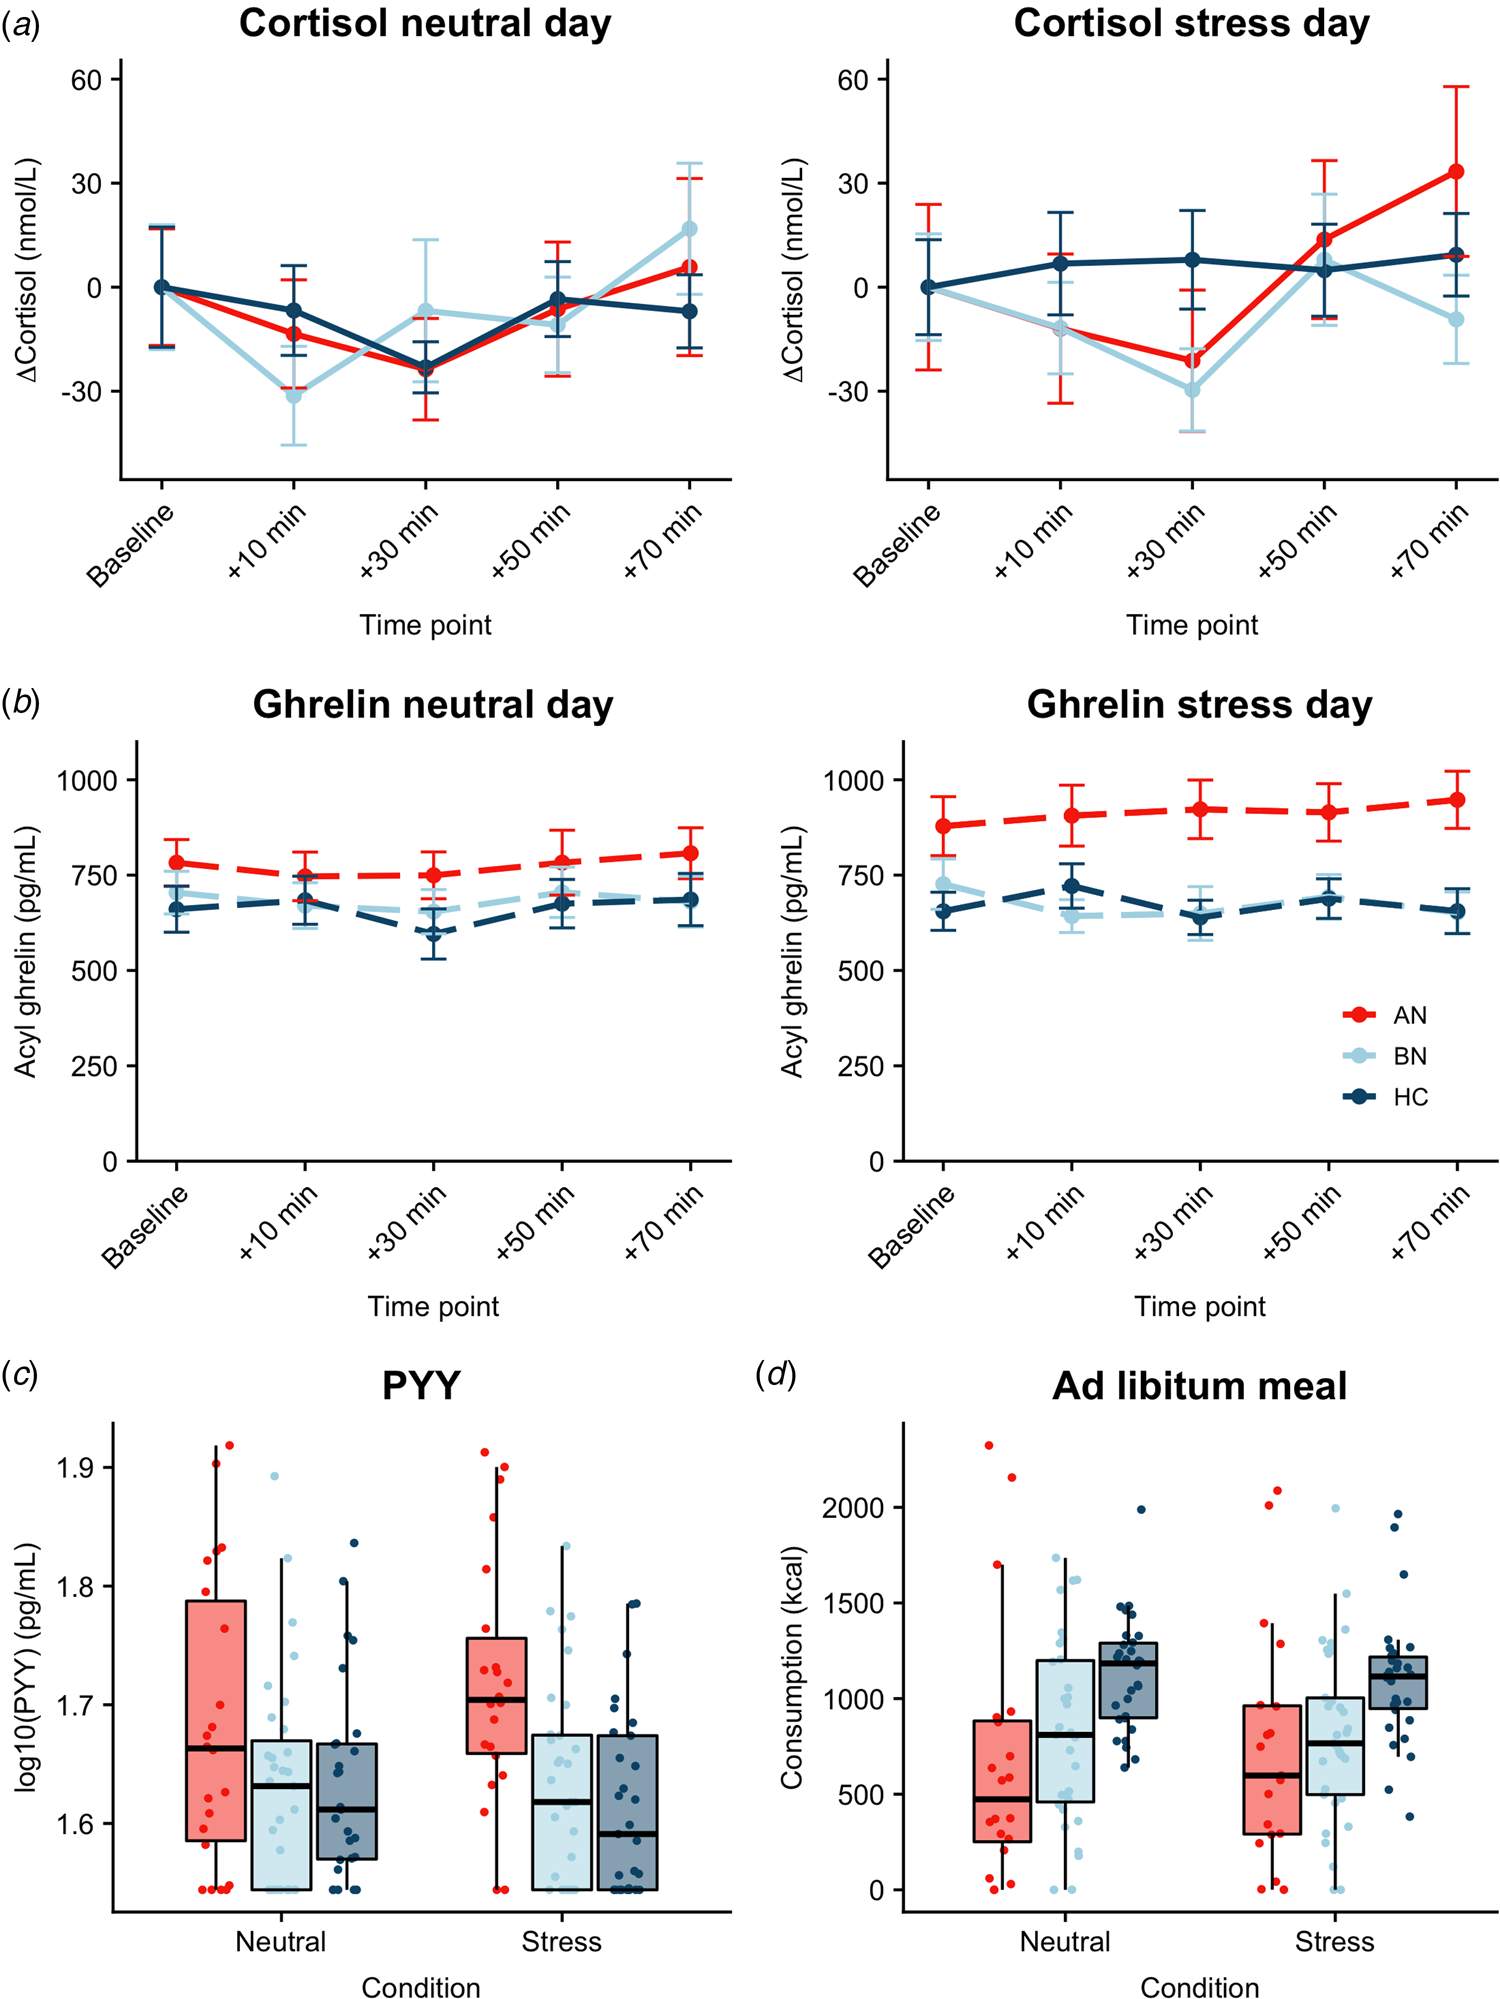
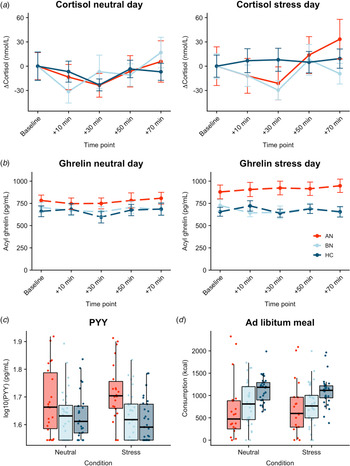
Fig. 3. Associations between acute psychological stress and metabolic markers. (a) Change in plasma cortisol relative to baseline by condition. Compared to controls, plasma cortisol was increased in both AN-BP (p < 0.001) and BN (p < 0.001), yet cortisol reactivity (shown here) was nominally reduced following stress in BN relative to controls (p = 0.028). A group-by-condition interaction showed augmented functionally active ghrelin (p = 0.007) (b) and PYY (p = 0.003) (c) in AN-BP after stress. (d) Ad libitum consumption was reduced in AN-BP (p = 0.005) and nominally in BN (p = 0.016) compared to controls, and stress did not alter consumption. Error bars represent s.e.m.
Acyl ghrelin
Three participants had outlier acyl ghrelin values across multiple timepoints and were excluded from analysis. The main effect of condition was nominally significant (β = 39.90, t (78) = 1.99, p = 0.049), with increased ghrelin following acute stress (Fig. 3b). The main effects of group and time were nonsignificant, and the inclusion of a quadratic time term did not significantly improve model fit (χ2(1) = 3.15, p = 0.08). A significant group-by-condition interaction indicated increased ghrelin levels in AN-BP relative to controls following acute stress (β = 134.0, t (76) = 2.77, p = 0.007), and the interaction term significantly improved model fit indices (χ2(2) = 6.50, p = 0.01).
PYY
Fasting PYY levels (log-transformed) were elevated in women with AN-BP (β = 0.08, t (80) = 3.12, p = 0.003), but women with BN did not differ significantly from controls (p = 0.64). The main effect of condition was nonsignificant (p = 0.79). Moreover, a significant group-by-condition interaction showed augmented PYY in AN-BP compared to controls after stress (β = 0.05, t (76) = 3.11, p = 0.003; Fig. 3c). Inclusion of the interaction term significantly improved model fit indices (χ2(2) = 9.94, p = 0.007).
GLP-1
No significant main or interaction effects were found with GLP-1 (log-transformed, all p's > 0.43).
Associations between acute stress and meal consumption
As one participant reported severe nausea prior to the buffet meal and another declined initiating the meal on day 2, we modeled observations from 83 participants. AN-BP (β = −373.53, t (77) = −2.90, p = 0.005; Fig. 3d) and BN (β = −284.18, t (77) = −2.47, p = 0.016) groups consumed fewer kilocalories than controls; however, this effect was only nominally significant in BN. The main effect of condition was nonsignificant, and the addition of a covariate for menstrual phase did not explain additional variance in consumption (χ2(5) = 6.26, p = 0.18). Moreover, the group-by-condition interaction term did not significantly improve model fit (χ2(2) = 2.60, p = 0.27).
Exploratory analysis of pre-prandial hormones and eating behavior
Correlation analyses largely recapitulated LMM results (see online Supplementary Fig. S2; Tables S5 and S6). Although pre-prandial hormone levels were not significantly correlated with food intake, pre-meal cortisol on the neutral day, but not following stress, was positively correlated with OBEs.
Robustness checks
As visual inspection of the salivary cortisol and ghrelin model residuals indicated slight deviations from normality, we conducted a robustness check after excluding observations whose residuals were ±2 s.d. from the mean. Robustness results aligned with the initial estimates of both models (see online Supplementary Material).
Discussion
This study examined whether peripheral metabolic markers differentiated patients with AN-BP and BN from unaffected women and, critically, whether acute stress modulated plasma ghrelin, cortisol, PYY and GLP-1 in these groups. We report three key findings. First, salivary CAR was elevated in AN-BP, but not BN, compared to controls. Second, both AN-BP and BN groups had increased plasma cortisol, and a condition-by-group interaction indicated nominally reduced cortisol reactivity in BN compared to controls. Third, acyl ghrelin and PYY showed elevated acute stress responses in the AN-BP group, whereas responses in the BN group did not significantly differ from controls. Finally, both patient groups consumed less compared to controls in a naturalistic, ad libitum meal, and consumption was unchanged following acute stress.
Our findings extend previous reports of elevated waking cortisol in mixed samples of AN-R and AN-BP (Monteleone et al., Reference Monteleone, Monteleone, Serino, Amodio, Monaco and Maj2016; Monteleone, Scognamiglio, Monteleone, Perillo, & Maj, Reference Monteleone, Scognamiglio, Monteleone, Perillo and Maj2014), by demonstrating this effect in an AN-BP group. To identify potential sources of this variation, we examined relative influences of dimensional psychopathology scores and anthropometric features on post-awakening cortisol in the full sample. Of our variables of interest, BMI explained the most variability (36%) in post-awakening cortisol, which might suggest that the observed differences in AN-BP largely reflect low body mass as opposed to binge-eating and purging per se. Indeed, examination of acutely ill and weight-restored AN has indicated that CAR augmentation is specific to low-BMI states (Monteleone et al., Reference Monteleone, Monteleone, Serino, Amodio, Monaco and Maj2016), and this may explain the absence of CAR alterations in BN in both the present study and previous research (Monteleone et al., Reference Monteleone, Scognamiglio, Monteleone, Perillo and Maj2014).
Both ED groups had increased total cortisol relative to controls, yet reduced cortisol reactivity following acute stress was only found in BN. As such, despite normative CAR, individuals with BN exhibited alterations in other indicators of HPA axis activity, namely elevated basal activation and blunted reactivity (Het et al., Reference Het, Vocks, Wolf, Hammelstein, Herpertz and Wolf2015; Pirke et al., Reference Pirke, Platte, Laessle, Seidl and Fichter1992). Aberrant cortisol reactivity has been reported in various mental illnesses (Zorn et al., Reference Zorn, Schür, Boks, Kahn, Joëls and Vinkers2017); however, as our BN finding was nonsignificant at a corrected alpha threshold, interpretations should be made cautiously. Exploratory analyses identified a weak, positive association between neutral day, pre-prandial cortisol and OBEs in our full sample, which was nonsignificant following stress. Taken together, results might suggest that stress-induced cortisol decreases relate to binge-eating in BN, but future efforts should test this hypothesis directly.
We observed elevated PYY in AN-BP, extending similar observations in AN-R (Nakahara et al., Reference Nakahara, Kojima, Tanaka, Yasuhara, Harada, Sagiyama and Inui2007; Utz et al., Reference Utz, Lawson, Misra, Mickley, Gleysteen, Herzog and Miller2008) and purging disorder (Keel et al., Reference Keel, Eckel, Hildebrandt, Haedt-Matt, Appelbaum and Jimerson2018), and strikingly, acute stress increased both the hunger hormone, acyl ghrelin, and the satiety hormone, PYY, in AN-BP compared to controls. The elevation of both hunger and satiety peptides suggests a significant dysregulation of peripheral hunger and satiety signaling in AN-BP. This may relate to difficulties in sensing hunger and internal energy state that occur in AN (Holsen et al., Reference Holsen, Lawson, Blum, Ko, Makris, Fazeli and Goldstein2012). Critically, the poor precision of these vital, bottom-up signals may increase the contribution of top-down, cognitive control of food intake, making individuals vulnerable to abnormal intake (i.e. restriction and binge-eating) under stress.
The stress-induced ghrelin and PYY increases could reflect the altered sympathetic nervous system activity intrinsic to the stress response (Stengel & Taché, Reference Stengel and Taché2009). For example, preclinical research has shown that both circulating catecholamines [e.g. (nor)adrenaline] and direct stimulation of gastrointestinal sympathetic nerves augment ghrelin secretion in rodents (de la Cour, Norlén, & Håkanson, Reference de la Cour, Norlén and Håkanson2007; Mundinger, Cummings, & Taborsky, Reference Mundinger, Cummings and Taborsky2006). Similarly, while L cells in the ileum and colon largely release PYY in response to nutrient sensing (Onaga, Zabielski, & Kato, Reference Onaga, Zabielski and Kato2002), catecholamines can also induce PYY secretion via activation of L cell beta-adrenoreceptors (Brechet et al., Reference Brechet, Plaisancié, Dumoulin, Chayvialle, Cuber and Claustre2001). Both gastric ghrelin and enteroendocrine L cells are enriched for several G protein-coupled receptors, including the melanocortin-4 receptor (MC4R), whose activation stimulates ghrelin (Engelstoft et al., Reference Engelstoft, Park, Sakata, Kristensen, Husted, Osborne-Lawrence and Schwartz2013) and PYY secretion (Cox et al., Reference Cox, Tough, Woolston, Zhang, Nguyen, Sainsbury and Herzog2010; Panaro et al., Reference Panaro, Tough, Engelstoft, Matthews, Digby, Møller and Cone2014). Although an endogenous peptide capable of activating MC4R in gastric ghrelin or L cells has not been identified, the most prevalent circulating melanocortin, ACTH, is one candidate. Acute stress stimulates ACTH release from the pituitary, which could theoretically activate gastric ghrelin and L cell MC4R to induce ghrelin and PYY release. However, our finding of significant alterations in AN-BP and not BN suggests that this may only occur in underweight, where HPA axis activity is significantly perturbed at baseline.
Despite notable strengths in our rigorous, inpatient design, several limitations should be considered. First, due to the nature of AN-BP and BN, pre-fast energy intake could not be strictly controlled to the same degree as in controls. Permitting this was crucial for many patient participants for whom enforced consumption is extremely distressing, and many requested reassurance on this prior to participation. Moreover, in recruiting a representative sample of ED participants, a majority had comorbid psychopathology and many used prescribed medication as expected. The effects of these factors on metabolic-signaling are unknown. Acute stress responses may be influenced by hormonal contraceptive use, which although accounted for statistically, could have impacted cortisol reactivity (Roche, King, Cohoon, & Lovallo, Reference Roche, King, Cohoon and Lovallo2013). Additionally, participants self-reported waking time for CAR sampling; however, future studies should incorporate objective monitoring methods (Stalder et al., Reference Stalder, Kirschbaum, Kudielka, Adam, Pruessner, Wüst and Clow2016). Post-stress laboratory eating behavior likely differs from that in daily life as previously suggested by discordant findings from laboratory (Wildes, Marcus, Bright, & Dapelo, Reference Wildes, Marcus, Bright and Dapelo2012) and real-world (Culbert et al., Reference Culbert, Lavender, Crosby, Wonderlich, Engel, Peterson and Fischer2016a) investigations of NA in AN. Finally, our study was not designed to directly interrogate associations between hormones and binge-eating, and integration of metabolic profiling with real-world, experience sampling of eating patterns is warranted.
Our results support previous suggestions of distinct physiological profiles in AN and BN despite similar psychopathology symptoms (Kaye, Berrettini, Gwirtsman, & George, Reference Kaye, Berrettini, Gwirtsman and George1990), for the first time identifying differing hormonal responses to psychological stress in AN-BP and BN compared to unaffected women. Individuals with BN demonstrate normative gut hormone profiles at baseline and following stress; however, there is some evidence of reduced cortisol reactivity to stress. In contrast, AN-BP can be conceptualized as a state of extreme stress, in which chronic malnutrition elicits profound metabolic changes to maintain homeostasis. This would account for markedly elevated CAR and high cortisol levels irrespective of experimental stress induction. We suggest that, in the context of chronic metabolic dysfunction, acute stress exacerbates the broader ‘physiological alarm’ system in AN-BP, which may contribute to the maintenance of abnormal eating by impaired interoceptive signaling. Our findings illustrate potential mechanisms that link psychopathology to metabolic signaling, lending important insights into the etiology of EDs.
Supplementary material
The supplementary material for this article can be found at https://doi.org/10.1017/S0033291720001440.
Acknowledgements
The authors wish to thank the participants for their time and the nursing staff for assisting the study protocol. They also thank the B-eat eating disorder charity for advertising the study. Funding was provided by the Bernard Wolfe Health Neuroscience Fund to PCF and HZ and a Wellcome Trust Investigator Award to PCF (Reference No. 206368/Z/17/Z). MLW was supported through the NIH-Oxford-Cambridge Scholars Program and a Cambridge Trust fellowship. FM was supported by research grants from Versus Arthritis, the Experimental Psychological Society, and a Career Development Award from the Medical Research Council (MR/T010614/1). The Core Biochemical Assay Laboratory provided technical support in terms of hormone assays. The Wellcome Trust/NIHR Clinical and Translational Research Facilities provided equipment and support staff for the study.
Conflict of interest
None.


 Open access