


Introduction
In 2017, the World Health Organization reported that major depressive disorder (MDD) was the second most prevalent disorder globally, affecting more than 300 million people worldwide (WHO, 2017). According to the Diagnostic and Statistical Manual of Mental Disorders, 5th Edition (DSM-5) criteria for MDD, at least five of the following symptoms (i.e. persistently low or depressed mood, anhedonia or decreased interest in pleasurable activities, feelings of guilt or worthlessness, lack of energy, poor concentration, appetite changes, psychomotor retardation or agitation, sleep disturbances, or suicidal thoughts) need to be present during the same 2-week period. And of them, at least one must be either depressed mood or loss of interest (or pleasure) (Bains & Abdijadid, Reference Bains and Abdijadid2022). Even though these symptoms are still defining features of MDD, there is a growing consensus that the scope of evaluation should include broader dimensions (Zhao et al., Reference Zhao, Wang, Wu, Hu, Niu, Wang and Wang2017), for instance, functioning (e.g. social and occupational functioning impairments that disrupt work, school, leisure, family life activities, and family responsibilities) (Sheehan, Nakagome, Asami, Pappadopulos, & Boucher, Reference Sheehan, Nakagome, Asami, Pappadopulos and Boucher2017) and quality of life (QOL) (e.g. subjective evaluation covering physical, mental, and social domains) (Rapaport, Clary, Fayyad, & Endicott, Reference Rapaport, Clary, Fayyad and Endicott2005; Yang et al., Reference Yang, Wu, Cao, Wang, Su, Huang and Fang2021).
In fact, depressive symptoms, functional impairment, and QOL are significantly inter-correlated (Greer, Kurian, & Trivedi, Reference Greer, Kurian and Trivedi2010; Prelipceanu, Purnichi, Marinescu, & Matei, Reference Prelipceanu, Purnichi, Marinescu and Matei2015). For example, some cohort studies suggested that depression may lead to functional disability, a type of functional impairment (De Ronchi et al., Reference De Ronchi, Bellini, Berardi, Serretti, Ferrari and Dalmonte2005; Esposito et al., Reference Esposito, Giunta, Nanni, Criscuolo, Manfreda, Del Duca and Troisi2021; Simning & Seplaki, Reference Simning and Seplaki2020), while some other studies indicated that functional disability may increase the risk for subsequent depression (Lyness, Caine, Conwell, King, & Cox, Reference Lyness, Caine, Conwell, King and Cox1993; Noh, Kwon, Park, Oh, & Kim, Reference Noh, Kwon, Park, Oh and Kim2016). In some studies, QOL predicted increased work disability (Koivumaa-Honkanen et al., Reference Koivumaa-Honkanen, Koskenvuo, Honkanen, Viinamäki, Heikkilä and Kaprio2004), whereas some other studies indicated that functional impairment could be an important determinant of QOL, since it occurs early in the course of the disorder and has a significant impact on daily living (Domínguez-Martínez, Kwapil, & Barrantes-Vidal, Reference Domínguez-Martínez, Kwapil and Barrantes-Vidal2015). It has also been proposed that the experience of disability partially mediates the relationship between symptoms and QOL (Hambrick, Turk, Heimberg, Schneier, & Liebowitz, Reference Hambrick, Turk, Heimberg, Schneier and Liebowitz2003). However, the causal relationship between depressive symptoms, disability, and QOL has not been elucidated.
Moreover, individual depressive symptoms may be differentially associated with functional impairments and QOL (Fried et al., Reference Fried, von Stockert, Haslbeck, Lamers, Schoevers and Penninx2020; Gollan et al., Reference Gollan, Fava, Kurian, Wisniewski, Rush, Daly and Trivedi2012). There is a growing need to identify the domain-specific relationships between depressive symptoms, dysfunction, and QOL that might aid in the identification of treatment targets for specific symptoms to improve functioning and QOL. The STAR*D study found that a sad mood and concentration problems had the highest unique associations with dysfunction, whereas hypersomnia, mid-nocturnal insomnia, and weight problems exhibited little contributions to functional impairment (Fried & Nesse, Reference Fried and Nesse2014). Another study found that motivational deficits (reduced interest and drive to initiate and maintain goal-directed activities) demonstrated the most robust impact on functional outcomes (Fervaha, Foussias, Takeuchi, Agid, & Remington, Reference Fervaha, Foussias, Takeuchi, Agid and Remington2016). In terms of QOL, individuals who are depressed may report poorer QOL caused by distress associated with core depressive symptoms, such as negative thinking and low mood (Tang, Thomas, & Larkin, Reference Tang, Thomas and Larkin2019). Wang et al. reported that cognitive symptoms were particularly associated with QOL (Wang, Tan, Ren, & Hammer-Helmich, Reference Wang, Tan, Ren and Hammer-Helmich2020). Self-stigma level has also been reported to have a negative impact on QOL in patients with MDD (Holubova et al., Reference Holubova, Prasko, Ociskova, Marackova, Grambal and Slepecky2016). However, it remains unclear whether certain symptoms are more impairing than others, and if so, what the magnitude of these differences might be.
The network approach is a promising solution as it brings a novel network perspective relating to psychopathology. It would provide unique information on dynamic and causal relationships among depressive symptoms (Borsboom, Reference Borsboom2017) using a developing methodology (Smith et al., Reference Smith, Mason, Crosby, Cao, Leonard, Wetterneck and Moessner2019). The network theory posits that different symptoms are not equivalent or interchangeable (Fried, Reference Fried2017). Recent applications of Bayesian approaches based on the directed acyclic graph (DAG) helped researchers to find the critical pathways of activation among symptoms (McNally, Reference McNally2016). And causality could be inferred by examining the dominant pathways of activation that lead to social dysfunction and a reduction in life satisfaction (Moffa et al., Reference Moffa, Catone, Kuipers, Kuipers, Freeman, Marwaha and Bebbington2017). These methods may propose new directions to improve treatment and may promote a more appropriate allocation of scarce medical resources (O'Driscoll et al., Reference O'Driscoll, Buckman, Fried, Saunders, Cohen, Ambler and Pilling2021).
Based on this background, we hypothesized that there are potential sequential relationships among dimensions of depressive symptoms, functional impairment, and QOL. In addition, we hypothesized that clinical symptoms and dysfunction have domain-specific associations with QOL. These hypotheses were tested on a large sample of patients with MDD using undirected network analyses and DAG.
Methods
Participants and study design
This was a multicenter and prospective project featuring two studies with consistent criteria for enrollment and intervention in the acute phase. The project was conducted at 12 sites in 11 governances of China, including Beijing, Guangdong, Xi'an, Hebei, Shaanxi, Yunnan, Heilongjiang, Jiangsu, Shanghai, Shanxi, Sichuan, and Shenzhen covering the east, south, north, and west of China. These 12 hospitals are located in densely populated cities, of which eight were general hospitals and four were psychiatric hospitals. The patients were enrolled from 9th November 2016 to 30th December 2020. The protocol of the study was approved by the Institutional Review Board (IRB) of Beijing Anding Hospital and an independent medical ethics committee board for all sites. Written informed consent was obtained from all participants. The study protocol was registered and several biomarker studies using single-center biological data have been published (Yang et al., Reference Yang, Zheng, Li, Wu, Tan, Zhou and Xie2020, Reference Yang, Zhou, Zhou, Wang, Sun, Zhu and Wang2022; Zhou et al., Reference Zhou, Zhou, Sun, Feng, Zhu, Yang and Wang2021)
The participants were aged 18–65 years and had been diagnosed with MDD according to the Diagnostic and Statistical Manual of Mental Disorders, Fourth Edition (DSM-IV) criteria. A total score of the 17-item Hamilton Rating Scale for Depression (HAMD-17) ⩾ 14, and a total score on the 16-item Quick Inventory of Depressive Symptoms-Self-Report (QIDS-SR16) ⩾ 11 were required. Patients with serious physical diseases and female patients who were pregnant were excluded. Patients at high risk of suicidal ideation (determined by a HAMD-17 item-3 score >2 points) were not included. Patients were excluded if they had used antidepressants continuously for more than 7 days in the most recent 14 days. A total of 1487 patients were enrolled; 102 cases were excluded due to incomplete questionnaires.
The interviews were conducted by trained interviewers who received uniform training before the project was launched. The training included practice scoring with feedback from an expert group and one-on-one discussion with raters who rated differently from others. Inter-rater reliability (kappa values for categorical measures, intra-class correlation for continuous variables) was >0.8 for all measurements. The study was supervised throughout its duration, and there were unscheduled spot checks to ensure good inter-rater reliability.
Measures
17-item Hamilton Rating Scale for Depression (HAMD-17)
The HAMD-17 was translated into Chinese and validated in patients with depression in 1988 (YP et al., Reference Zheng, Zhao, Philips, Liu, Cai, Sun and Huang1988). It is the most commonly used scale to measure symptomatology and illness severity for MDD and has been used for almost 30 years (Lin et al., Reference Lin, Wang, Dong, Du, Shen, Ding and Xu2018). The HAMD-17 consists of 17 questions with Likert scale responses of either 0–4 or 0–2; the total scores can range from 0 to 52. Internal consistency (Cronbach's α) for the HAMD-17 was 0.829 and 0.615 in a previous study (Ma et al., Reference Ma, Yang, Yang, Kang, Wang, Zhang and Liu2021) and the current baseline sample, respectively. The Cronbach's α for the week 4 HAMD-17 is 0.834.
Sheehan Disability Scale (SDS)
As a global self-rated questionnaire on functional disability, the SDS was used to evaluate the degree of dysfunction relating to family life/home responsibility, social life/leisure activities, and work/school (Sheehan et al., Reference Sheehan, Mancini, Wang, Berggren, Cao, Dueñas and Yue2016). These three items were graded according to a visual analogue scale ranging from 0 to 10; this can also be summed as the total SDS score. Internal consistency (Cronbach's α) for the SDS was 0.940 and 0.819 in a previous study (Leu et al., Reference Leu, Chou, Lee, Cheng, Shao, Hsien and Chen2015) and the current sample, respectively.
Quality of Life Enjoyment and Satisfaction Questionnaire – Short Form (Q-LES-Q-SF)
The Q-LES-Q-SF is a self-administered questionnaire that is used to measure health-related QOL covering various domains of well-being. The Q-LES-Q-SF has been a stand-alone measure used extensively in patients with MDD (Zhao et al., Reference Zhao, Wang, Wu, Hu, Niu, Wang and Wang2017). This questionnaire features 16 items scored on a five-point Likert scale ranging from 1 (very poor) to 5 (very good). The total score was computed by summating the scores on the first 14 items. Items 15 and 16 collate information related to satisfaction with the use of medication and overall life (Katila et al., Reference Katila, Mezhebovsky, Mulroy, Berggren, Eriksson, Earley and Datto2013). This scale has been proven to be a valid and reliable assessment tool for measuring QOL in patients with major psychiatric disorders (Ritsner, Kurs, Gibel, Ratner, & Endicott, Reference Ritsner, Kurs, Gibel, Ratner and Endicott2005). Internal consistency (Cronbach's α) for the Q-LES-Q-SF was 0.87 and 0.842 in a previous study (Lee et al., Reference Lee, Liu, Huang, Sun, Huang and Yeung2014) and the current sample, respectively.
Data analyses
Network analysis
First, the R-package graph package (Epskamp, Cramer, Waldorp, Schmittmann, & Borsboom, Reference Epskamp, Cramer, Waldorp, Schmittmann and Borsboom2012) was used to construct a partial correlation network (Epskamp, Borsboom, & Fried, Reference Epskamp, Borsboom and Fried2018) of (i) 17 symptoms of MDD, (ii) three functional disability items, and (iii) QOL (online Supplementary Table S1) in patients with MDD, using the Least Absolute Shrinkage and Selection Operator (LASSO) (Friedman, Hastie, & Tibshirani, Reference Friedman, Hastie and Tibshirani2008). Within the graphical network, each node depicts a symptom, and varying thicknesses of the edges represent the magnitude of regularized partial correlations between two individual symptoms. The stronger the connection is, the stronger, thicker, and more saturated an edge is. Blue edges reflect positive associations while yellow edges reflect negative associations.
Second, we also calculated centrality measures, such as strength, betweenness, and closeness, for all nodes. These metrics examined the relative importance and influence of symptoms (Boccaletti, Latora, Moreno, Chavez, & Hwang, Reference Boccaletti, Latora, Moreno, Chavez and Hwang2006; Opsahl, Agneessens, & Skvoretz, Reference Opsahl, Agneessens and Skvoretz2010). Node strength was calculated by summating all the edge weights attached to a given node, and it was a common and stable central metric. Betweenness was measured with the number of shortest paths that passed through the node of interest. Closeness referred to the inverse of the sum distance of a node to all other nodes. Highly central symptoms scored the highest on measures of strength centrality, as these strongly affect other symptoms in the network (McNally, Reference McNally2021). The activation of a highly central symptom increases the likelihood of activation spreading to a large number of other symptoms.
Third, network accuracy and stability were estimated using R-package bootnet (Epskamp et al., Reference Epskamp, Borsboom and Fried2018); this involved: (a) estimation of the bootstrapped confidence intervals of edge-weights by calculating their 95% confidence intervals (CIs) derived from a non-parametric bootstrap procedure (n = 1000); (b) evaluation of the stability of centrality indices from a case-drop bootstrap procedure, in which centrality indices were repeatedly calculated from subsets of data with an increasing proportion of cases subtracted. The correlation stability (CS) coefficient was used to quantify the stability of centrality indices and represents the maximum proportion of cases that can be dropped to retain a correlation of 0.7 in at least 95% of the sample. The CS coefficient should not be below 0.25 and preferably above 0.5; (c) bootstrapped difference tests (α = 0.05) for edge-weights and node strength using 1000 bootstrap samples. Gray boxes indicate nodes that do not significantly differ from one another. Black boxes indicate a significant difference.
Fourth, a Bayesian network, derived from the principles of causal reasoning, is defined as the combination of a DAG and a probability distribution (Briganti, Scutari, & McNally, Reference Briganti, Scutari and McNally2022). The DAG encodes conditional independence relationships and characterizes the joint probability distribution of the variables by using graphical separation. The logic behind the use of DAG to depict hypothetical causal structures is set out in detail by Pearl (Pearl, Reference Pearl2000). While causality can never be proved using observational data only, DAG can still provide admissible evidence of causal relationships. It gives information about both the magnitude and direction of the connections between symptoms. DAG has been increasingly used in the psychological context (Moffa et al., Reference Moffa, Catone, Kuipers, Kuipers, Freeman, Marwaha and Bebbington2017). The R-package bnlearn was used in this study. It uses a hill-climbing algorithm (McNally, Reference McNally2016), as described recently (Amore et al., Reference Amore, Murri, Calcagno, Rocca, Rossi, Aguglia and Maj2020; McNally, Mair, Mugno, & Riemann, Reference McNally, Mair, Mugno and Riemann2017). To ensure the stability of the resultant network, we conducted bootstrapping (n = 1000 iterations) and calculated the goodness-of-fit index (i.e. Bayesian Information Criteria, BIC) for each sample (Scutari & Nagarajan, Reference Scutari and Nagarajan2013). If those edges displayed the same direction in at least 85% of these networks, then we retained the edge in the resultant network (França, Gordon, Samra, Rodolpho Duarte, & Jacinto, Reference França, Gordon, Samra, Rodolpho Duarte and Jacinto2020; Moffa et al., Reference Moffa, Catone, Kuipers, Kuipers, Freeman, Marwaha and Bebbington2017). All analyses were carried out in R 3.6.3 (R Foundation for Statistical Computing, Vienna, Austria).
Fifth, we also performed online Supplementary analysis. There was a large gender disparity in participants (only 32% were male), depression was more common in females, and some of the factors examined (e.g. family factors) differed by gender. Given these factors, it was important to examine whether the findings differ in males and females. We compared the gender difference in the network using the recently developed test, the Network Comparison Test (NCT), which allows researchers to test differences in global network strength (i.e. the overall level of connectivity of the network) and global network structure (i.e. the overall structure of the network) between two networks (Borkulo et al., Reference Borkulo, Boschloo, Kossakowski, Tio, Schoevers, Borsboom and Waldorp2017). The Q-LES-Q-SF has 16 items and includes the same content as the general activities section of the longer version (Lee et al., Reference Lee, Liu, Huang, Sun, Huang and Yeung2014). No criteria that can help to categorize the items into dimensions were found. If all individual items of the Q-LES-Q-SF were included as nodes in the network analyses, it would be difficult to interpret. Therefore, only the total score of the Q-LES-Q-SF was included. The result of the undirected network analysis is also added in the online Supplementary material, in which items of the Q-LES-Q-SF were included (online Supplementary Fig. S7). In addition, we used the follow-up data at week 4 to verify the results of the DAG analysis. To sufficiently analyze the results, we also included the longitudinal data (at baseline and week 4) to examine the association found in the DAG analysis. On the one hand, among the variables found in the DAG branch, the levels of the symptoms at baseline were stratified according to the levels of their median, and the two baseline groups' levels of symptoms at week 4 of the two baseline groups at week 4 were compared using the Wilcoxon rank-sum test. On the other hand, the Spearman's correlation was used to analyze the correlation between the change values of any two items that were supposed to have a correlation, as well as the relationship between the baseline level of symptoms and the level of subsequent symptoms at week 4. The curves were fitted through scatter plots.
Results
Sample characteristics
Of the 1385 subjects, 31.55% were male. The mean age was 34.21 ± 12.31 years. The majority (58.70%) have a normal and healthy weight. The mean duration of illness was 34.05 ± 51.04 months and 14.15% (n = 196) had a family history of mental illness. Data relating to demographics and the clinical characteristics of the study population are summarized in Table 1. The mean scores for the HAMD-17 items, SDS items, and Q-LES-Q-SF total scores are reported in Table 2.
Table 1. Basic information n (%) or (mean ± s.d.)

Educational level of two patients was missing.
Employments status of four patients was missing.
Marital status of three patients was missing.
First episode information of two patients was missing.
Duration of illness (months) and age of onset of 20 patients were missing.
Duration of current episode (months) of 18 patients was missing.
Table 2. The mean scores for the HAMD-17, SDS, and Q-LES-Q-SF (mean ± s.d.)
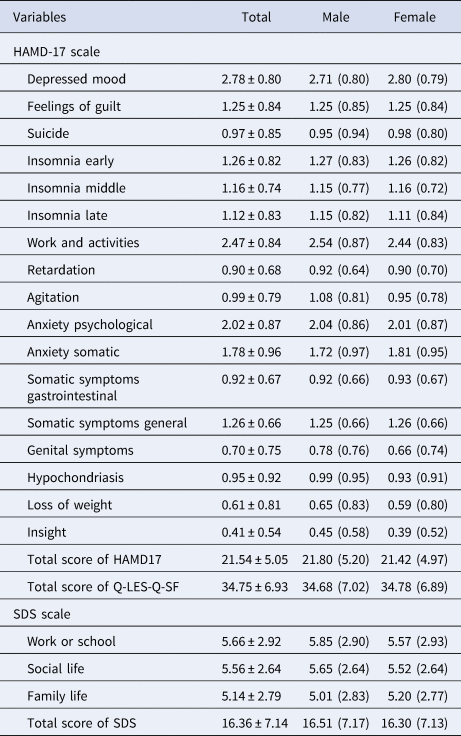
Note: HAMD-17 is the 17-item Hamilton Rating Scale for Depression, SDS is the Sheehan Disability Scale, Q-LES-Q-SF is the Quality of Life Enjoyment and Satisfaction Questionnaire – Short Form.
Undirected network structure (graphical LASSO)
The network for depressive symptoms, functional impairment, and QOL contained 21 nodes (Fig. 1). Most of the edges among depressive symptoms and functional impairment represent positive correlations; however, all links with life satisfaction were negative. The strongest edges were observed between the life satisfaction and family life functional disability nodes, as well as the suicidal ideation node. Nodes within the domain of functional impairment were generally highly interconnected and clustered closely together. Within the depressive symptoms, strong links were found between suicidal ideation and feelings of guilt, depressed mood, and psychological anxiety, as well as early, middle, and late insomnia.

Fig. 1. Undirected networks of depressive symptoms, functional disabilities, and QOL in patients with MDD. Each edge corresponds to a partial correlation (positive in blue, negative in orange, maximum magnitude = 0.43) between two items; the thickness corresponds to the absolute magnitude of the correlation. The colors of the nodes correspond to detected communities in the network: HAMD-17 (pink), SDS (blue), and Q-LES-Q-SF total score (green). Item label abbreviations are defined on the right side of figure.
Three centrality metrics (strength, betweenness, and closeness) of the graphical LASSO are presented in Fig. 2. A node with a higher index of centrality is more central in the network, and this implies close linkage to other symptoms in the network (Opsahl et al., Reference Opsahl, Agneessens and Skvoretz2010). The five symptoms exhibiting the highest strength centrality were social life dysfunction, QOL, late insomnia, family life responsibilities, and somatic symptoms. Somatic symptoms and QOL emerged as the most central nodes in the network for betweenness, indicating that these two symptoms often transmitted information through the network (McElroy, Shevlin, Murphy, & McBride, Reference McElroy, Shevlin, Murphy and McBride2018). Somatic symptoms and psychological anxiety had the highest centrality for closeness, indicating that these are key nodes that are more likely to affect other symptoms in a rapid manner (Bringmann, Lemmens, Huibers, Borsboom, & Tuerlinckx, Reference Bringmann, Lemmens, Huibers, Borsboom and Tuerlinckx2015).

Fig. 2. Node centrality metrics of the network. The left, middle, and right panels show the strength, betweenness, and closeness estimates for each node of the network, respectively.
Data acquired through the case-drop procedure suggested a robust estimation of centrality (Fig. 3). The correlations between the measures of centrality using the full sample and a subset of 30% of the data were higher than 0.25. This indicates that, even when 70% of the sample were randomly removed, the network structure remained highly stable. The network also appeared quite stable across bootstrapped difference tests for edge weights and node strength (online Supplementary Figs S1 and S2). The result of bootstrapped 95% confidence intervals for the edge weights is shown in online Supplementary materials (Fig. S3).

Fig. 3. Stability of the centrality indices: point estimates and corresponding 95% CIs. This was determined by average correlations between the centrality indices of networks sampled with patients dropped and the original sample. Lines indicate the means and areas indicate the range from the 2.5th quantile to the 97.5th quantile.
The results relating to gender difference in the network indicated that the global network strength was larger in the female network than in the male network (S = 2.202, p = 0.0278), although this was not accompanied by differences in the network structure (M = 0.149, p = 0.1008). Depressed mood symptom plays a more central role in the female network, while in the male network this role is played by somatic symptoms. These results are shown in the online Supplementary material (Figs S4–S6).
Bayesian network
Figure 4 depicts the DAG arising from the Bayesian network analysis and illustrates connections between depressive symptoms, functional disabilities, and QOL in patients with MDD. Edge thickness indicates the importance of the connections in terms of network structure; the position of different items is indicative of predictive priority over other items. Depressed mood was positioned at the highest level in the model, suggesting its causal priority. Depressed mood predicted the activation of functional impairment, including disability related to work, activities, social life, and family life, thus activating the QOL. In another important branch, the depressed mood node triggered anxiety including psychological anxiety, somatic anxiety, and general somatic symptoms. As evident in the regularized partial correlation network, a feeling of guilt directly influences suicidal ideation (with a strong association), thus influencing the QOL. While the DAG estimated several branches of activation, some nodes (e.g. QOL and somatic symptom) appeared to act as ‘bridges’ between these pathways. In total, 1025 patients with MDD (74.0% of the total sample) were followed at week 4 (HAMD-17 total score = 11.07 ± 6.31). Generally, the DAG of the week 4 follow-up data was consistent with the baseline result. The three impact pathways identified by the baseline DAG were validated by the 4-week data, namely (first branch: depressed mood – disrupted work and activities – disrupted social life – disrupted family life – QOL; second branch: depressed mood – psychological anxiety – somatic anxiety – general somatic symptoms; third branch: feeling of guilt – suicidal ideation – QOL). These results are shown in the online Supplementary material (Fig. S8).

Fig. 4. Directed acyclic graph (DAG) of depressive symptoms, functional disabilities, and QOL in patients with MDD. Arrows indicate the direction of the assumed causal relationships. Edge thickness indicates confidence that the predicted direction of edge points in the direction displayed in the graph.
The result of the analysis using the longitudinal data indicated that compared with the group with a lower baseline level of depressive symptoms in the DAG branch, the group with a higher baseline level has a higher level of subsequent symptoms at week 4, p < 0.05 (Fig. 5). And this between-group difference was not found between the variables with no connections indicated in the DAG (e.g. the suicide item and the insomnia middle item; the insight item and the feelings of guilt item), p > 0.05 (online Supplementary Fig. S9). A significant correlation was found between the baseline level of symptoms and the level of subsequent symptoms at week 4 (e.g. the depressed mood item at baseline was positively associated with the work and activity item at week 4). The curves were also fitted through scatter plots (online Supplementary Fig. S10). The correlation between the change values (from baseline to week 4) of any two items in the DAG branch that were supposed to have a correlation was significant. For example, the reduction of the score of the work and the activity items was positively associated with the reduction of the score of the depressed mood item (r = 0.25, p < 0.001), the reduction of psychological anxiety was positively associated with the reduction of the score of the depressed mood item (r = 0.37, p < 0.001), and the reduction of the score of the suicide item was positively associated with the reduction of the score of the feelings of guilt item (r = 0.26, p < 0.001). The curves were also fitted through scatter plots (online Supplementary Fig. S11).

Fig. 5. Longitudinal data (baseline and week 4) used to examine the association found in DAG analysis.
Note: (a) Branch 1: depressed mood – work and activity – work or school disability – social life disability – family life disability – quality of life – somatic symptoms; (b) Branch 2: depressed mood – psychological anxiety – somatic anxiety – somatic symptoms general; (c) Branch 3: feelings of guilt – suicide – quality of life. The levels of the symptoms at baseline were stratified according to the levels of their median. The groups with lower baseline item/scale score are depicted in red, and the groups with higher baseline score are in teal.
Discussion
To the best of our knowledge, this is the first study to examine the associations between depressive symptoms, functional impairment, and QOL in major depressive patients using both undirected and Bayesian network analyses. The sample is representative of the general population, to an extent. On the one hand, the male-to-female ratio in our study was close to 1:2. It is in line with the gender difference in the prevalence of depression that women are twice as likely to experience depression compared with men, and this finding has been replicated across many cultures as one of the most robust findings in psychiatric epidemiology (Bone, Lewis, & Lewis, Reference Bone, Lewis and Lewis2020; Salk, Hyde, & Abramson, Reference Salk, Hyde and Abramson2017). On the other hand, the participants of this study had various demographic and clinical characteristics, e.g. education levels, employments status, marital status, episodes, and duration of illness. The results clearly indicated that functional disability was an important mediator between depressive symptoms and QOL. Depressed mood played a predominant role in activating both anxiety symptom and functional impairment. The factors most directly related to QOL were family functionality and suicidal symptoms.
Our results indicated that some depressive symptoms (e.g. suicidal ideation and hypochondriasis) were directly associated with QOL, while other depressive symptoms (e.g. depressed mood and a loss of interest in activity, hobbies, or work) showed an indirect association with QOL mediated by impaired function. These results are examined using longitudinal data available and are consistent with the results of most previous studies that attempted to identify the relationship between depressive symptoms, family function, and QOL (Akosile et al., Reference Akosile, Mgbeojedo, Maruf, Okoye, Umeonwuka and Ogunniyi2018; Alessandrini et al., Reference Alessandrini, Lançon, Fond, Faget-Agius, Richieri, Faugere and Boyer2016; Gardsjord et al., Reference Gardsjord, Romm, Røssberg, Friis, Barder, Evensen and Melle2018). The indirect path suggests that the depressive symptoms' impact on function can cause an alteration of QOL, not necessarily the symptoms themselves. Alessandrini et al. also revealed a highly significant path between depression and QOL, as well as a minor significant indirect path between depression and QOL mediated by function, using a structural equation modeling approach (Alessandrini et al., Reference Alessandrini, Lançon, Fond, Faget-Agius, Richieri, Faugere and Boyer2016). Conversely, some previous studies showed that depression is an intermediary factor for the relationship between function and QOL (Chan, Pan, Xu, & Yeung, Reference Chan, Pan, Xu and Yeung2021; Clements, Frazier, Moser, Lennie, & Chung, Reference Clements, Frazier, Moser, Lennie and Chung2020; Lu, Yuan, Lin, Zhou, & Pan, Reference Lu, Yuan, Lin, Zhou and Pan2017). The reasons for this inconsistency were likely different study populations and measurement models.
As one of core symptoms defined by DSM-5 to diagnose MDD (APA., 2013), depressed mood was located at the top of the DAG. Therefore, depressed mood was estimated to have greater priority and to contribute to the rapid activation of interrelated symptoms (Armour, Fried, Deserno, Tsai, & Pietrzak, Reference Armour, Fried, Deserno, Tsai and Pietrzak2017). It should be noted that, in this result, depressed mood induced functional impairment through the loss of interest in activity, hobbies, or work. These results underline the potential clinical importance of the core criterion, and support a previous study reporting that the core symptoms of DSM were of the highest impact in terms of the impairment of psychosocial functioning (Fried & Nesse, Reference Fried and Nesse2014). Moreover, depressed mood also triggered the activation of anxiety symptoms. Anxiety was proposed to be reclassified within depressive disorders as a continuum from depression to anxiety (Park & Kim, Reference Park and Kim2020). These conditions overlap substantially and are organized within a larger psychopathological network (Cramer, Waldorp, van der Maas, & Borsboom, Reference Cramer, Waldorp, van der Maas and Borsboom2010; Fried & Nesse, Reference Fried and Nesse2015; Goekoop & Goekoop, Reference Goekoop and Goekoop2014). This means that once a few specific symptoms have been activated, these activated signals can spread from symptoms of depression to those of anxiety via highly central symptoms (Fried, Epskamp, Nesse, Tuerlinckx, & Borsboom, Reference Fried, Epskamp, Nesse, Tuerlinckx and Borsboom2016). Some findings show that the symptoms of depression are no more central than anxiety symptoms for patients with MDD (Park & Kim, Reference Park and Kim2020). For example, the results of the STAR*D study suggested that DSM symptoms (e.g. sad mood) and non-DSM symptoms (e.g. anxiety) were among the most central symptoms, while DSM criteria were no more central than non-DSM criteria (Fried et al., Reference Fried, Epskamp, Nesse, Tuerlinckx and Borsboom2016). However, our results showed that ‘depressed mood’ was still the key symptom that contributes to the rapid activation of interrelated symptoms and dysfunction. So, we emphasized the importance of ‘depressed mood’ as the therapeutic target for early intervention. A possible reason for the difference between the results of our study and that of STAR*D is that the network analysis in STAR*D focused purely on the comparison among depressive symptoms, whereas our study had some expansion on the dimensions of social functioning and QOL.
Our results indicated that family functionality and suicidal symptoms were the factors that were most directly related to QOL. Both undirected and directed analyses identified a connection between suicidal ideation and a reduced QOL and the most likely direction was from suicidal ideation to QOL, rather than vice versa. This was in line with other studies finding that suicidal ideation was associated with QOL (Almeida et al., Reference Almeida, Bezerra-Filho, Studart-Bottó, Léda-Rego, Silva, Kapczinski and Miranda-Scippa2021; Beşirli, Alptekin, Kaymak, & Özer, Reference Beşirli, Alptekin, Kaymak and Özer2020; van Spijker et al., Reference van Spijker, Batterham, Calear, Wong, Werner-Seidler and Christensen2020) and suicidal thinking may reduce QOL (Hidalgo-Rasmussen & Martín, Reference Hidalgo-Rasmussen and Martín2015; Kim et al., Reference Kim, Kim, Kang, Bae, Kim, Shin and Yoon2019; van Spijker, van Straten, Kerkhof, Hoeymans, & Smit, Reference van Spijker, van Straten, Kerkhof, Hoeymans and Smit2011). It should be noted that there are also some previous studies indicating that a low QOL could be a risk factor for suicidal ideation (Fairweather-Schmidt, Batterham, Butterworth, & Nada-Raja, Reference Fairweather-Schmidt, Batterham, Butterworth and Nada-Raja2016; Faure et al., Reference Faure, Urquidi, Bustamante, Florenzano, Ampuero, Terán and Giacaman2018; Sinclair, Hawton, & Gray, Reference Sinclair, Hawton and Gray2010; van Spijker et al., Reference van Spijker, Batterham, Calear, Wong, Werner-Seidler and Christensen2020). For instance, in a prospective study based on a Finnish twin cohort, QOL was found to exert a long-term effect on the risk of suicide throughout a 20-year follow-up period (Koivumaa-Honkanen et al., Reference Koivumaa-Honkanen, Honkanen, Viinamäki, Heikkilä, Kaprio and Koskenvuo2001). Additionally, a study found that functional impairment in family life/home responsibilities would lead to a direct reduction in QOL. One explanation could be that family relationships are usually considered the major source of emotional comforts which exert a significant influence on the QOL (Lu et al., Reference Lu, Yuan, Lin, Zhou and Pan2017).
Centrality analysis indicated that social life dysfunction exhibited the highest strength centrality. The potential explanation for this finding is that social life dysfunction is often manifested as hyper-sensitivity to social rejection and impaired social perception (Kupferberg, Bicks, & Hasler, Reference Kupferberg, Bicks and Hasler2016). These conditions predict higher rates of internal life stressors (Liu, Kraines, Massing-Schaffer, & Alloy, Reference Liu, Kraines, Massing-Schaffer and Alloy2014) and subsequent depressive symptoms (Liu et al., Reference Liu, Kraines, Massing-Schaffer and Alloy2014). It should be admitted that betweenness and closeness centrality seem to be especially poorly suited to most psychological networks, as they come with strong assumptions that may not hold. However, many alternative measures that were introduced over a substantial period of time also have these problems (Bringmann et al., Reference Bringmann, Elmer, Epskamp, Krause, Schoch, Wichers and Snippe2019). Thus, strength, betweenness, and closeness are still the most common centrality indices used in psychological network research (Ye et al., Reference Ye, Zalesky, Lv, Loi, Cetin-Karayumak, Rathi and Di Biase2021).
About the networks developed in terms of gender, we found significant differences in the network global strength. Symptom networks of female patients were more strongly connected, as global strength was higher in the female group than in the male group, and this result is consistent with previous findings (Jin et al., Reference Jin, Sun, Lam, Su, Hall and Cheung2022; Steen, van Borkulo, & van Loo, Reference Steen, van Borkulo and van Loo2021). This result supports the notion that the cluster of dynamic mechanisms of depressive symptoms in women is more complex compared with men (Cramer et al., Reference Cramer, van Borkulo, Giltay, van der Maas, Kendler, Scheffer and Borsboom2016), which may be related to a greater vulnerability to depression and a less positive prognosis (van Borkulo et al., Reference van Borkulo, Boschloo, Borsboom, Penninx, Waldorp and Schoevers2015). On the other hand, our results indicated that symptoms central to the network were similar in general between the sexes. While depressed mood has a greater presence in women, somatic symptoms are more central in men. This finding supports the Gender Responding Framework (Castellanos, Ausin, Bestea, Gonzalez-Sanguino, & Munoz, Reference Castellanos, Ausin, Bestea, Gonzalez-Sanguino and Munoz2020; Price, Gregg, Smith, & Fiske, Reference Price, Gregg, Smith and Fiske2018; Rodgers et al., Reference Rodgers, Grosse Holtforth, Muller, Hengartner, Rossler and Ajdacic-Gross2014), which indicated that men tend to present more externalized symptoms, and women tend to present more internalized symptoms. These differences can be critical for providing important additional information about the relationships among depression symptoms in males and females, as well as making a more complete evaluation of MDD.
This study was strengthened by a large, multi-site sample of individuals suffering from MDD and the use of network models that are appropriate for describing complex dynamic systems (Nelson, McGorry, Wichers, Wigman, & Hartmann, Reference Nelson, McGorry, Wichers, Wigman and Hartmann2017). However, our study has some limitations that need to be mentioned. First, even though the DAG provides preliminary clues to both the strength and direction of the possible connections among the variables under analysis, caution is still required as causal inference is only fully defensible when all assumptions are completely met (Moffa et al., Reference Moffa, Catone, Kuipers, Kuipers, Freeman, Marwaha and Bebbington2017). Longitudinal studies focusing on disease development are needed for further validation (Bringmann et al., Reference Bringmann, Vissers, Wichers, Geschwind, Kuppens, Peeters and Tuerlinckx2013). Second, although a wide range of clinical dimensions were assessed, these network structures must be explained under the assumption of the absence of unmeasured confounders or selection variables. These variables may include shame, self-esteem, or cognitive biases. The inclusion of those variables in future network-based studies may enrich the research of MDD. Third, the study excluded patients with suicidal ideation item score >2 (as high risk for suicide), which may impact the relationship of suicidal ideation with other depressive symptoms, QOL, and functioning.
Despite these limitations, to our knowledge, this study was the first to elucidate the associations between depressive symptoms, functional impairment, and QOL in patients with MDD at the level of individual symptoms. We found that functional disability mediated the relationship between depressive symptoms and QOL. Depressed mood played the predominant role in activating both anxiety symptoms and functional impairment. Family functionality and suicidal symptoms were directly related to QOL. The study has important guiding value for the further understanding of MDD and the adjustment of treatment strategies for patients with this disease.
Supplementary material
The supplementary material for this article can be found at https://doi.org/10.1017/S0033291722003385
Acknowledgments
None.
Author contributions
Jia Zhou: methodology, formal analysis, and writing – original draft. Jingjing Zhou: writing – original draft. Yuan Feng, Le Xiao, and Xu Chen: resources and investigation. Lei Feng: project administration. Jian Yang: writing – review and editing. Gang Wang: conceptualization. All authors contributed to the article and approved the submitted version.
Financial support
This work was supported by the National Key Research & Development Program of China (No. 2016YFC1307200), Beijing Demonstrative Research Ward (Grant No. BCRW202009), Beijing Municipal Administration of Hospitals Incubating Program (No. PX2020073), the Capital's Funds for Health Improvement and Research (No. 2020-2-1171), Beijing Talents Project (2020A38), Beijing Young Top-Notch Talent Support project (Grant No. 2018000021223ZK36).
Conflict of interest
None.


 Open access