


Across societies, youth are characterized by disengagement in electoral politics. They are “less likely to be members of political parties and interest groups and know less about politics” (O’Neill Reference O’Neill2007, iii). In addition, young adults’ turnout numbers are significantly lower than those of older generations (Bhatti, Hansen, and Wass Reference Bhatti, Hansen and Wass2012; Wattenberg Reference Wattenberg2015). With regard to political representation, there also is a discrepancy: in many countries, parliaments “include more of the affluent than the less well off, more men than women, more middle-aged than young, and more white-collar professionals than blue-collar workers” (Norris Reference Norris1997, 6). We see the lack of young adults in legislatures as a democratic deficit that risks further alienating youth from formal politics. Among other factors, youths’ low presence in parliaments also is recognized as a problem in debates about the weak political response from current lawmakers to hinder global warming and introduce gun control (CNN 2019). Yet, comparative research seldom focuses on the relative absence of youth in parliaments.
We see the lack of young adults in legislatures as a democratic deficit that risks further alienating youth from formal politics.
This article offers a fresh perspective on this aspect of representative democracy and develops a conceptualization of young adults’ underrepresentation. We argue that scholars seeking to understand the magnitude of youths’ legislative absence should compare their presence in parliament relative to their presence in the population. We introduce a new measurement, the Youth Representation Index (YRI), which gauges the ratio between youth in society and their proportion in parliament. Given the considerable age discrepancies among countries, we deem this measure superior to others, such as the share of legislators 35 or 40 years old and younger and the median age among members of parliament (MPs). For example, the 18- to 35-year-old population tranche comprises about 20% of voting-age populations in countries with older populations (e.g., Monaco and Japan) and more than 60% in many low-income countries (e.g., Uganda and Zambia). As such, the YRI provides a more accurate picture of young adults’ underrepresentation. Using this index, this article first describes youths’ legislative underrepresentation. Second, it highlights which institutional and socioeconomic factors explain the underrepresentation of youth across countries.
WHY DOES YOUTH REPRESENTATION MATTER?
Belonging to the group of young adults is different than other politically marginalized groups. In contrast to gender identity and ethnic-minority status—which seldom change for an individual—aging is inevitable and being young is a temporary state in a person’s life. Yet, from a group perspective, the presence of youths in legislatures is crucial (Young Reference Young1990). Most important, the dominance of older people in legislatures cannot be justified on the basis of their “natural superiority of talent” (Phillips Reference Phillips1995). On the contrary, in the twenty-first century, there is a pool of young, competent candidates qualified to serve in office. In fact, evidence suggests that the problem is not a shortage of candidates but rather their lack of success in elections. For example, the Comparative Candidate Survey (2019)—a joint multinational project that collects data on candidates and legislators—illustrates a strong discrepancy between youth in the candidate pool and among MPs. In its sample of 18 elections in 14 countries, candidates ages 18 to 35 comprise nearly 30% of the candidate pool but only 13% of all elected representatives.Footnote 1 This illustrates the cynical game that political elites play, often nominating young, aspiring politicians as token candidates on noneligible list positions or for districts they cannot win. Of course, it is possible that young voters might prefer an older candidate when this actor raises policies in tune with their agenda; consider the Bernie Sanders 2019 nomination campaign as a case in point. Nevertheless, nascent research suggests that younger candidates still tend to fare better among young voters (Pomante and Schraufnagel Reference Pomante and Schraufnagel2015; Saglie, Ødegård, and Aars Reference Saglie, Ødegård and Aars2015).
The relative absence of young adults in formal politics may feed into ongoing debates on youths’ apathy and disengagement (Sloam Reference Sloam2014). In fact, we may have entered a vicious cycle of youth apathy. Because they do not see themselves and their concerns represented, youth might become increasingly disenfranchised—that is, less likely to participate in conventional politics (Henn and Foard Reference Henn and Foard2012). As a result, parties may cater less and less to the young generation, in terms of policies and political influence (Berry Reference Berry2014; Van Parijs Reference Van Parijs1998).
Youth also may have interests and hold views that differ significantly from those of older individuals. To illustrate, some policy areas—for example, rules of military conscription and age limits on the rights of drinking, driving, voting, and running for office—affect young citizens differently. The same is true for public-spending priorities. For example, young adults tend to favor free education, whereas middle-aged people may be more averse to increased taxation and the elderly may want higher pensions (Furlong and Cartmel Reference Furlong and Cartmel2012; Jennings and Niemi Reference Jennings and Niemi2014). Relatedly, youth tend to have more multicultural and egalitarian beliefs (Abramson and Inglehart Reference Abramson and Inglehart2009). For example, young Europeans are more supportive of same-sex marriage than older Europeans (McEvoy Reference McEvoy2016). There also is recent evidence that intergenerational cleavages in politics have grown in mature as well as newly established democracies. For instance, Sloam and Henn (Reference Sloam and Henn2019) suggested that recent elections (e.g., the 2017 UK general election) demonstrated this divide in vote choice.
THE YOUTH REPRESENTATION LITERATURE
Of the groups that generally are identified as marginalized in political assemblies, including women, ethnic minorities, and LGBTQs, young adults comprise the group that has received the least scholarly attention. To date, the literature on the presence of various age cohorts in elected positions is limited and generally supports the claim that youth indeed are underrepresented (e.g., Inter-Parliamentary Union 2014; Joshi Reference Joshi2013; Reference Joshi2015; Kissau, Lutz, and Rosset Reference Kissau, Lutz and Rosset2012). For example, Blondel (Reference Blondel1995, 257) stated that legislators are typically middle-aged to senior. Several case studies of a set of industrialized countries (Norris Reference Norris1997) and in specific countries (Kissau, Lutz, and Rosset Reference Kissau, Lutz and Rosset2012; Murray Reference Murray2008; Narud and Valen Reference Narud, Valen, Esaiasson and Heidar2000; Prihatini Reference Prihatini2019) suggest that the age group between 50 and 60 constitutes the largest proportion of legislators. Two reports on a global sample confirm the relative absence of youths, defined as age 30 or younger (Inter-Parliamentary Union 2014; 2016). In addition to these descriptive works, several analytical pieces seek to explain the underrepresentation of young adults in parliaments (Joshi Reference Joshi2013; Reference Joshi2015; Krook and Nugent Reference Krook and Nugent2018; Siaroff Reference Siaroff2000; Stockemer and Sundström Reference Stockemer and Sundström2018a; Reference Stockemer and Sundström2018b; Reference Stockemer and Sundström2019).
Of the groups that generally are identified as marginalized in political assemblies, including women, ethnic minorities, and LGBTQs, young adults comprise the group that has received the least scholarly attention.
These articles suggest that three formal institutions should matter for the relative presence of youth in legislatures: lower candidate-age requirements, proportional representation (PR) electoral systems, and age quotas. Allowing younger candidates the right to run for office should produce, on average, a higher proportion of young people in parliament (Krook and Nugent Reference Krook and Nugent2018; Stockemer and Sundström Reference Stockemer and Sundström2018b). Under PR, there might be a less significant incumbency advantage because candidates do not need the same recognition or resources as in races in which the “winner takes all.” Moreover, with larger district magnitudes, there may be an incentive for parties to adopt diversified lists to appeal to a broad set of constituencies (Joshi Reference Joshi2013; Stockemer and Sundström Reference Stockemer and Sundström2018a). Age quotas for younger citizens could directly affect the presence of young parliamentarians because both legislated rules and voluntary measures within parties should affect the age composition of a legislature (Tremmel et al. Reference Tremmel, Mason, Haakenstad and Dimitrijoski2015).
The existing literature has in common that it measures youth representation by either the median age in parliament or the percentage of legislators younger than age 30, 35, or 40. The first measure, the median age, has limitations because it does not necessarily inform anything about the presence of youth. The second operationalization provides the percentage of youth in parliament. However, without the distribution of the eligible voting-age population, there is no benchmark for comparison with youth in the population. Is a 10% or 20% presence of the 18- to 35-year-old cohort appropriate? This question can be answered only if we know the proportion of young citizens within the eligible voting-age population in a country. We cannot easily compare youth representation, for example, in Japan and the Dominican Republic; in both countries, young adults comprise less than 5% of MPs. Yet, the proportion of youth within the eligible voting-age population is 2.5 times higher in the Caribbean country compared to the Asian country (see online appendix 1). As a result, youths’ underrepresentation is more pronounced in the Dominican Republic. More generally, there is significant variation in the share of young MPs among countries, ranging from 0% (e.g., Namibia and Palau) to more than 30% (e.g., Sweden and Serbia). There is similar variation in the percentage of youth in the voting-age population ranging from slightly less than 20% for countries such as Monaco to more than 60% for countries such as Uganda.
RESEARCH DESIGN
The main goal of this article is to create the YRI, which measures the ratio between youth in parliament and eligible voting-age youth in society. We construct this measure for two age groups: those between 18 and 35 years old and those between 18 to 40 years old. The age of 18 was deemed a reasonable choice for the lower bar, given that in most countries in the sample, youth gain citizenship rights at that age. The literature (Joshi Reference Joshi2013; Reference Joshi2015) and international organizations, such as the Inter-Parliamentary Union (2014; 2016), frequently set the upper limit between 35 and 45 years old. To capture this range, the upper limit of our two measures was set at 35 and 40 on the day of the election, respectively. Candidates who take office at age 40 will see their term end at age 45 at the latest.
The data were collected in several steps. First, we consulted national parliaments’ websites, contacted parliamentary offices, and researched the website Everypolitician.org (which collects biographies of MPs). The individual data on the age of MPs were aggregated from these websites, and the proportion of MPs ages 18 to 35 and 18 to 40, respectively, was calculated for all possible legislatures that formed between 2013 and 2017. Second, population data (United Nations 2017) were used to calculate the share of eligible young voters in the population. Again, figures for the same year as the data on legislators were used. For a limited set of small countries, the UN reports only age-distribution figures in quintiles. For these countries, it was necessary to assume that all yearly cohorts within these quintiles were of equivalent size.
Third, the two versions of the YRI were constructed by dividing the percentage of youth in parliament (i.e., MPs ages 18 to 35) by the share of youth (i.e., ages 18 to 35) within the eligible voting-age population and then multiplying by 100 (the same procedure was adopted for the version of YRI in which age 40 is the upper limit). To illustrate, if the cohort of ages 18 to 35 constituted 15% of a country’s legislature and the same age group comprised 30% of the population, this measure would be 50 (i.e., young adults’ representation in parliament is 50% relative to their proportion in the population). These two indexes are labeled YRI 35 and YRI 40, respectively. For comparison purposes, the same indexes for cohorts ages 41 to 60 and 61 and older also were calculated (see online appendices 1 and 2).
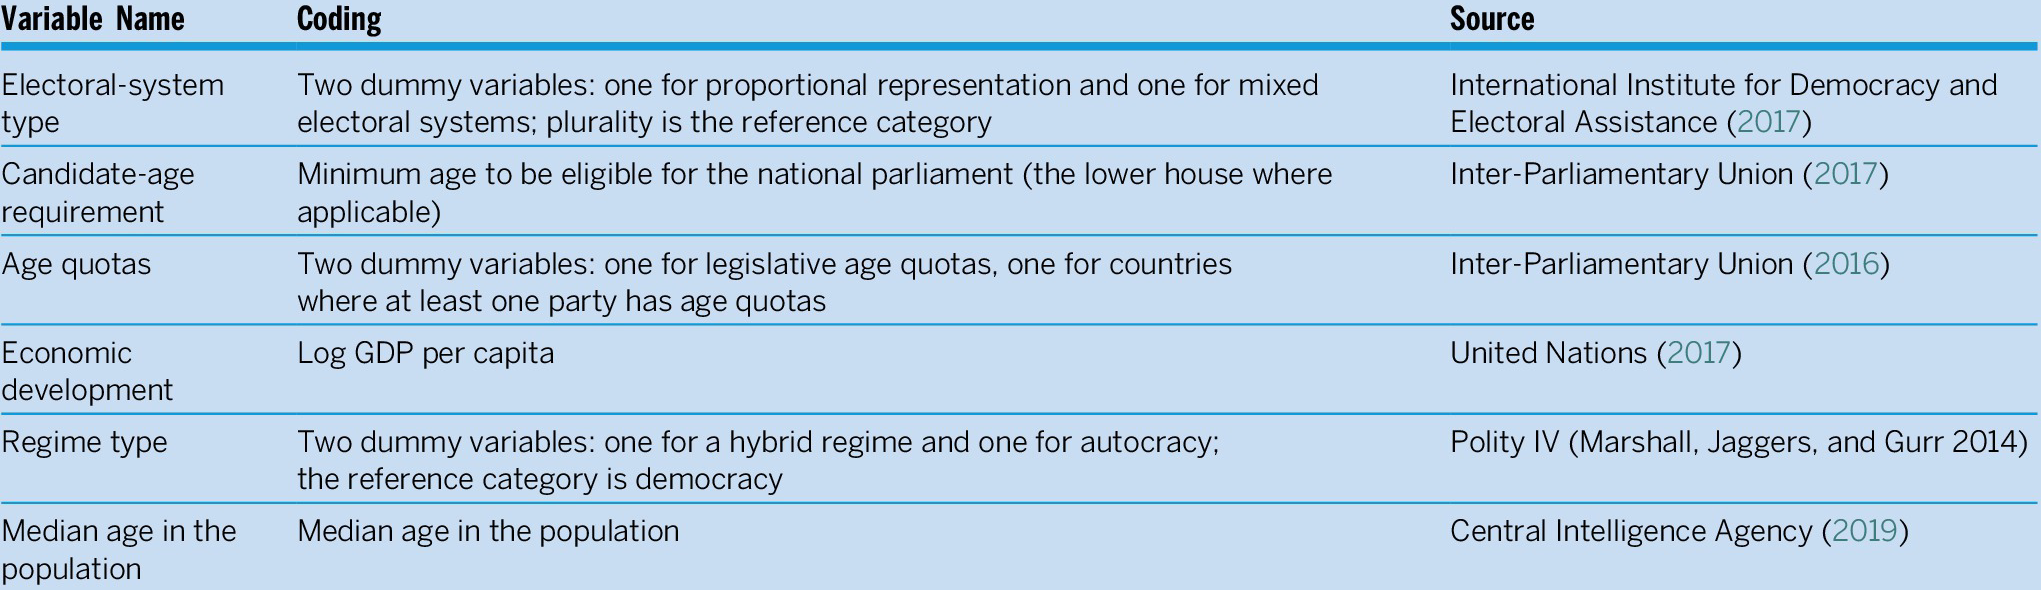
We retrieved information about the ratio between youth in parliament and youth in the population for 90 countries (i.e., those with available data on the age of MPs and age-cohort data for the population). These data were used for two types of analyses. First, the legislative underrepresentation of youths across the globe was described. Second, three institutional factors were collected (i.e., the electoral-system type, candidate-age requirements, and existence of legislated and voluntary age quotas) (Joshi Reference Joshi2013; Reference Joshi2015; Stockemer and Sundström Reference Stockemer and Sundström2018a; Reference Stockemer and Sundström2018b), as well as three socioeconomic measures (i.e., economic development, median age in the population, and regime type). Table 1 describes the operationalization of these variables. In the fourth step, the two dependent variables, the YRI 35 and YRI 40, were regressed on these independent variables to explain variations in youth representation. Because the variance was not equally distributed, Huber White Standard Errors were used (White Reference White1980).
Table 1 Operationalization of Independent Variables
RESULTS
Figures 1 and 2 display strong variation in youths’ representation across countries. For example, the YRI 35 ranges from 0 for countries such as Namibia and Palau—indicating that not a single legislator is young—to a small group of only three countries where the parliament has a larger share of youth than the population (i.e., Andorra, Serbia, and Sweden). Yet, the most striking result of YRI 35 is the strong underrepresentation of youth. To illustrate, the average ratio between youths in parliament and in society is 34.55 (the standard deviation is 28.23). In other words, on average, youth are underrepresented by a factor of three—that is, young adults are generally three times more strongly represented in a country’s population than in its parliament. To put this figure into perspective with another underrepresented group, women comprise about 24% of MPs worldwide (Inter-Parliamentary Union 2018). Assuming that the ratio of men and women is about 50/50 in the population, it can be inferred that women’s parliamentary representation relative to their presence in society is approximately a factor of one to two.
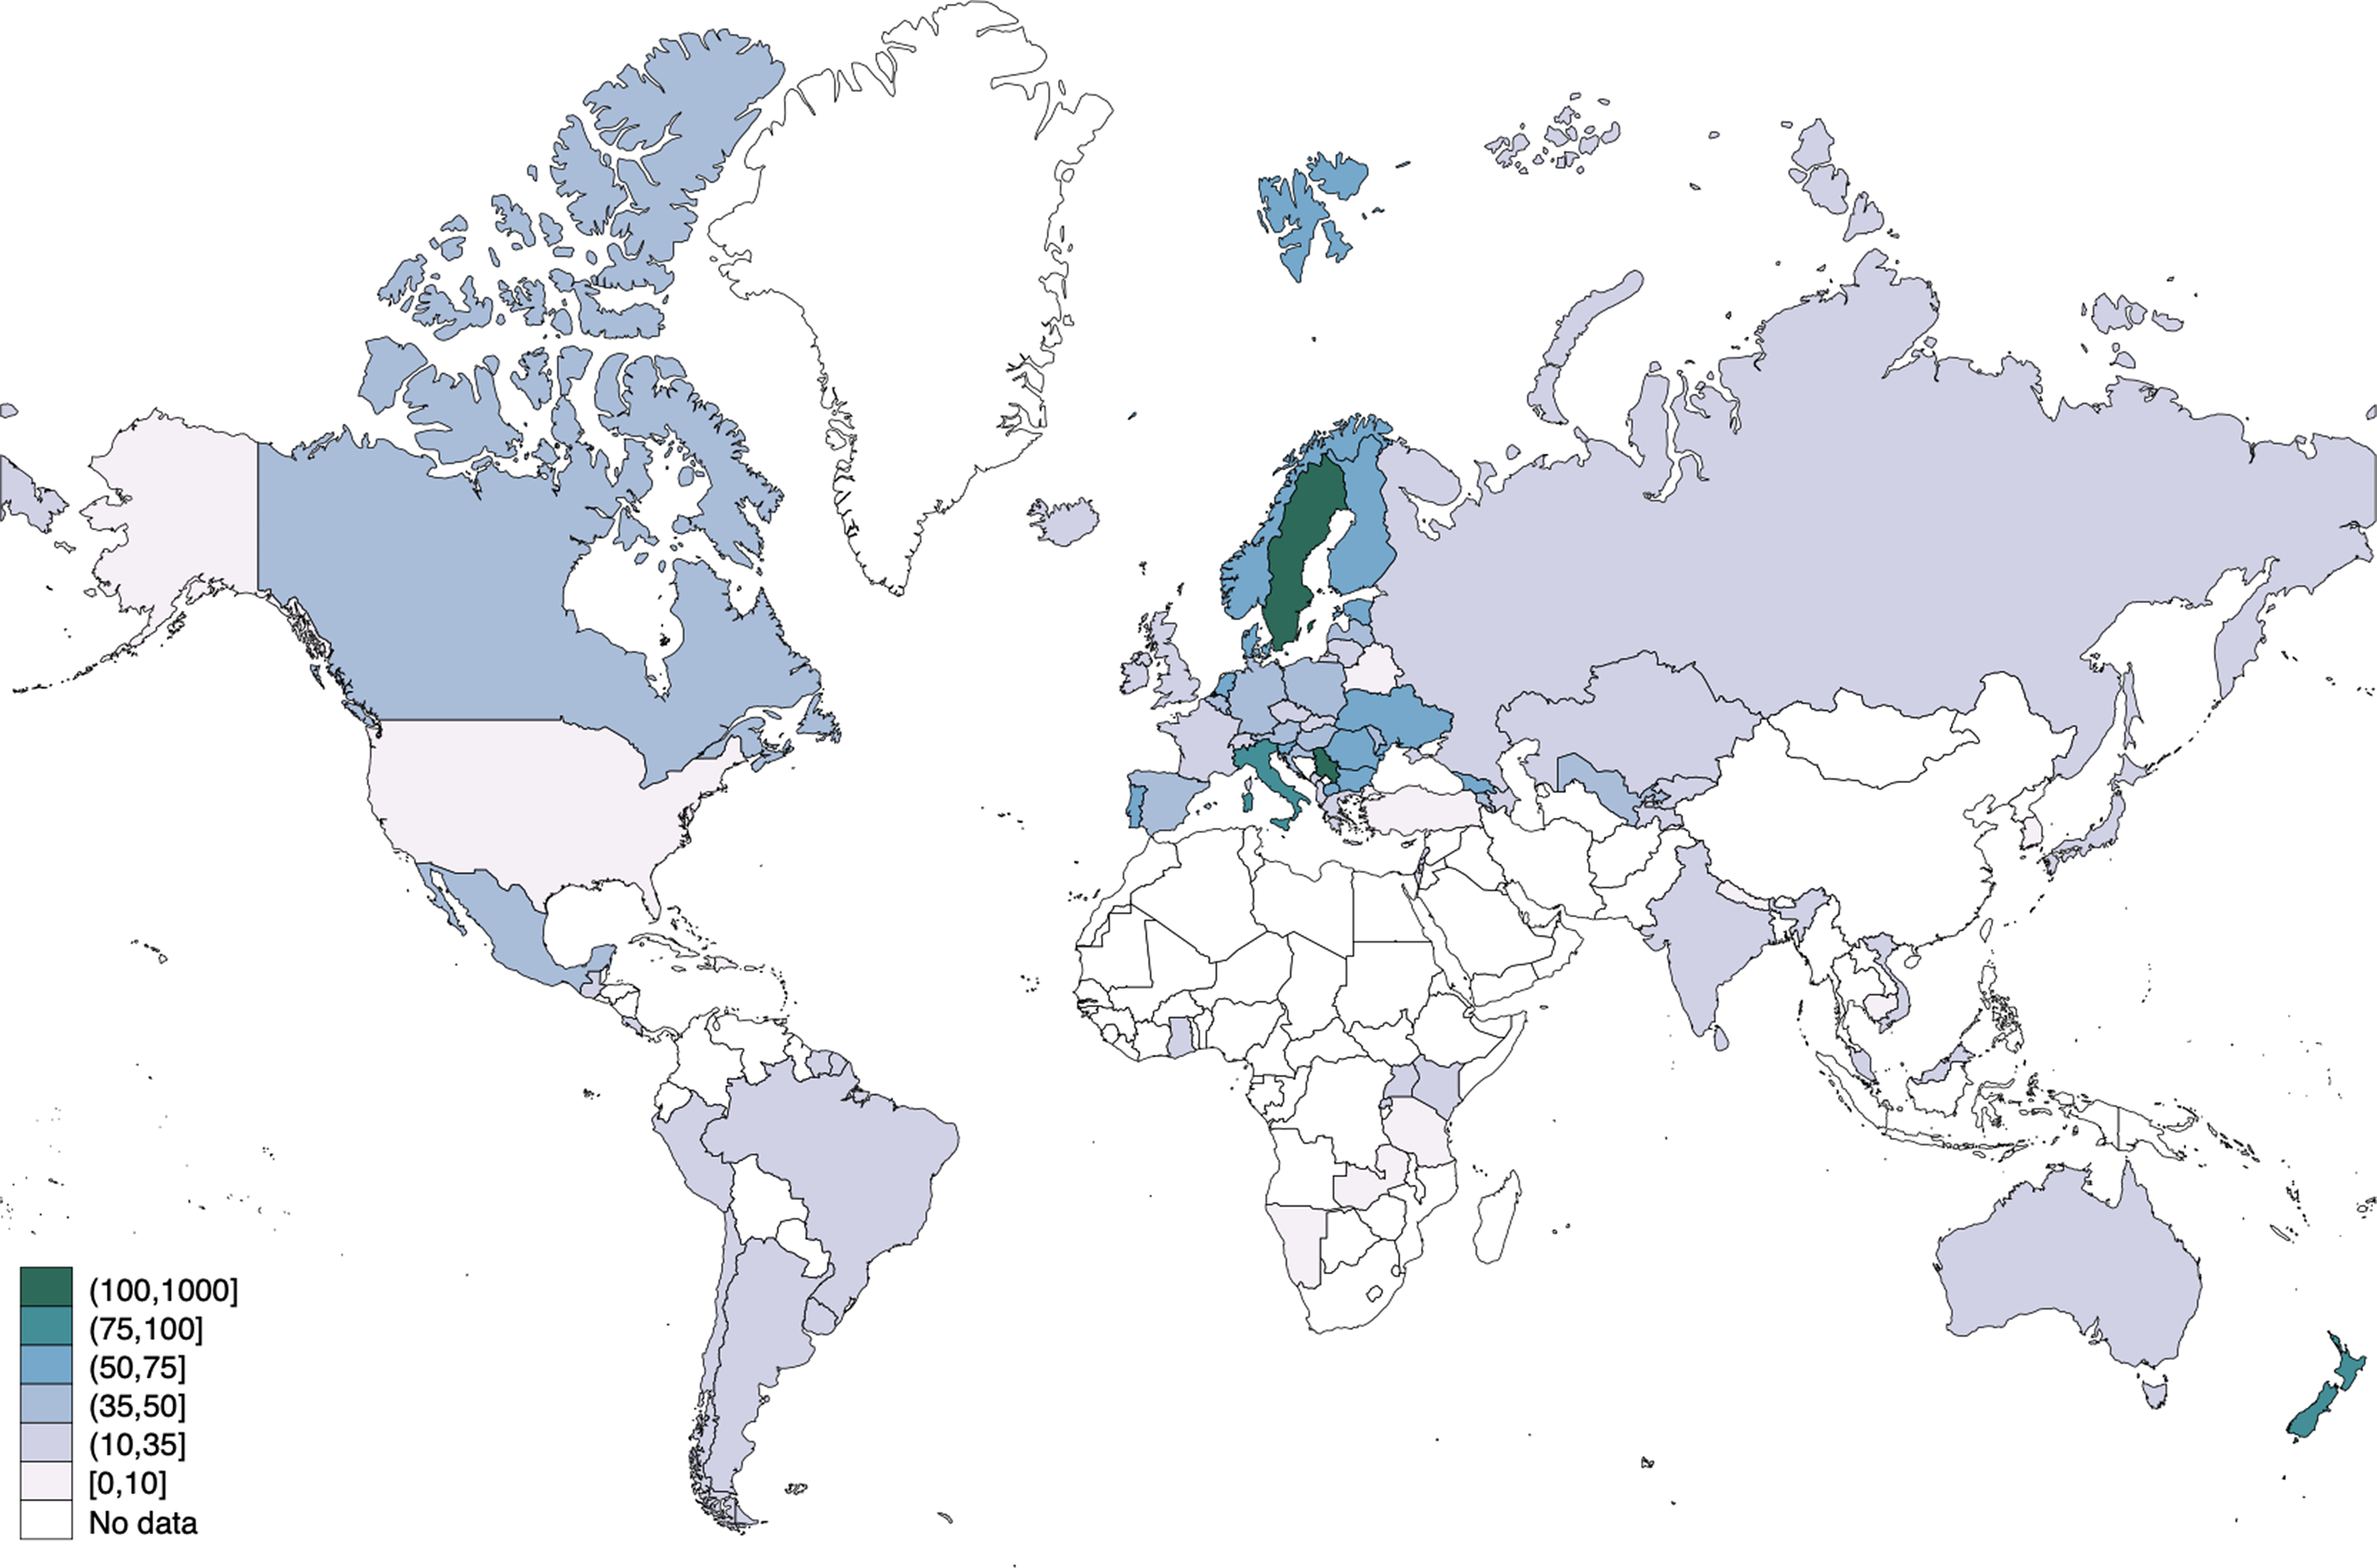
Figure 1 Youth Representation Across the Globe (YRI 35)
Note: The YRI 35 is a measure in which the percentage of youth in parliament—MPs ages 18 to 35 years—is divided by the proportion of youth (ages 18 to 35) within the eligible voting-age population and then multiplying by 100.
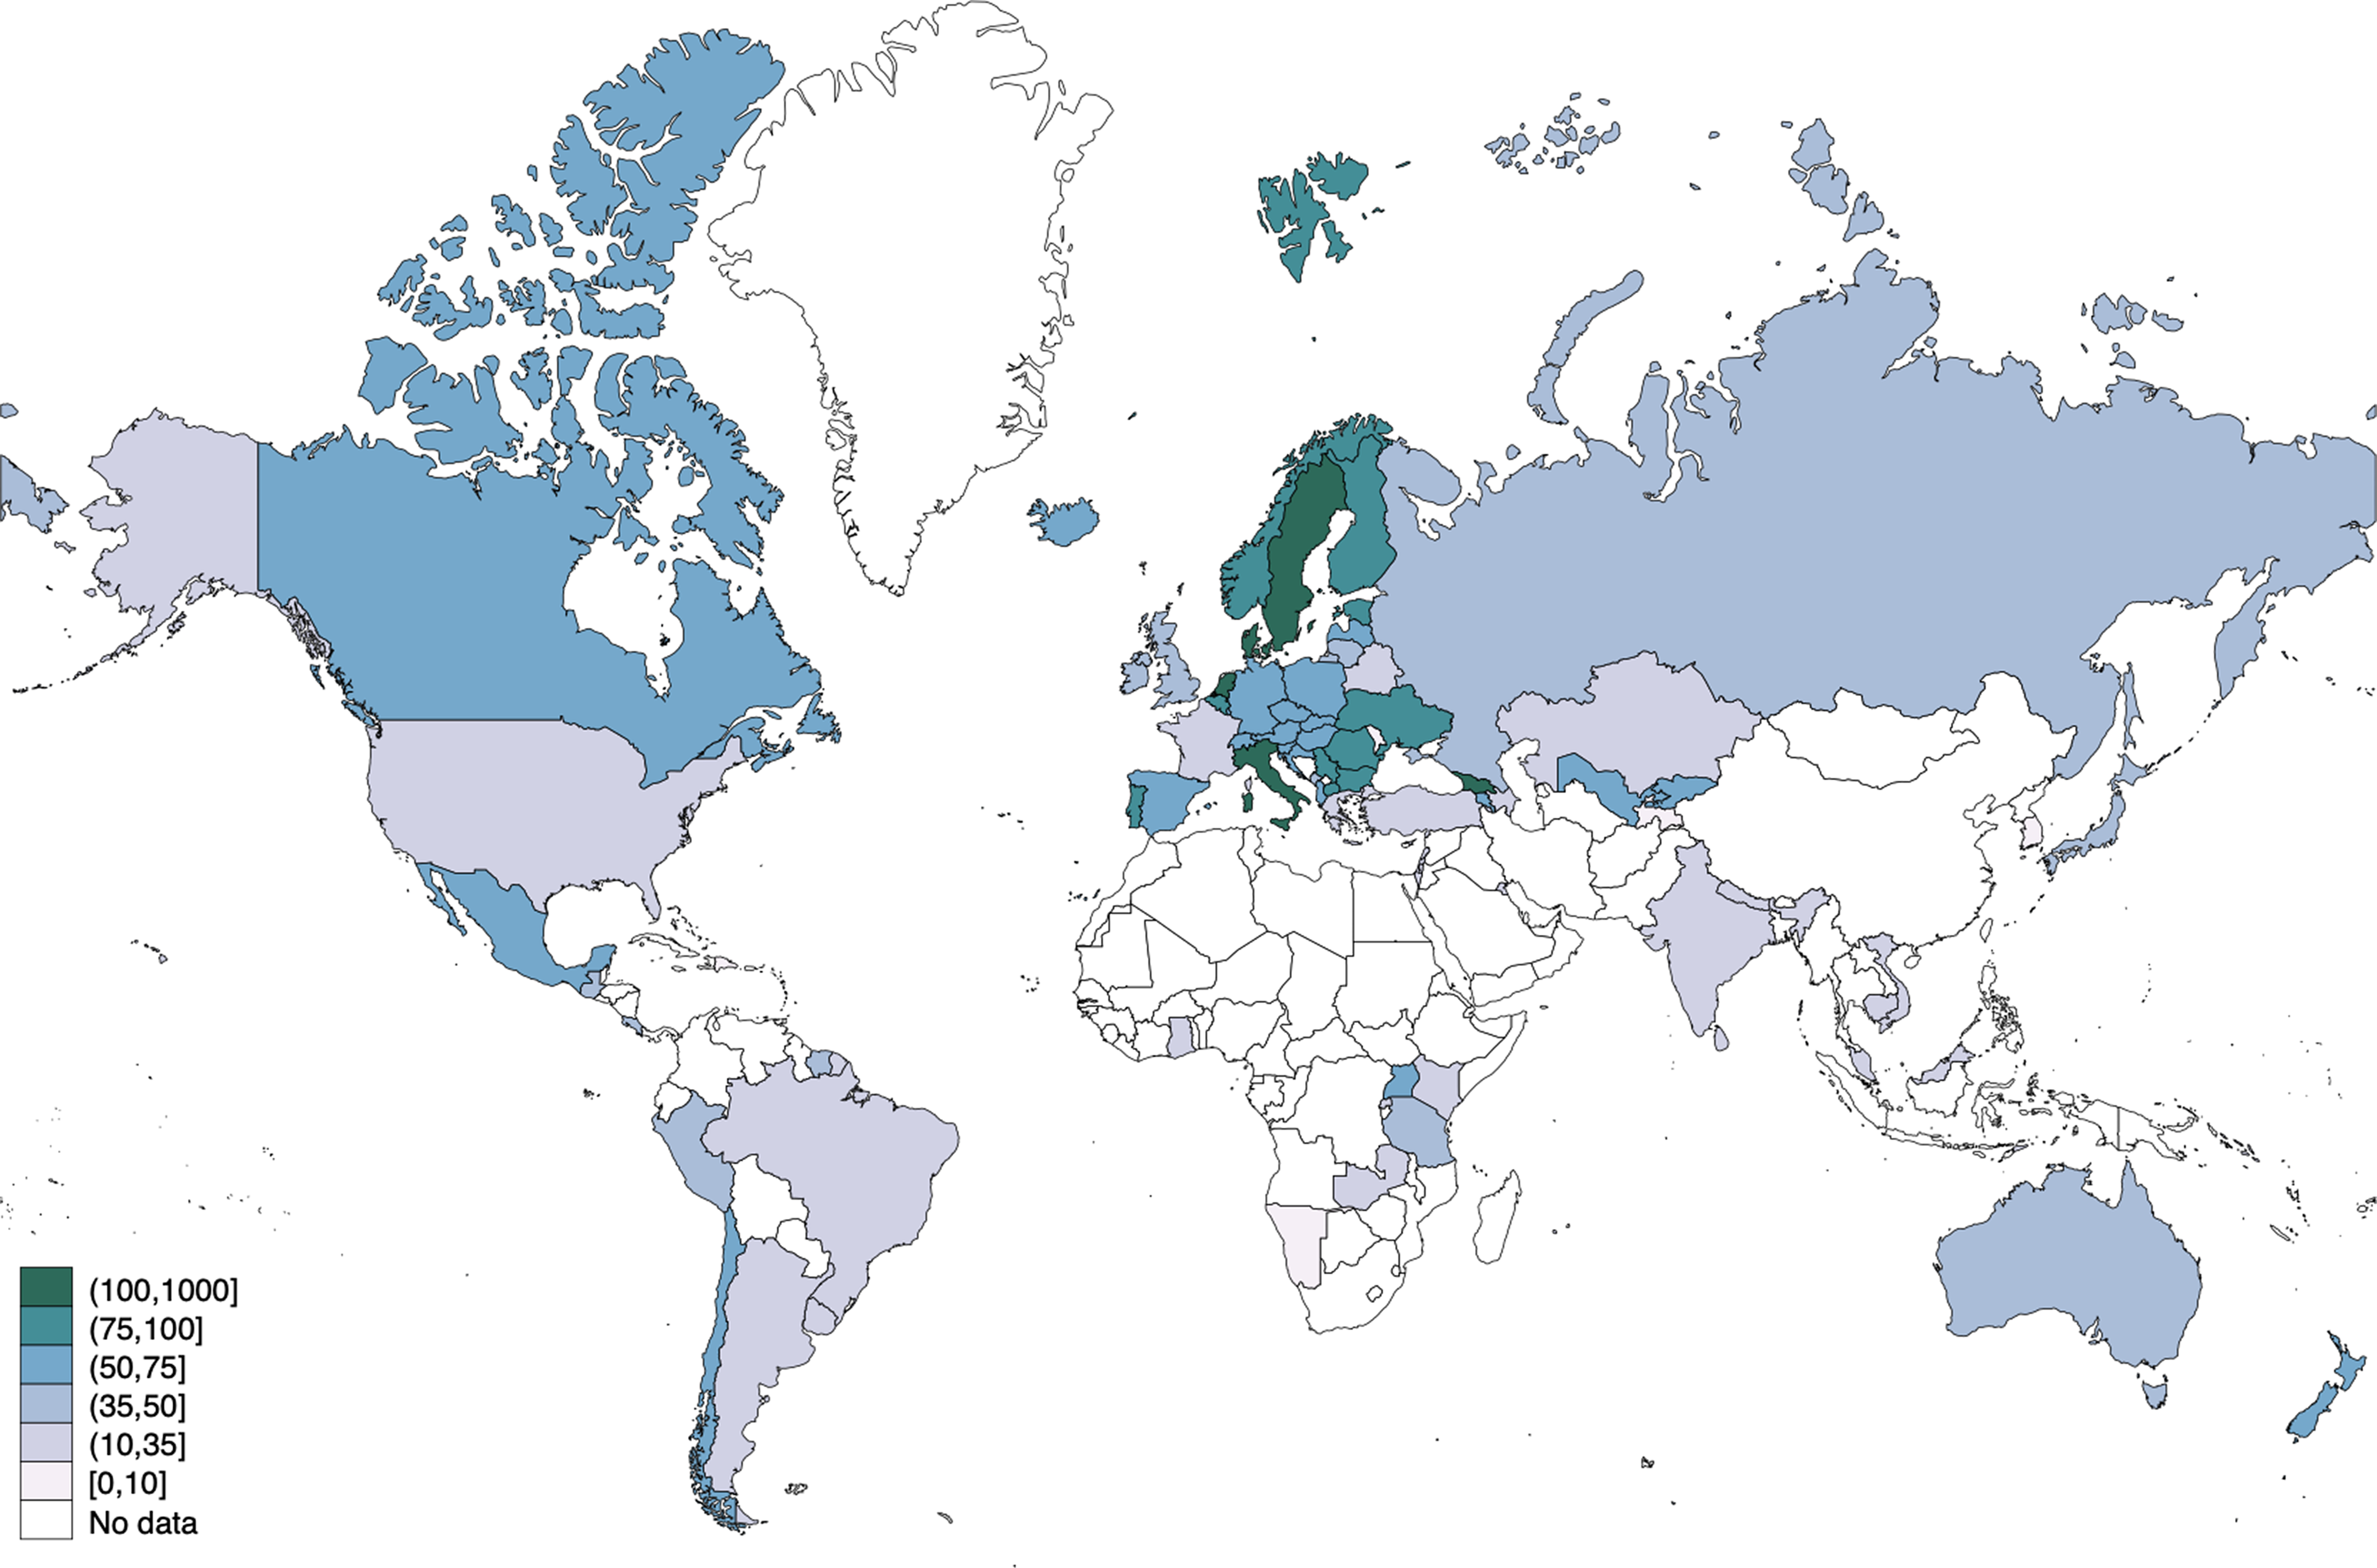
Figure 2 Youth Representation Across the Globe (YRI 40)
Note: The YRI 40 is a measure in which the percentage of youth in parliament—MPs ages 18 to 40 years—is divided by the proportion of youth (ages 18 to 40) within the eligible voting-age population and then multiplying by 100.
For the second measure of youth representation, the YRI 40, there is even greater variation, ranging from 0 for Palau to almost 150 for San Marino. This second measure also illustrates that the underrepresentation of 40-year-olds and younger at the time of election is less pronounced than the underrepresentation of those age 35 and younger. Nevertheless, this group is still underrepresented by a factor of two.
Regarding possible predictors of variation in youth representation, we find that three variables matter, regardless of whether the YRI 35 or the YRI 40 is regressed on the independent variables (see table 2). First, PR and mixed electoral systems increase the ratio between youth in parliament and in society. Models 1 and 2 predict a 13% and a 24% increase on the YRI 35 for PR and mixed electoral systems, respectively. The second variable that increases these indexes is the formal candidate-age requirement: the models predict that either of the two indexes decreases by more than 3 points for every year that the candidate-age requirement increases. In others words, the model predicts that the indexes decrease by about 25 points for a country where a person must be 25 years old to run for office in the national legislature compared to a country where the official required age is 18. Third, the gap between youth representation in parliament and in society is larger in countries with a young population; that is, the models predict an approximately two-year increase in the indexes for every year that the median age of a country increases. None of the other variables can explain the variance in these dependent variables. Especially for youth quotas, this was initially surprising. On second thought, however, both legislated and voluntary youth quotas are still selectively applied and, when applied, not fully respected. Although Gabon, Kenya, Kyrgyzstan, Morocco, the Philippines, Rwanda, and Tunisia all have legislative youth quotas—which in some cases even reserves a two-digit share of the seats in parliament for young adults (Inter-Parliamentary Union 2016)—these goals remain distant: the proportion of legislators age 30 years old and younger is, on average, only 2.4% in these countries. In other words, in practice, these countries do not enforce these youth quota laws.
Table 2 Determinants of Youth Representation Across Countries (OLS Regression Models)
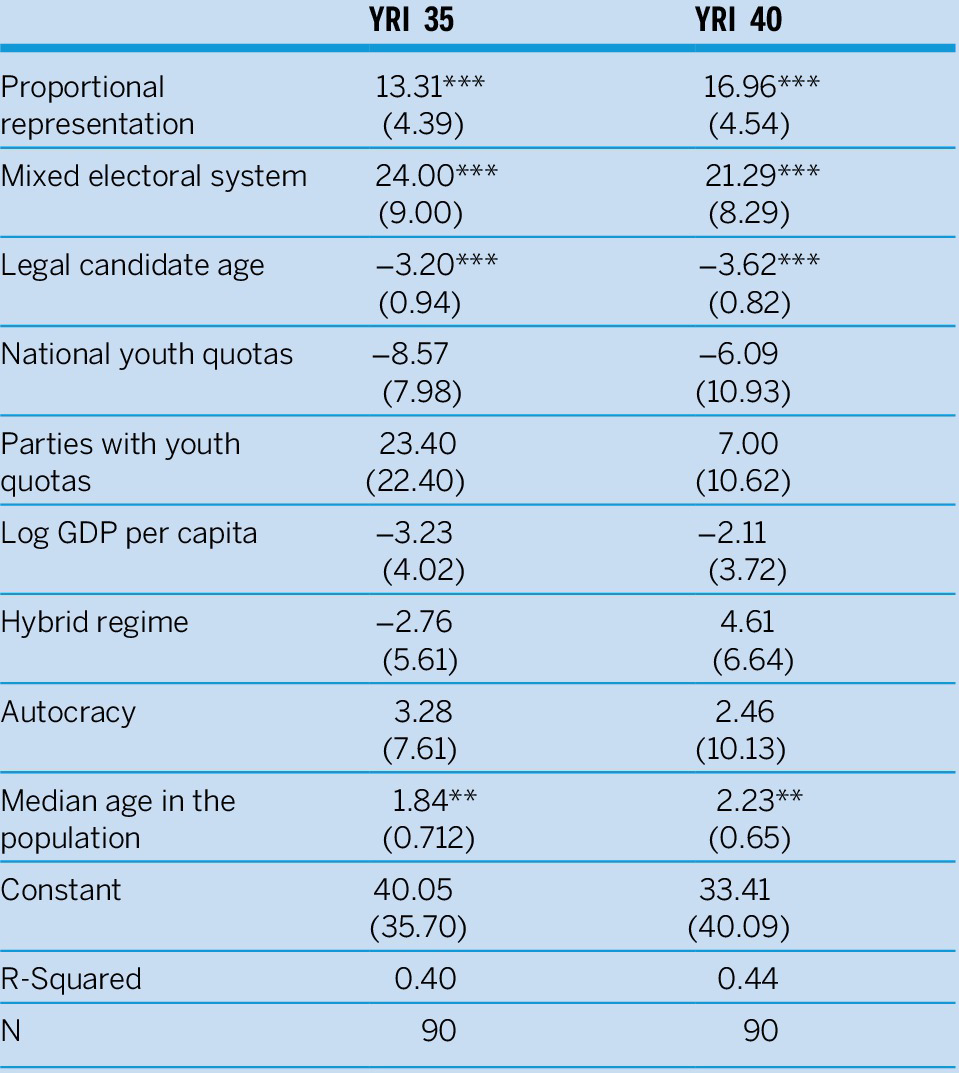
Notes: Standard errors in parentheses. *p<0.10, **p<0.05, ***p<0.01 (two-tailed).
CONCLUSION
By introducing the YRI, this article contributes to the budding literature on youth representation in three ways. First, we provide a better measurement for youth representation than the percentage of legislators younger than a certain age. Such a measure is static and cannot capture variation in the age distribution of populations. The gap between the two measures often is significant. To illustrate the benefit of these two measures, YRI 35 and YRI 40, both Guatemala and Portugal have approximately 15% of young adults ages 35 and younger in their national legislature. Yet, Portugal as a population is much older than Guatemala, which gives Portugal a higher index score (i.e., 56 versus 26).
Second, these indexes illustrate the full dimension of youths’ legislative underrepresentation across the globe. Young adults ages 18 to 35 years old are generally underrepresented by a factor of three. From both a normative and a more practical perspective, this is alarming. Normatively, how can a country live up to its (democratic) ideals if it marginalizes a group of the population to such a degree? More practically, these findings shed new light on the potential vicious cycle of youths’ political apathy. Young adults are still rather an anomaly in parliaments and, if we do not change course, they may become even more indifferent to the representative system. They may realize that the political class neglects their agenda and that representatives bear little resemblance to them.
Young adults are still rather an anomaly in parliaments and, if we do not change course, they may become even more indifferent to the representative system. They may realize that the political class neglects their agenda and that representatives bear little resemblance to them.
For policy, we recommend PR election systems and lowering the official candidate-age requirement to 18 years. However, these reforms will improve youths’ presence only moderately. To correct the imbalance between youth in parliament and in the population, it is likely that more drastic measures are necessary—for instance, youth quotas. These quotas should be designed considering youths’ presence in their respective society and enforced more rigorously to be effective. For research, we encourage further work on youths’ underrepresentation. We calculated the YRI for 90 national parliaments. Future research should collect more data as they become available for other elected assemblies as well as for cabinets—ideally, both cross sectional and over time. We suspect that renewed research will confirm that the underrepresentation of youth remains visible as well as flagrant.
Third, we strongly encourage future studies to more fully unpack the vicious cycle of youths’ underrepresentation. An important question to ask is to what extent young people are actually more likely to vote for young candidates. The literature hints at this direction (Pomante and Schraufnagel Reference Pomante and Schraufnagel2015; Saglie, Ødegård, and Aars Reference Saglie, Ødegård and Aars2015; Ulbig and Waggener Reference Ulbig and Waggener2011), but more research is necessary to establish the degree to which young voters actually demand young politicians.
SUPPLEMENTARY MATERIALS
To view supplementary material for this article, please visit http://dx.doi.org/10.1017/S1049096520000906.


 Open access